Cities with the Highest Percentage of Blackfeet Population in Oregon
RELATED REPORTS & OPTIONS
Blackfeet
Oregon
Compare Cities
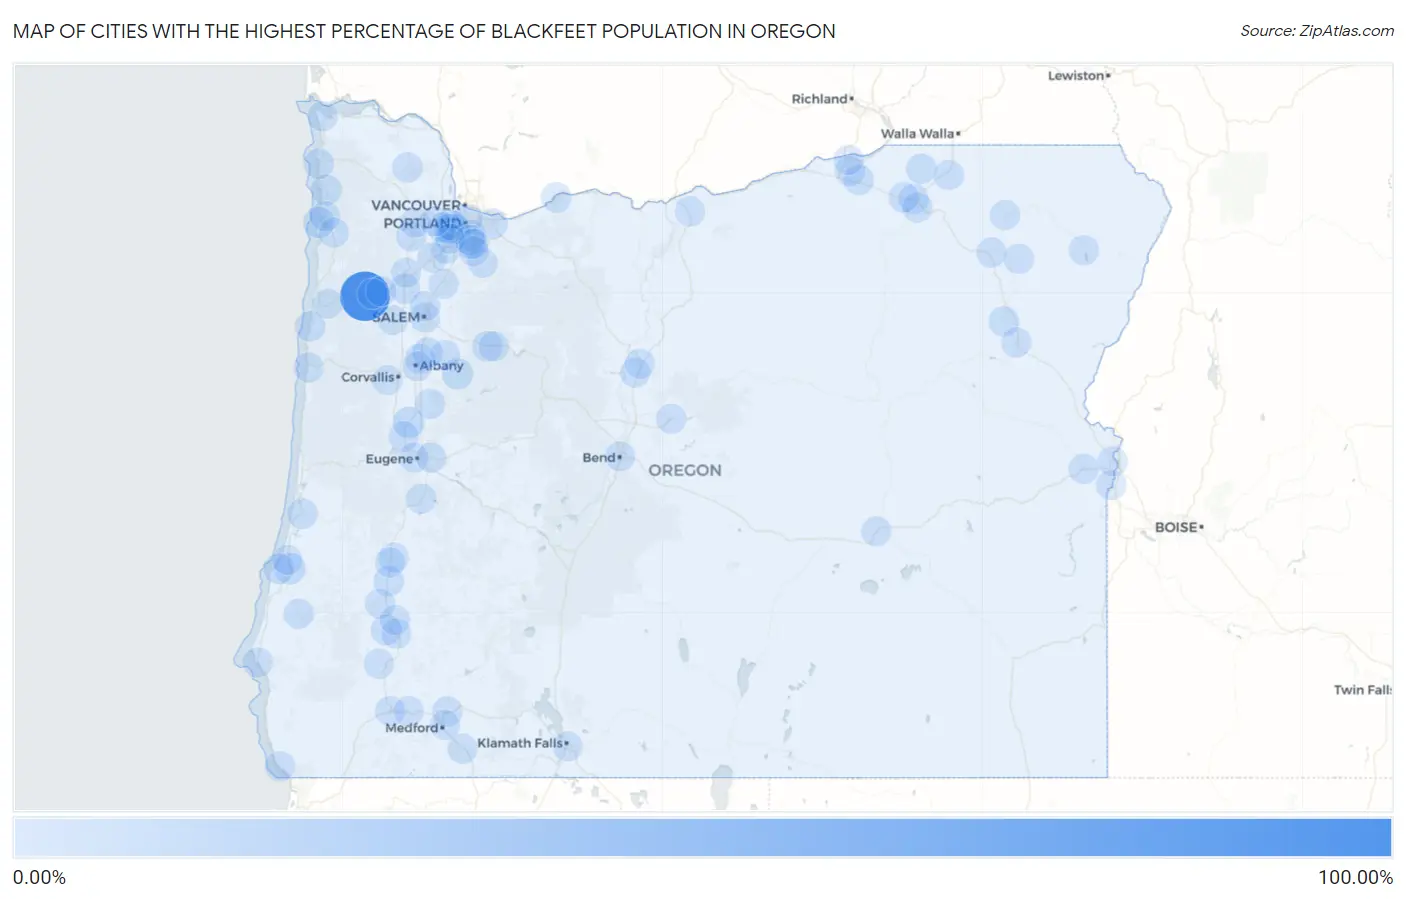
Map of Cities with the Highest Percentage of Blackfeet Population in Oregon
0.00%
100.00%
Cities with the Highest Percentage of Blackfeet Population in Oregon
| City | Blackfeet | vs State | vs National | |
| 1. | Fort Hill | 100.00% | 0.14%(+99.9)#1 | 0.062%(+99.9)#1 |
| 2. | Knappa | 7.41% | 0.14%(+7.26)#2 | 0.062%(+7.35)#57 |
| 3. | Harrisburg | 6.33% | 0.14%(+6.19)#3 | 0.062%(+6.27)#66 |
| 4. | Lacomb | 5.40% | 0.14%(+5.26)#4 | 0.062%(+5.34)#80 |
| 5. | Bunker Hill | 5.33% | 0.14%(+5.18)#5 | 0.062%(+5.26)#81 |
| 6. | Cape Meares | 4.52% | 0.14%(+4.38)#6 | 0.062%(+4.46)#94 |
| 7. | Nehalem | 2.97% | 0.14%(+2.83)#7 | 0.062%(+2.91)#149 |
| 8. | Jefferson | 2.44% | 0.14%(+2.29)#8 | 0.062%(+2.38)#175 |
| 9. | Riddle | 2.33% | 0.14%(+2.19)#9 | 0.062%(+2.27)#185 |
| 10. | Mill City | 2.33% | 0.14%(+2.18)#10 | 0.062%(+2.27)#187 |
| 11. | Barview | 2.32% | 0.14%(+2.17)#11 | 0.062%(+2.26)#191 |
| 12. | Junction City | 1.82% | 0.14%(+1.67)#12 | 0.062%(+1.75)#256 |
| 13. | Amity | 1.59% | 0.14%(+1.44)#13 | 0.062%(+1.53)#300 |
| 14. | Lincoln Beach | 1.37% | 0.14%(+1.22)#14 | 0.062%(+1.31)#362 |
| 15. | Roseburg North | 1.18% | 0.14%(+1.04)#15 | 0.062%(+1.12)#424 |
| 16. | Cannon Beach | 1.18% | 0.14%(+1.04)#16 | 0.062%(+1.12)#425 |
| 17. | Gaston | 1.13% | 0.14%(+0.990)#17 | 0.062%(+1.07)#435 |
| 18. | Helix | 1.12% | 0.14%(+0.973)#18 | 0.062%(+1.06)#439 |
| 19. | Reedsport | 1.00% | 0.14%(+0.854)#19 | 0.062%(+0.937)#487 |
| 20. | Myrtle Point | 0.93% | 0.14%(+0.785)#20 | 0.062%(+0.868)#525 |
| 21. | Haines | 0.91% | 0.14%(+0.764)#21 | 0.062%(+0.848)#544 |
| 22. | Stanfield | 0.89% | 0.14%(+0.748)#22 | 0.062%(+0.831)#560 |
| 23. | Gopher Flats | 0.78% | 0.14%(+0.637)#23 | 0.062%(+0.720)#635 |
| 24. | Glendale | 0.73% | 0.14%(+0.581)#24 | 0.062%(+0.664)#686 |
| 25. | Cascade Locks | 0.71% | 0.14%(+0.561)#25 | 0.062%(+0.644)#705 |
| 26. | Garibaldi | 0.70% | 0.14%(+0.554)#26 | 0.062%(+0.637)#708 |
| 27. | Sheridan | 0.64% | 0.14%(+0.497)#27 | 0.062%(+0.580)#765 |
| 28. | Millersburg | 0.64% | 0.14%(+0.496)#28 | 0.062%(+0.579)#766 |
| 29. | Cottage Grove | 0.58% | 0.14%(+0.432)#29 | 0.062%(+0.515)#844 |
| 30. | Vernonia | 0.57% | 0.14%(+0.424)#30 | 0.062%(+0.507)#852 |
| 31. | Dallas | 0.56% | 0.14%(+0.416)#31 | 0.062%(+0.499)#864 |
| 32. | Warrenton | 0.51% | 0.14%(+0.367)#32 | 0.062%(+0.450)#930 |
| 33. | Tutuilla | 0.51% | 0.14%(+0.362)#33 | 0.062%(+0.445)#940 |
| 34. | Brownsville | 0.49% | 0.14%(+0.347)#34 | 0.062%(+0.430)#974 |
| 35. | West Slope | 0.48% | 0.14%(+0.336)#35 | 0.062%(+0.419)#993 |
| 36. | Newport | 0.47% | 0.14%(+0.330)#36 | 0.062%(+0.413)#998 |
| 37. | Canyonville | 0.46% | 0.14%(+0.317)#37 | 0.062%(+0.400)#1,018 |
| 38. | Beavercreek | 0.44% | 0.14%(+0.297)#38 | 0.062%(+0.380)#1,053 |
| 39. | Metolius | 0.43% | 0.14%(+0.290)#39 | 0.062%(+0.373)#1,066 |
| 40. | Wasco | 0.41% | 0.14%(+0.270)#40 | 0.062%(+0.353)#1,109 |
| 41. | Weston | 0.41% | 0.14%(+0.269)#41 | 0.062%(+0.353)#1,110 |
| 42. | Vale | 0.39% | 0.14%(+0.248)#42 | 0.062%(+0.331)#1,150 |
| 43. | Joseph | 0.38% | 0.14%(+0.237)#43 | 0.062%(+0.320)#1,176 |
| 44. | River Road | 0.38% | 0.14%(+0.236)#44 | 0.062%(+0.319)#1,183 |
| 45. | Island City | 0.38% | 0.14%(+0.235)#45 | 0.062%(+0.318)#1,185 |
| 46. | Port Orford | 0.33% | 0.14%(+0.190)#46 | 0.062%(+0.273)#1,319 |
| 47. | Raleigh Hills | 0.33% | 0.14%(+0.182)#47 | 0.062%(+0.265)#1,337 |
| 48. | Sherwood | 0.32% | 0.14%(+0.176)#48 | 0.062%(+0.259)#1,362 |
| 49. | Hermiston | 0.31% | 0.14%(+0.162)#49 | 0.062%(+0.245)#1,416 |
| 50. | Willamina | 0.31% | 0.14%(+0.161)#50 | 0.062%(+0.245)#1,417 |
| 51. | Philomath | 0.29% | 0.14%(+0.150)#51 | 0.062%(+0.233)#1,457 |
| 52. | Santa Clara | 0.25% | 0.14%(+0.110)#52 | 0.062%(+0.193)#1,592 |
| 53. | North Bend | 0.25% | 0.14%(+0.109)#53 | 0.062%(+0.192)#1,598 |
| 54. | Grants Pass | 0.25% | 0.14%(+0.108)#54 | 0.062%(+0.191)#1,602 |
| 55. | Nyssa | 0.25% | 0.14%(+0.105)#55 | 0.062%(+0.188)#1,617 |
| 56. | Forest Grove | 0.25% | 0.14%(+0.104)#56 | 0.062%(+0.187)#1,629 |
| 57. | Scio | 0.23% | 0.14%(+0.088)#57 | 0.062%(+0.171)#1,683 |
| 58. | Gresham | 0.23% | 0.14%(+0.081)#58 | 0.062%(+0.164)#1,715 |
| 59. | Gates | 0.22% | 0.14%(+0.077)#59 | 0.062%(+0.160)#1,732 |
| 60. | Burns | 0.22% | 0.14%(+0.075)#60 | 0.062%(+0.158)#1,745 |
| 61. | Salem | 0.22% | 0.14%(+0.073)#61 | 0.062%(+0.156)#1,750 |
| 62. | Eugene | 0.21% | 0.14%(+0.069)#62 | 0.062%(+0.152)#1,763 |
| 63. | Cedar Hills | 0.21% | 0.14%(+0.065)#63 | 0.062%(+0.148)#1,783 |
| 64. | Milwaukie | 0.19% | 0.14%(+0.049)#64 | 0.062%(+0.132)#1,868 |
| 65. | Ontario | 0.19% | 0.14%(+0.045)#65 | 0.062%(+0.128)#1,884 |
| 66. | Elgin | 0.19% | 0.14%(+0.042)#66 | 0.062%(+0.126)#1,896 |
| 67. | Aloha | 0.18% | 0.14%(+0.037)#67 | 0.062%(+0.120)#1,935 |
| 68. | White City | 0.18% | 0.14%(+0.035)#68 | 0.062%(+0.118)#1,943 |
| 69. | Ashland | 0.18% | 0.14%(+0.033)#69 | 0.062%(+0.116)#1,957 |
| 70. | Jennings Lodge | 0.16% | 0.14%(+0.012)#70 | 0.062%(+0.095)#2,057 |
| 71. | Oakland | 0.16% | 0.14%(+0.011)#71 | 0.062%(+0.094)#2,069 |
| 72. | Springfield | 0.15% | 0.14%(+0.004)#72 | 0.062%(+0.087)#2,123 |
| 73. | Umatilla | 0.15% | 0.14%(+0.003)#73 | 0.062%(+0.086)#2,131 |
| 74. | Cove | 0.15% | 0.14%(+0.003)#74 | 0.062%(+0.086)#2,132 |
| 75. | Madras | 0.15% | 0.14%(+0.002)#75 | 0.062%(+0.085)#2,144 |
| 76. | Sutherlin | 0.14% | 0.14%(-0.004)#76 | 0.062%(+0.079)#2,183 |
| 77. | Rose Lodge | 0.13% | 0.14%(-0.011)#77 | 0.062%(+0.073)#2,243 |
| 78. | Albany | 0.13% | 0.14%(-0.015)#78 | 0.062%(+0.068)#2,278 |
| 79. | Winston | 0.12% | 0.14%(-0.020)#79 | 0.062%(+0.063)#2,314 |
| 80. | Newberg | 0.12% | 0.14%(-0.023)#80 | 0.062%(+0.061)#2,341 |
| 81. | Portland | 0.12% | 0.14%(-0.024)#81 | 0.062%(+0.059)#2,355 |
| 82. | Prineville | 0.12% | 0.14%(-0.026)#82 | 0.062%(+0.058)#2,372 |
| 83. | Brookings | 0.12% | 0.14%(-0.026)#83 | 0.062%(+0.057)#2,374 |
| 84. | Baker City | 0.11% | 0.14%(-0.036)#84 | 0.062%(+0.047)#2,485 |
| 85. | Medford | 0.11% | 0.14%(-0.036)#85 | 0.062%(+0.047)#2,488 |
| 86. | Oak Grove | 0.097% | 0.14%(-0.048)#86 | 0.062%(+0.035)#2,595 |
| 87. | Beaverton | 0.093% | 0.14%(-0.051)#87 | 0.062%(+0.032)#2,624 |
| 88. | Tigard | 0.078% | 0.14%(-0.067)#88 | 0.062%(+0.016)#2,793 |
| 89. | Bend | 0.075% | 0.14%(-0.069)#89 | 0.062%(+0.014)#2,827 |
| 90. | Mcminnville | 0.070% | 0.14%(-0.075)#90 | 0.062%(+0.008)#2,892 |
| 91. | Hillsboro | 0.065% | 0.14%(-0.080)#91 | 0.062%(+0.003)#2,962 |
| 92. | Keizer | 0.059% | 0.14%(-0.086)#92 | 0.062%(-0.003)#3,051 |
| 93. | Gladstone | 0.058% | 0.14%(-0.086)#93 | 0.062%(-0.003)#3,056 |
| 94. | Klamath Falls | 0.055% | 0.14%(-0.090)#94 | 0.062%(-0.007)#3,114 |
| 95. | Pendleton | 0.053% | 0.14%(-0.092)#95 | 0.062%(-0.009)#3,141 |
| 96. | Rogue River | 0.050% | 0.14%(-0.095)#96 | 0.062%(-0.011)#3,175 |
| 97. | Tillamook | 0.038% | 0.14%(-0.106)#97 | 0.062%(-0.023)#3,404 |
| 98. | Woodburn | 0.031% | 0.14%(-0.114)#98 | 0.062%(-0.031)#3,551 |
| 99. | Myrtle Creek | 0.029% | 0.14%(-0.116)#99 | 0.062%(-0.033)#3,587 |
| 100. | Oregon City | 0.027% | 0.14%(-0.118)#100 | 0.062%(-0.035)#3,630 |
Common Questions
What are the Top 10 Cities with the Highest Percentage of Blackfeet Population in Oregon?
Top 10 Cities with the Highest Percentage of Blackfeet Population in Oregon are:
#1
100.00%
#2
6.33%
#3
5.40%
#4
5.33%
#5
4.52%
#6
2.97%
#7
2.44%
#8
2.33%
#9
2.33%
#10
2.32%
What city has the Highest Percentage of Blackfeet Population in Oregon?
Fort Hill has the Highest Percentage of Blackfeet Population in Oregon with 100.00%.
What is the Percentage of Blackfeet Population in the State of Oregon?
Percentage of Blackfeet Population in Oregon is 0.14%.
What is the Percentage of Blackfeet Population in the United States?
Percentage of Blackfeet Population in the United States is 0.062%.