Cities with the Highest Percentage of Blackfeet Population in North Carolina
RELATED REPORTS & OPTIONS
Blackfeet
North Carolina
Compare Cities
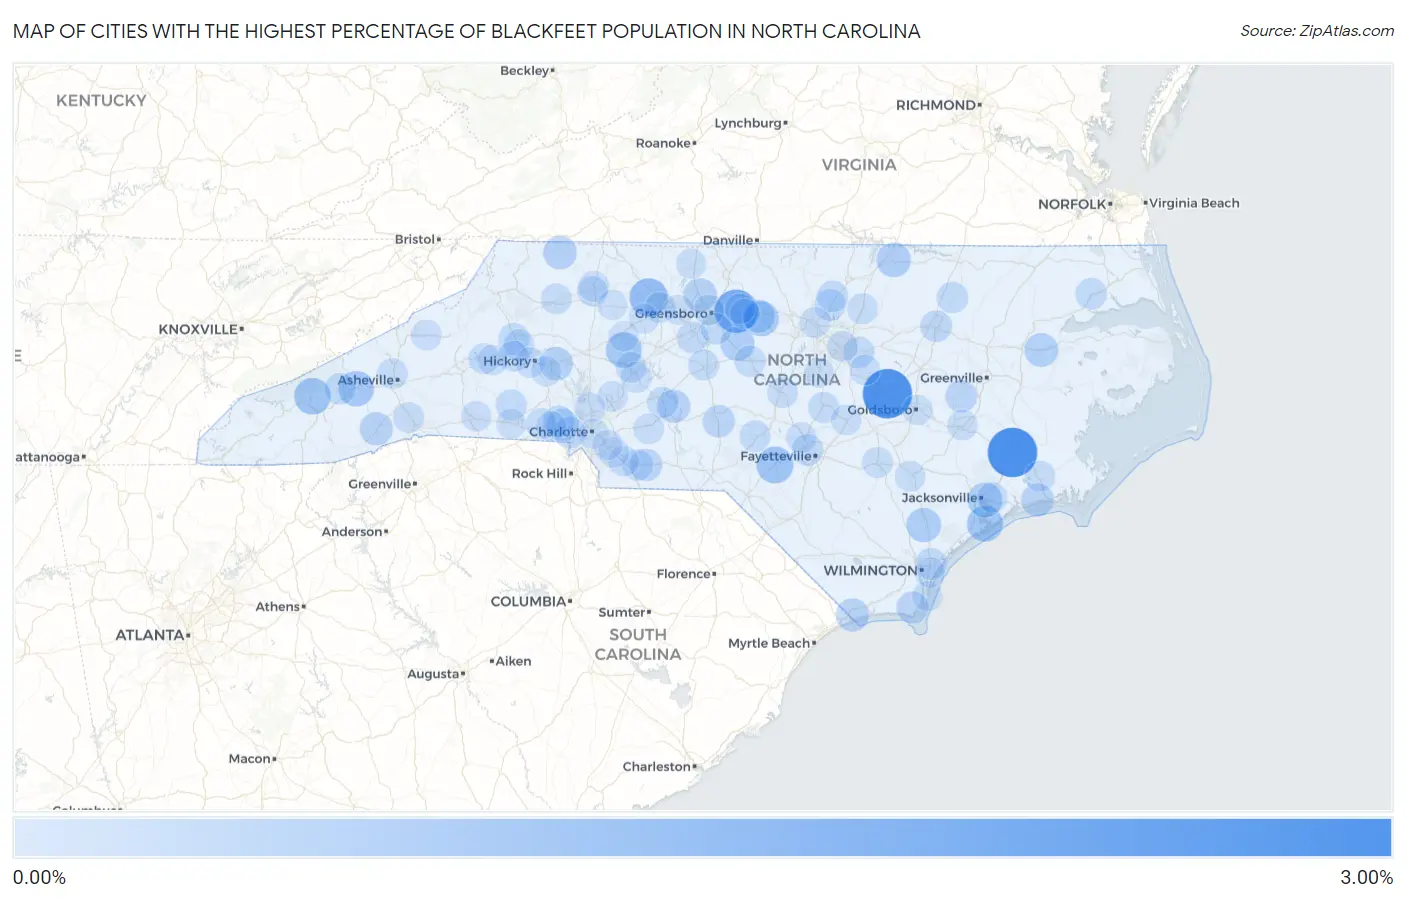
Map of Cities with the Highest Percentage of Blackfeet Population in North Carolina
0.00%
3.00%
Cities with the Highest Percentage of Blackfeet Population in North Carolina
| City | Blackfeet | vs State | vs National | |
| 1. | River Bend | 2.81% | 0.061%(+2.75)#1 | 0.062%(+2.75)#153 |
| 2. | Pine Level | 2.79% | 0.061%(+2.73)#2 | 0.062%(+2.73)#154 |
| 3. | Whitsett | 1.90% | 0.061%(+1.84)#3 | 0.062%(+1.84)#244 |
| 4. | Bethania | 1.19% | 0.061%(+1.13)#4 | 0.062%(+1.13)#421 |
| 5. | Raeford | 0.96% | 0.061%(+0.902)#5 | 0.062%(+0.901)#507 |
| 6. | Cherokee | 0.94% | 0.061%(+0.874)#6 | 0.062%(+0.874)#519 |
| 7. | Sneads Ferry | 0.84% | 0.061%(+0.780)#7 | 0.062%(+0.780)#589 |
| 8. | Cooleemee | 0.80% | 0.061%(+0.739)#8 | 0.062%(+0.738)#617 |
| 9. | Clyde | 0.77% | 0.061%(+0.711)#9 | 0.062%(+0.711)#643 |
| 10. | Swepsonville | 0.73% | 0.061%(+0.669)#10 | 0.062%(+0.669)#681 |
| 11. | Jacksonville | 0.67% | 0.061%(+0.608)#11 | 0.062%(+0.607)#740 |
| 12. | Burgaw | 0.62% | 0.061%(+0.562)#12 | 0.062%(+0.562)#787 |
| 13. | Norlina | 0.60% | 0.061%(+0.537)#13 | 0.062%(+0.537)#816 |
| 14. | Liberty | 0.56% | 0.061%(+0.501)#14 | 0.062%(+0.501)#859 |
| 15. | Jamesville | 0.52% | 0.061%(+0.460)#15 | 0.062%(+0.459)#920 |
| 16. | Sparta | 0.50% | 0.061%(+0.440)#16 | 0.062%(+0.440)#951 |
| 17. | Summerfield | 0.47% | 0.061%(+0.412)#17 | 0.062%(+0.412)#1,000 |
| 18. | Claremont | 0.47% | 0.061%(+0.412)#18 | 0.062%(+0.412)#1,001 |
| 19. | Brevard | 0.44% | 0.061%(+0.376)#19 | 0.062%(+0.376)#1,062 |
| 20. | Badin | 0.43% | 0.061%(+0.373)#20 | 0.062%(+0.372)#1,068 |
| 21. | Calabash | 0.43% | 0.061%(+0.367)#21 | 0.062%(+0.366)#1,086 |
| 22. | Graham | 0.40% | 0.061%(+0.341)#22 | 0.062%(+0.341)#1,131 |
| 23. | Broad Creek | 0.40% | 0.061%(+0.336)#23 | 0.062%(+0.336)#1,142 |
| 24. | Candor | 0.34% | 0.061%(+0.281)#24 | 0.062%(+0.281)#1,289 |
| 25. | Lowell | 0.33% | 0.061%(+0.264)#25 | 0.062%(+0.263)#1,345 |
| 26. | Marshville | 0.31% | 0.061%(+0.251)#26 | 0.062%(+0.250)#1,387 |
| 27. | Maury | 0.28% | 0.061%(+0.223)#27 | 0.062%(+0.223)#1,492 |
| 28. | Southport | 0.27% | 0.061%(+0.213)#28 | 0.062%(+0.212)#1,518 |
| 29. | Belmont | 0.25% | 0.061%(+0.188)#29 | 0.062%(+0.188)#1,620 |
| 30. | Rocky Mount | 0.23% | 0.061%(+0.169)#30 | 0.062%(+0.169)#1,692 |
| 31. | Ranlo | 0.22% | 0.061%(+0.162)#31 | 0.062%(+0.161)#1,725 |
| 32. | Winfall | 0.22% | 0.061%(+0.161)#32 | 0.062%(+0.161)#1,729 |
| 33. | Archdale | 0.21% | 0.061%(+0.149)#33 | 0.062%(+0.149)#1,778 |
| 34. | Fayetteville | 0.21% | 0.061%(+0.148)#34 | 0.062%(+0.148)#1,782 |
| 35. | Enfield | 0.20% | 0.061%(+0.142)#35 | 0.062%(+0.142)#1,806 |
| 36. | Pleasant Garden | 0.20% | 0.061%(+0.139)#36 | 0.062%(+0.139)#1,824 |
| 37. | Kings Grant | 0.20% | 0.061%(+0.137)#37 | 0.062%(+0.137)#1,836 |
| 38. | Butner | 0.19% | 0.061%(+0.130)#38 | 0.062%(+0.129)#1,880 |
| 39. | Stem | 0.19% | 0.061%(+0.126)#39 | 0.062%(+0.125)#1,901 |
| 40. | Knightdale | 0.18% | 0.061%(+0.122)#40 | 0.062%(+0.121)#1,922 |
| 41. | Maggie Valley | 0.18% | 0.061%(+0.121)#41 | 0.062%(+0.121)#1,927 |
| 42. | Lenoir | 0.18% | 0.061%(+0.119)#42 | 0.062%(+0.119)#1,939 |
| 43. | Siler City | 0.18% | 0.061%(+0.117)#43 | 0.062%(+0.117)#1,953 |
| 44. | Southern Pines | 0.18% | 0.061%(+0.117)#44 | 0.062%(+0.117)#1,955 |
| 45. | Lillington | 0.18% | 0.061%(+0.114)#45 | 0.062%(+0.114)#1,967 |
| 46. | Lawndale | 0.17% | 0.061%(+0.106)#46 | 0.062%(+0.105)#2,007 |
| 47. | Hudson | 0.16% | 0.061%(+0.098)#47 | 0.062%(+0.097)#2,043 |
| 48. | New London | 0.15% | 0.061%(+0.087)#48 | 0.062%(+0.087)#2,128 |
| 49. | Wingate | 0.15% | 0.061%(+0.087)#49 | 0.062%(+0.086)#2,137 |
| 50. | Asheboro | 0.14% | 0.061%(+0.079)#50 | 0.062%(+0.079)#2,195 |
| 51. | Granite Quarry | 0.13% | 0.061%(+0.073)#51 | 0.062%(+0.072)#2,246 |
| 52. | Sanford | 0.13% | 0.061%(+0.067)#52 | 0.062%(+0.067)#2,287 |
| 53. | Bessemer City | 0.13% | 0.061%(+0.067)#53 | 0.062%(+0.066)#2,294 |
| 54. | Durham | 0.13% | 0.061%(+0.065)#54 | 0.062%(+0.065)#2,302 |
| 55. | Oakboro | 0.13% | 0.061%(+0.065)#55 | 0.062%(+0.065)#2,304 |
| 56. | Grandy | 0.12% | 0.061%(+0.062)#56 | 0.062%(+0.061)#2,331 |
| 57. | Winston Salem | 0.12% | 0.061%(+0.062)#57 | 0.062%(+0.061)#2,332 |
| 58. | Franklinton | 0.12% | 0.061%(+0.060)#58 | 0.062%(+0.060)#2,349 |
| 59. | North Wilkesboro | 0.11% | 0.061%(+0.054)#59 | 0.062%(+0.053)#2,429 |
| 60. | Clinton | 0.11% | 0.061%(+0.046)#60 | 0.062%(+0.046)#2,495 |
| 61. | Hendersonville | 0.11% | 0.061%(+0.045)#61 | 0.062%(+0.044)#2,510 |
| 62. | Magnolia | 0.11% | 0.061%(+0.045)#62 | 0.062%(+0.044)#2,511 |
| 63. | Glen Alpine | 0.11% | 0.061%(+0.044)#63 | 0.062%(+0.044)#2,514 |
| 64. | Woodfin | 0.10% | 0.061%(+0.040)#64 | 0.062%(+0.040)#2,549 |
| 65. | Elkin | 0.099% | 0.061%(+0.038)#65 | 0.062%(+0.038)#2,573 |
| 66. | Havelock | 0.095% | 0.061%(+0.034)#66 | 0.062%(+0.034)#2,612 |
| 67. | Salisbury | 0.090% | 0.061%(+0.029)#67 | 0.062%(+0.029)#2,654 |
| 68. | Rutherford College | 0.089% | 0.061%(+0.028)#68 | 0.062%(+0.028)#2,660 |
| 69. | Greensboro | 0.089% | 0.061%(+0.028)#69 | 0.062%(+0.027)#2,666 |
| 70. | Kinston | 0.086% | 0.061%(+0.025)#70 | 0.062%(+0.025)#2,692 |
| 71. | Burnsville | 0.084% | 0.061%(+0.023)#71 | 0.062%(+0.022)#2,722 |
| 72. | Dunn | 0.082% | 0.061%(+0.021)#72 | 0.062%(+0.020)#2,752 |
| 73. | Jonesville | 0.076% | 0.061%(+0.015)#73 | 0.062%(+0.014)#2,820 |
| 74. | Monroe | 0.072% | 0.061%(+0.010)#74 | 0.062%(+0.010)#2,881 |
| 75. | Spring Lake | 0.068% | 0.061%(+0.007)#75 | 0.062%(+0.007)#2,907 |
| 76. | Raleigh | 0.068% | 0.061%(+0.007)#76 | 0.062%(+0.007)#2,908 |
| 77. | Gibsonville | 0.068% | 0.061%(+0.007)#77 | 0.062%(+0.006)#2,914 |
| 78. | Kannapolis | 0.066% | 0.061%(+0.004)#78 | 0.062%(+0.004)#2,948 |
| 79. | Goldsboro | 0.063% | 0.061%(+0.001)#79 | 0.062%(+0.001)#2,999 |
| 80. | Long View | 0.060% | 0.061%(-0.002)#80 | 0.062%(-0.002)#3,039 |
| 81. | Clayton | 0.056% | 0.061%(-0.005)#81 | 0.062%(-0.006)#3,102 |
| 82. | Forest City | 0.054% | 0.061%(-0.007)#82 | 0.062%(-0.007)#3,120 |
| 83. | Huntersville | 0.054% | 0.061%(-0.007)#83 | 0.062%(-0.008)#3,127 |
| 84. | Indian Trail | 0.052% | 0.061%(-0.009)#84 | 0.062%(-0.009)#3,154 |
| 85. | Piney Green | 0.047% | 0.061%(-0.014)#85 | 0.062%(-0.014)#3,221 |
| 86. | Charlotte | 0.047% | 0.061%(-0.014)#86 | 0.062%(-0.014)#3,228 |
| 87. | Morganton | 0.046% | 0.061%(-0.015)#87 | 0.062%(-0.016)#3,250 |
| 88. | Mayodan | 0.041% | 0.061%(-0.020)#88 | 0.062%(-0.021)#3,342 |
| 89. | Matthews | 0.041% | 0.061%(-0.021)#89 | 0.062%(-0.021)#3,353 |
| 90. | Gastonia | 0.037% | 0.061%(-0.024)#90 | 0.062%(-0.024)#3,418 |
| 91. | Shelby | 0.037% | 0.061%(-0.024)#91 | 0.062%(-0.025)#3,425 |
| 92. | Mocksville | 0.034% | 0.061%(-0.027)#92 | 0.062%(-0.028)#3,480 |
| 93. | Yadkinville | 0.034% | 0.061%(-0.028)#93 | 0.062%(-0.028)#3,486 |
| 94. | Carolina Beach | 0.030% | 0.061%(-0.031)#94 | 0.062%(-0.031)#3,552 |
| 95. | Newton | 0.030% | 0.061%(-0.031)#95 | 0.062%(-0.031)#3,553 |
| 96. | Kernersville | 0.029% | 0.061%(-0.032)#96 | 0.062%(-0.032)#3,567 |
| 97. | Wilmington | 0.028% | 0.061%(-0.033)#97 | 0.062%(-0.033)#3,598 |
| 98. | Clemmons | 0.023% | 0.061%(-0.038)#98 | 0.062%(-0.038)#3,687 |
| 99. | Holly Springs | 0.019% | 0.061%(-0.042)#99 | 0.062%(-0.043)#3,761 |
| 100. | Burlington | 0.018% | 0.061%(-0.044)#100 | 0.062%(-0.044)#3,796 |
Common Questions
What are the Top 10 Cities with the Highest Percentage of Blackfeet Population in North Carolina?
Top 10 Cities with the Highest Percentage of Blackfeet Population in North Carolina are:
#1
2.81%
#2
2.79%
#3
1.90%
#4
1.19%
#5
0.96%
#6
0.94%
#7
0.84%
#8
0.80%
#9
0.77%
#10
0.73%
What city has the Highest Percentage of Blackfeet Population in North Carolina?
River Bend has the Highest Percentage of Blackfeet Population in North Carolina with 2.81%.
What is the Percentage of Blackfeet Population in the State of North Carolina?
Percentage of Blackfeet Population in North Carolina is 0.061%.
What is the Percentage of Blackfeet Population in the United States?
Percentage of Blackfeet Population in the United States is 0.062%.