Cities with the Highest Percentage of Blackfeet Population in Indiana
RELATED REPORTS & OPTIONS
Blackfeet
Indiana
Compare Cities
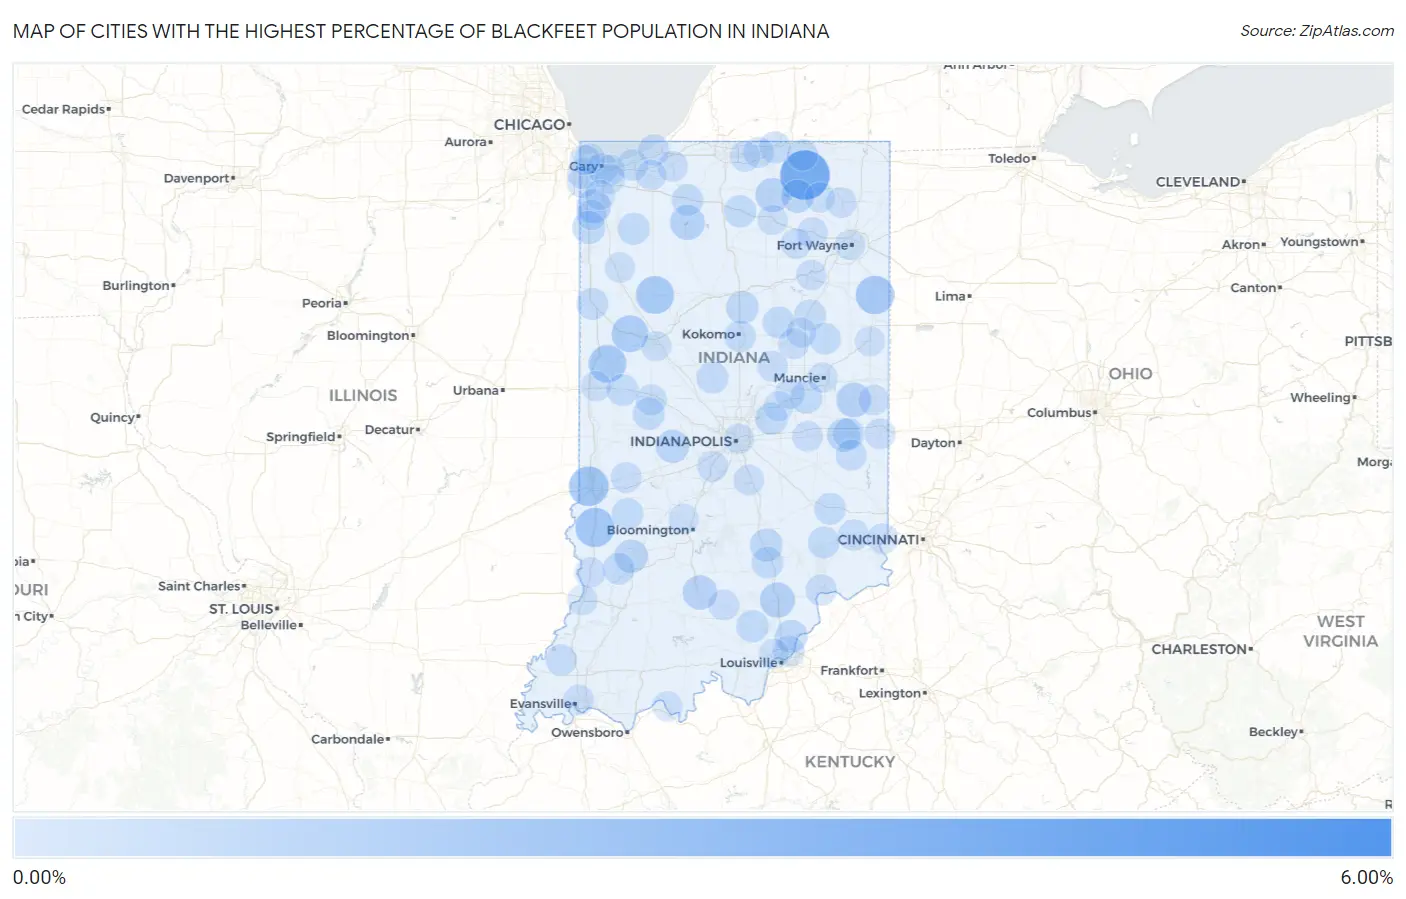
Map of Cities with the Highest Percentage of Blackfeet Population in Indiana
0.00%
6.00%
Cities with the Highest Percentage of Blackfeet Population in Indiana
| City | Blackfeet | vs State | vs National | |
| 1. | East Oolitic | 5.71% | 0.047%(+5.67)#1 | 0.062%(+5.65)#76 |
| 2. | Thayer | 5.41% | 0.047%(+5.36)#2 | 0.062%(+5.35)#79 |
| 3. | Topeka | 3.71% | 0.047%(+3.66)#3 | 0.062%(+3.65)#118 |
| 4. | West Terre Haute | 1.79% | 0.047%(+1.75)#4 | 0.062%(+1.73)#259 |
| 5. | Shelburn | 1.72% | 0.047%(+1.67)#5 | 0.062%(+1.66)#268 |
| 6. | Monroe | 1.56% | 0.047%(+1.52)#6 | 0.062%(+1.50)#305 |
| 7. | Reynolds | 1.47% | 0.047%(+1.42)#7 | 0.062%(+1.40)#335 |
| 8. | Williamsport | 1.41% | 0.047%(+1.36)#8 | 0.062%(+1.35)#353 |
| 9. | Otterbein | 1.26% | 0.047%(+1.21)#9 | 0.062%(+1.19)#397 |
| 10. | Scottsburg | 0.94% | 0.047%(+0.896)#10 | 0.062%(+0.882)#512 |
| 11. | Modoc | 0.90% | 0.047%(+0.849)#11 | 0.062%(+0.835)#557 |
| 12. | Bass Lake | 0.88% | 0.047%(+0.837)#12 | 0.062%(+0.823)#563 |
| 13. | Mitchell | 0.81% | 0.047%(+0.763)#13 | 0.062%(+0.749)#610 |
| 14. | Milford | 0.79% | 0.047%(+0.747)#14 | 0.062%(+0.733)#623 |
| 15. | Lake Dalecarlia | 0.76% | 0.047%(+0.712)#15 | 0.062%(+0.698)#650 |
| 16. | Dublin | 0.62% | 0.047%(+0.577)#16 | 0.062%(+0.563)#786 |
| 17. | Lyons | 0.62% | 0.047%(+0.576)#17 | 0.062%(+0.562)#788 |
| 18. | Heritage Lake | 0.58% | 0.047%(+0.530)#18 | 0.062%(+0.516)#839 |
| 19. | Cromwell | 0.55% | 0.047%(+0.505)#19 | 0.062%(+0.491)#873 |
| 20. | Schneider | 0.53% | 0.047%(+0.487)#20 | 0.062%(+0.473)#892 |
| 21. | Charlestown | 0.53% | 0.047%(+0.479)#21 | 0.062%(+0.464)#911 |
| 22. | Jonesville | 0.51% | 0.047%(+0.463)#22 | 0.062%(+0.449)#934 |
| 23. | Bunker Hill | 0.47% | 0.047%(+0.424)#23 | 0.062%(+0.410)#1,003 |
| 24. | Fortville | 0.42% | 0.047%(+0.375)#24 | 0.062%(+0.361)#1,091 |
| 25. | Middletown | 0.41% | 0.047%(+0.362)#25 | 0.062%(+0.347)#1,119 |
| 26. | New Pekin | 0.41% | 0.047%(+0.361)#26 | 0.062%(+0.347)#1,122 |
| 27. | Bourbon | 0.40% | 0.047%(+0.353)#27 | 0.062%(+0.339)#1,136 |
| 28. | Sweetser | 0.36% | 0.047%(+0.314)#28 | 0.062%(+0.300)#1,224 |
| 29. | New Market | 0.35% | 0.047%(+0.305)#29 | 0.062%(+0.291)#1,254 |
| 30. | Wheatfield | 0.35% | 0.047%(+0.304)#30 | 0.062%(+0.290)#1,256 |
| 31. | Kirklin | 0.35% | 0.047%(+0.299)#31 | 0.062%(+0.285)#1,276 |
| 32. | Seymour | 0.34% | 0.047%(+0.289)#32 | 0.062%(+0.275)#1,309 |
| 33. | Bristol | 0.32% | 0.047%(+0.275)#33 | 0.062%(+0.261)#1,356 |
| 34. | Sandborn | 0.32% | 0.047%(+0.271)#34 | 0.062%(+0.257)#1,365 |
| 35. | Earl Park | 0.32% | 0.047%(+0.268)#35 | 0.062%(+0.254)#1,377 |
| 36. | Lake Holiday Hideaway | 0.31% | 0.047%(+0.260)#37 | 0.062%(+0.246)#1,401 |
| 37. | New Point | 0.31% | 0.047%(+0.260)#38 | 0.062%(+0.246)#1,402 |
| 38. | Holton | 0.31% | 0.047%(+0.259)#39 | 0.062%(+0.245)#1,411 |
| 39. | Hillsboro | 0.31% | 0.047%(+0.259)#40 | 0.062%(+0.245)#1,415 |
| 40. | Hartford City | 0.28% | 0.047%(+0.229)#41 | 0.062%(+0.215)#1,513 |
| 41. | Cambridge City | 0.27% | 0.047%(+0.224)#42 | 0.062%(+0.209)#1,527 |
| 42. | Clay City | 0.26% | 0.047%(+0.217)#43 | 0.062%(+0.203)#1,556 |
| 43. | Hamlet | 0.26% | 0.047%(+0.211)#44 | 0.062%(+0.197)#1,574 |
| 44. | Chesterton | 0.25% | 0.047%(+0.206)#45 | 0.062%(+0.192)#1,597 |
| 45. | Kokomo | 0.25% | 0.047%(+0.206)#46 | 0.062%(+0.192)#1,599 |
| 46. | Jeffersonville | 0.24% | 0.047%(+0.196)#47 | 0.062%(+0.182)#1,648 |
| 47. | Shipshewana | 0.23% | 0.047%(+0.182)#48 | 0.062%(+0.168)#1,699 |
| 48. | Van Buren | 0.21% | 0.047%(+0.167)#49 | 0.062%(+0.152)#1,762 |
| 49. | Michigan City | 0.20% | 0.047%(+0.156)#50 | 0.062%(+0.142)#1,808 |
| 50. | Milan | 0.20% | 0.047%(+0.155)#51 | 0.062%(+0.140)#1,815 |
| 51. | Madison | 0.20% | 0.047%(+0.148)#52 | 0.062%(+0.134)#1,856 |
| 52. | Crawfordsville | 0.19% | 0.047%(+0.142)#53 | 0.062%(+0.128)#1,883 |
| 53. | Owensville | 0.18% | 0.047%(+0.129)#54 | 0.062%(+0.115)#1,962 |
| 54. | Connersville | 0.16% | 0.047%(+0.117)#55 | 0.062%(+0.103)#2,020 |
| 55. | Fairmount | 0.15% | 0.047%(+0.108)#56 | 0.062%(+0.093)#2,074 |
| 56. | Campbellsburg | 0.15% | 0.047%(+0.103)#57 | 0.062%(+0.089)#2,109 |
| 57. | Brazil | 0.15% | 0.047%(+0.100)#58 | 0.062%(+0.086)#2,133 |
| 58. | Elwood | 0.14% | 0.047%(+0.097)#59 | 0.062%(+0.082)#2,162 |
| 59. | Richmond | 0.14% | 0.047%(+0.096)#60 | 0.062%(+0.082)#2,169 |
| 60. | Dyer | 0.14% | 0.047%(+0.093)#61 | 0.062%(+0.079)#2,193 |
| 61. | Knightstown | 0.14% | 0.047%(+0.091)#62 | 0.062%(+0.076)#2,210 |
| 62. | Oaktown | 0.13% | 0.047%(+0.085)#63 | 0.062%(+0.071)#2,254 |
| 63. | Franklin | 0.13% | 0.047%(+0.083)#64 | 0.062%(+0.069)#2,269 |
| 64. | La Porte | 0.13% | 0.047%(+0.082)#65 | 0.062%(+0.068)#2,279 |
| 65. | Mooresville | 0.13% | 0.047%(+0.079)#66 | 0.062%(+0.064)#2,305 |
| 66. | Lawrenceburg | 0.12% | 0.047%(+0.069)#67 | 0.062%(+0.055)#2,401 |
| 67. | Avilla | 0.11% | 0.047%(+0.064)#68 | 0.062%(+0.049)#2,466 |
| 68. | Elkhart | 0.10% | 0.047%(+0.055)#69 | 0.062%(+0.041)#2,542 |
| 69. | Putnamville | 0.092% | 0.047%(+0.044)#70 | 0.062%(+0.030)#2,639 |
| 70. | Lynn | 0.089% | 0.047%(+0.042)#71 | 0.062%(+0.028)#2,662 |
| 71. | Munster | 0.088% | 0.047%(+0.041)#72 | 0.062%(+0.027)#2,673 |
| 72. | Columbia City | 0.084% | 0.047%(+0.037)#73 | 0.062%(+0.023)#2,717 |
| 73. | Huntington | 0.082% | 0.047%(+0.035)#74 | 0.062%(+0.021)#2,749 |
| 74. | South Whitley | 0.079% | 0.047%(+0.031)#75 | 0.062%(+0.017)#2,786 |
| 75. | Osceola | 0.077% | 0.047%(+0.030)#76 | 0.062%(+0.016)#2,804 |
| 76. | Gary | 0.072% | 0.047%(+0.025)#77 | 0.062%(+0.011)#2,866 |
| 77. | Evansville | 0.072% | 0.047%(+0.024)#78 | 0.062%(+0.010)#2,877 |
| 78. | Westville | 0.068% | 0.047%(+0.021)#79 | 0.062%(+0.006)#2,915 |
| 79. | Fort Wayne | 0.062% | 0.047%(+0.014)#80 | 0.062%(+0.000)#3,011 |
| 80. | Lake Station | 0.060% | 0.047%(+0.013)#81 | 0.062%(-0.002)#3,032 |
| 81. | Anderson | 0.056% | 0.047%(+0.009)#82 | 0.062%(-0.005)#3,096 |
| 82. | Rensselaer | 0.056% | 0.047%(+0.009)#83 | 0.062%(-0.005)#3,098 |
| 83. | Vincennes | 0.048% | 0.047%(+0.000)#84 | 0.062%(-0.014)#3,212 |
| 84. | Hobart | 0.047% | 0.047%(-0.000)#85 | 0.062%(-0.014)#3,222 |
| 85. | East Chicago | 0.042% | 0.047%(-0.006)#86 | 0.062%(-0.020)#3,325 |
| 86. | Hammond | 0.041% | 0.047%(-0.006)#87 | 0.062%(-0.020)#3,335 |
| 87. | Pendleton | 0.041% | 0.047%(-0.007)#88 | 0.062%(-0.021)#3,354 |
| 88. | Tell City | 0.040% | 0.047%(-0.007)#89 | 0.062%(-0.021)#3,357 |
| 89. | Albion | 0.035% | 0.047%(-0.012)#90 | 0.062%(-0.026)#3,452 |
| 90. | Covington | 0.033% | 0.047%(-0.014)#91 | 0.062%(-0.029)#3,495 |
| 91. | Gas City | 0.033% | 0.047%(-0.015)#92 | 0.062%(-0.029)#3,499 |
| 92. | Ellettsville | 0.030% | 0.047%(-0.017)#93 | 0.062%(-0.032)#3,555 |
| 93. | Indianapolis | 0.030% | 0.047%(-0.017)#94 | 0.062%(-0.032)#3,556 |
| 94. | New Albany | 0.029% | 0.047%(-0.018)#95 | 0.062%(-0.032)#3,570 |
| 95. | Lowell | 0.028% | 0.047%(-0.019)#96 | 0.062%(-0.034)#3,606 |
| 96. | Muncie | 0.028% | 0.047%(-0.020)#97 | 0.062%(-0.034)#3,613 |
| 97. | Lafayette | 0.023% | 0.047%(-0.025)#98 | 0.062%(-0.039)#3,699 |
| 98. | Warsaw | 0.018% | 0.047%(-0.029)#99 | 0.062%(-0.043)#3,779 |
| 99. | Portland | 0.016% | 0.047%(-0.032)#100 | 0.062%(-0.046)#3,830 |
| 100. | Crown Point | 0.015% | 0.047%(-0.033)#101 | 0.062%(-0.047)#3,849 |
Common Questions
What are the Top 10 Cities with the Highest Percentage of Blackfeet Population in Indiana?
Top 10 Cities with the Highest Percentage of Blackfeet Population in Indiana are:
#1
3.71%
#2
1.79%
#3
1.72%
#4
1.56%
#5
1.47%
#6
1.41%
#7
1.26%
#8
0.94%
#9
0.90%
#10
0.88%
What city has the Highest Percentage of Blackfeet Population in Indiana?
Topeka has the Highest Percentage of Blackfeet Population in Indiana with 3.71%.
What is the Percentage of Blackfeet Population in the State of Indiana?
Percentage of Blackfeet Population in Indiana is 0.047%.
What is the Percentage of Blackfeet Population in the United States?
Percentage of Blackfeet Population in the United States is 0.062%.