Cities with the Highest Percentage of Blackfeet Population in Kansas
RELATED REPORTS & OPTIONS
Blackfeet
Kansas
Compare Cities
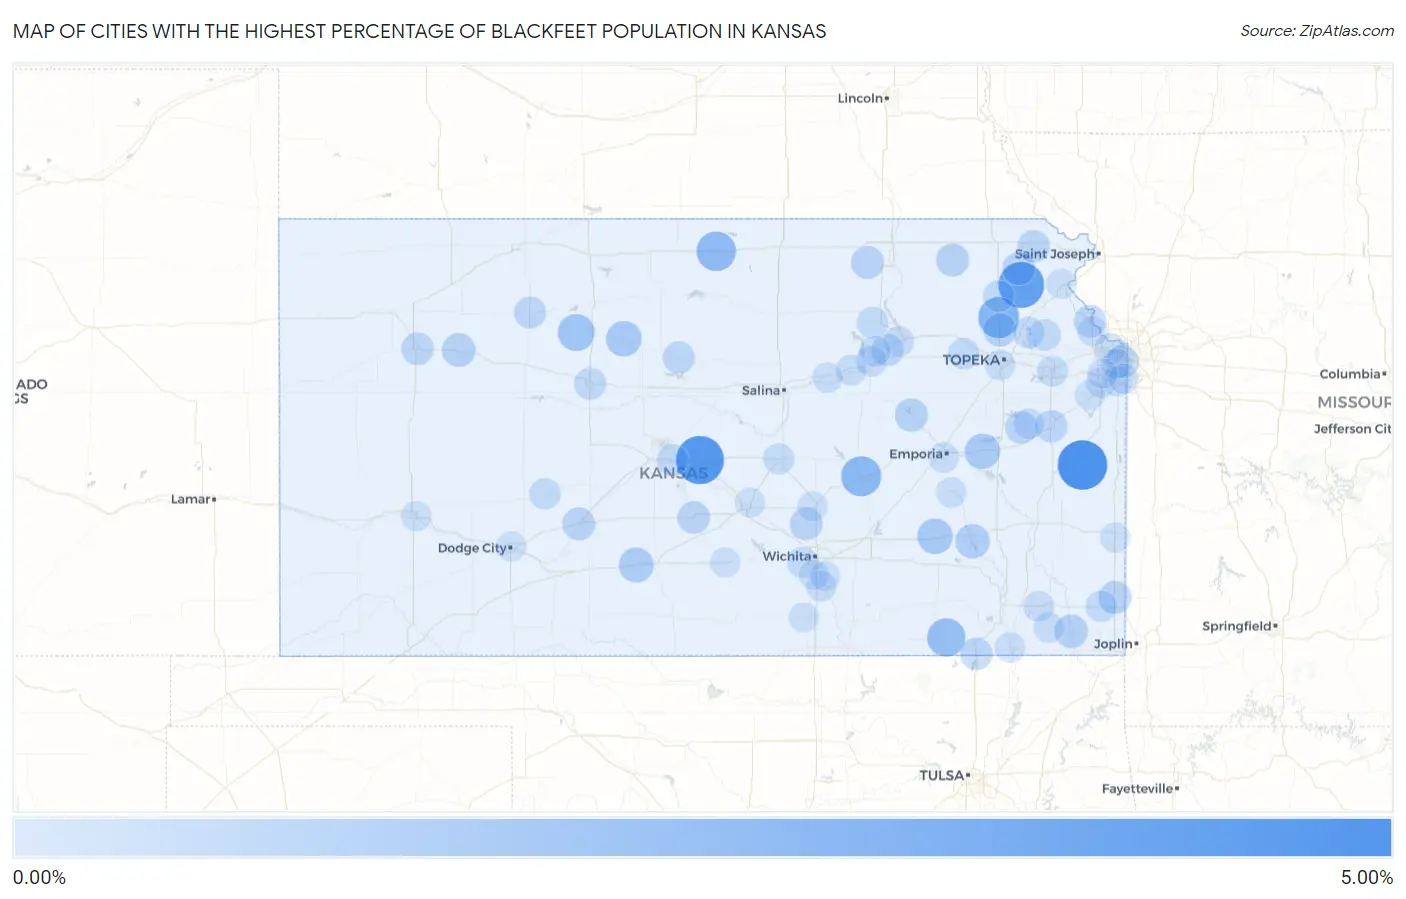
Map of Cities with the Highest Percentage of Blackfeet Population in Kansas
0.00%
5.00%
Cities with the Highest Percentage of Blackfeet Population in Kansas
| City | Blackfeet | vs State | vs National | |
| 1. | Parker | 4.70% | 0.11%(+4.58)#1 | 0.062%(+4.63)#91 |
| 2. | Chase | 4.31% | 0.11%(+4.20)#2 | 0.062%(+4.25)#102 |
| 3. | Muscotah | 3.76% | 0.11%(+3.65)#3 | 0.062%(+3.70)#116 |
| 4. | Mayetta | 2.55% | 0.11%(+2.43)#4 | 0.062%(+2.48)#166 |
| 5. | Florence | 2.36% | 0.11%(+2.24)#5 | 0.062%(+2.30)#182 |
| 6. | Mankato | 2.18% | 0.11%(+2.07)#6 | 0.062%(+2.12)#200 |
| 7. | Sedan | 1.92% | 0.11%(+1.80)#7 | 0.062%(+1.86)#239 |
| 8. | Zurich | 1.59% | 0.11%(+1.47)#8 | 0.062%(+1.53)#302 |
| 9. | Eureka | 1.25% | 0.11%(+1.14)#9 | 0.062%(+1.19)#400 |
| 10. | Natoma | 1.25% | 0.11%(+1.14)#10 | 0.062%(+1.19)#402 |
| 11. | Lebo | 1.20% | 0.11%(+1.09)#11 | 0.062%(+1.14)#420 |
| 12. | Cullison | 1.11% | 0.11%(+0.998)#12 | 0.062%(+1.05)#443 |
| 13. | Toronto | 0.98% | 0.11%(+0.867)#13 | 0.062%(+0.919)#502 |
| 14. | Grainfield | 0.80% | 0.11%(+0.687)#14 | 0.062%(+0.738)#619 |
| 15. | Oswego | 0.78% | 0.11%(+0.669)#15 | 0.062%(+0.720)#632 |
| 16. | Hoyt | 0.75% | 0.11%(+0.638)#16 | 0.062%(+0.689)#659 |
| 17. | Council Grove | 0.73% | 0.11%(+0.621)#17 | 0.062%(+0.673)#676 |
| 18. | Centralia | 0.68% | 0.11%(+0.567)#18 | 0.062%(+0.619)#724 |
| 19. | Barnes | 0.67% | 0.11%(+0.554)#19 | 0.062%(+0.605)#741 |
| 20. | Pittsburg | 0.66% | 0.11%(+0.547)#20 | 0.062%(+0.598)#747 |
| 21. | Kinsley | 0.66% | 0.11%(+0.543)#21 | 0.062%(+0.595)#751 |
| 22. | Horton | 0.65% | 0.11%(+0.532)#22 | 0.062%(+0.584)#760 |
| 23. | Sedgwick | 0.61% | 0.11%(+0.501)#23 | 0.062%(+0.553)#795 |
| 24. | Roeland Park | 0.60% | 0.11%(+0.486)#24 | 0.062%(+0.537)#815 |
| 25. | Sylvia | 0.59% | 0.11%(+0.479)#25 | 0.062%(+0.530)#825 |
| 26. | Oakley | 0.58% | 0.11%(+0.469)#26 | 0.062%(+0.520)#837 |
| 27. | Quenemo | 0.55% | 0.11%(+0.439)#27 | 0.062%(+0.491)#874 |
| 28. | Ottawa | 0.53% | 0.11%(+0.418)#28 | 0.062%(+0.470)#903 |
| 29. | Robinson | 0.53% | 0.11%(+0.416)#29 | 0.062%(+0.468)#905 |
| 30. | Ogden | 0.52% | 0.11%(+0.410)#30 | 0.062%(+0.462)#918 |
| 31. | Leavenworth | 0.52% | 0.11%(+0.406)#31 | 0.062%(+0.457)#922 |
| 32. | Caney | 0.52% | 0.11%(+0.405)#32 | 0.062%(+0.457)#923 |
| 33. | Lucas | 0.45% | 0.11%(+0.333)#33 | 0.062%(+0.385)#1,041 |
| 34. | Hill City | 0.44% | 0.11%(+0.326)#34 | 0.062%(+0.378)#1,057 |
| 35. | Hays | 0.43% | 0.11%(+0.318)#35 | 0.062%(+0.369)#1,074 |
| 36. | Ellinwood | 0.36% | 0.11%(+0.246)#36 | 0.062%(+0.298)#1,227 |
| 37. | Oskaloosa | 0.35% | 0.11%(+0.238)#37 | 0.062%(+0.290)#1,257 |
| 38. | Maple Hill | 0.35% | 0.11%(+0.237)#38 | 0.062%(+0.288)#1,263 |
| 39. | Riley | 0.34% | 0.11%(+0.230)#39 | 0.062%(+0.281)#1,287 |
| 40. | Hanston | 0.31% | 0.11%(+0.198)#40 | 0.062%(+0.250)#1,390 |
| 41. | Ozawkie | 0.30% | 0.11%(+0.187)#41 | 0.062%(+0.239)#1,437 |
| 42. | Holton | 0.30% | 0.11%(+0.182)#42 | 0.062%(+0.234)#1,455 |
| 43. | Cherokee | 0.28% | 0.11%(+0.171)#43 | 0.062%(+0.223)#1,491 |
| 44. | Wichita | 0.23% | 0.11%(+0.118)#44 | 0.062%(+0.170)#1,688 |
| 45. | Mcpherson | 0.21% | 0.11%(+0.095)#45 | 0.062%(+0.146)#1,792 |
| 46. | Lawrence | 0.20% | 0.11%(+0.090)#46 | 0.062%(+0.141)#1,809 |
| 47. | Kansas City | 0.19% | 0.11%(+0.082)#47 | 0.062%(+0.133)#1,858 |
| 48. | Altamont | 0.18% | 0.11%(+0.068)#48 | 0.062%(+0.119)#1,936 |
| 49. | Chapman | 0.18% | 0.11%(+0.062)#49 | 0.062%(+0.114)#1,965 |
| 50. | Pomona | 0.17% | 0.11%(+0.059)#50 | 0.062%(+0.110)#1,984 |
| 51. | Junction City | 0.15% | 0.11%(+0.036)#51 | 0.062%(+0.088)#2,116 |
| 52. | Manhattan | 0.14% | 0.11%(+0.027)#52 | 0.062%(+0.078)#2,196 |
| 53. | Fort Riley | 0.13% | 0.11%(+0.014)#53 | 0.062%(+0.066)#2,295 |
| 54. | Parsons | 0.13% | 0.11%(+0.012)#54 | 0.062%(+0.064)#2,308 |
| 55. | Overland Park | 0.12% | 0.11%(+0.006)#55 | 0.062%(+0.058)#2,367 |
| 56. | Madison | 0.11% | 0.11%(-0.004)#56 | 0.062%(+0.047)#2,483 |
| 57. | Emporia | 0.10% | 0.11%(-0.009)#57 | 0.062%(+0.042)#2,528 |
| 58. | Olathe | 0.094% | 0.11%(-0.019)#58 | 0.062%(+0.033)#2,615 |
| 59. | Topeka | 0.084% | 0.11%(-0.029)#59 | 0.062%(+0.022)#2,723 |
| 60. | Lansing | 0.080% | 0.11%(-0.033)#60 | 0.062%(+0.018)#2,773 |
| 61. | Coffeyville | 0.068% | 0.11%(-0.045)#61 | 0.062%(+0.006)#2,918 |
| 62. | Mulvane | 0.067% | 0.11%(-0.046)#62 | 0.062%(+0.005)#2,938 |
| 63. | Merriam | 0.063% | 0.11%(-0.050)#63 | 0.062%(+0.002)#2,988 |
| 64. | Abilene | 0.046% | 0.11%(-0.067)#64 | 0.062%(-0.015)#3,244 |
| 65. | Gardner | 0.043% | 0.11%(-0.071)#65 | 0.062%(-0.019)#3,310 |
| 66. | Leawood | 0.038% | 0.11%(-0.075)#66 | 0.062%(-0.023)#3,403 |
| 67. | Atchison | 0.037% | 0.11%(-0.076)#67 | 0.062%(-0.025)#3,424 |
| 68. | Kingman | 0.033% | 0.11%(-0.080)#68 | 0.062%(-0.029)#3,501 |
| 69. | Newton | 0.032% | 0.11%(-0.081)#69 | 0.062%(-0.029)#3,509 |
| 70. | Garden City | 0.029% | 0.11%(-0.084)#70 | 0.062%(-0.033)#3,589 |
| 71. | Hutchinson | 0.028% | 0.11%(-0.086)#71 | 0.062%(-0.034)#3,614 |
| 72. | Fort Scott | 0.026% | 0.11%(-0.087)#72 | 0.062%(-0.035)#3,636 |
| 73. | Wellington | 0.026% | 0.11%(-0.087)#73 | 0.062%(-0.036)#3,642 |
| 74. | Haysville | 0.018% | 0.11%(-0.095)#74 | 0.062%(-0.043)#3,775 |
| 75. | Dodge City | 0.018% | 0.11%(-0.095)#75 | 0.062%(-0.044)#3,785 |
| 76. | Lenexa | 0.010% | 0.11%(-0.103)#76 | 0.062%(-0.051)#3,932 |
| 77. | Derby | 0.0039% | 0.11%(-0.109)#77 | 0.062%(-0.058)#4,023 |
Common Questions
What are the Top 10 Cities with the Highest Percentage of Blackfeet Population in Kansas?
Top 10 Cities with the Highest Percentage of Blackfeet Population in Kansas are:
What city has the Highest Percentage of Blackfeet Population in Kansas?
Parker has the Highest Percentage of Blackfeet Population in Kansas with 4.70%.
What is the Percentage of Blackfeet Population in the State of Kansas?
Percentage of Blackfeet Population in Kansas is 0.11%.
What is the Percentage of Blackfeet Population in the United States?
Percentage of Blackfeet Population in the United States is 0.062%.