Cities with the Highest Percentage of Blackfeet Population in Texas
RELATED REPORTS & OPTIONS
Blackfeet
Texas
Compare Cities
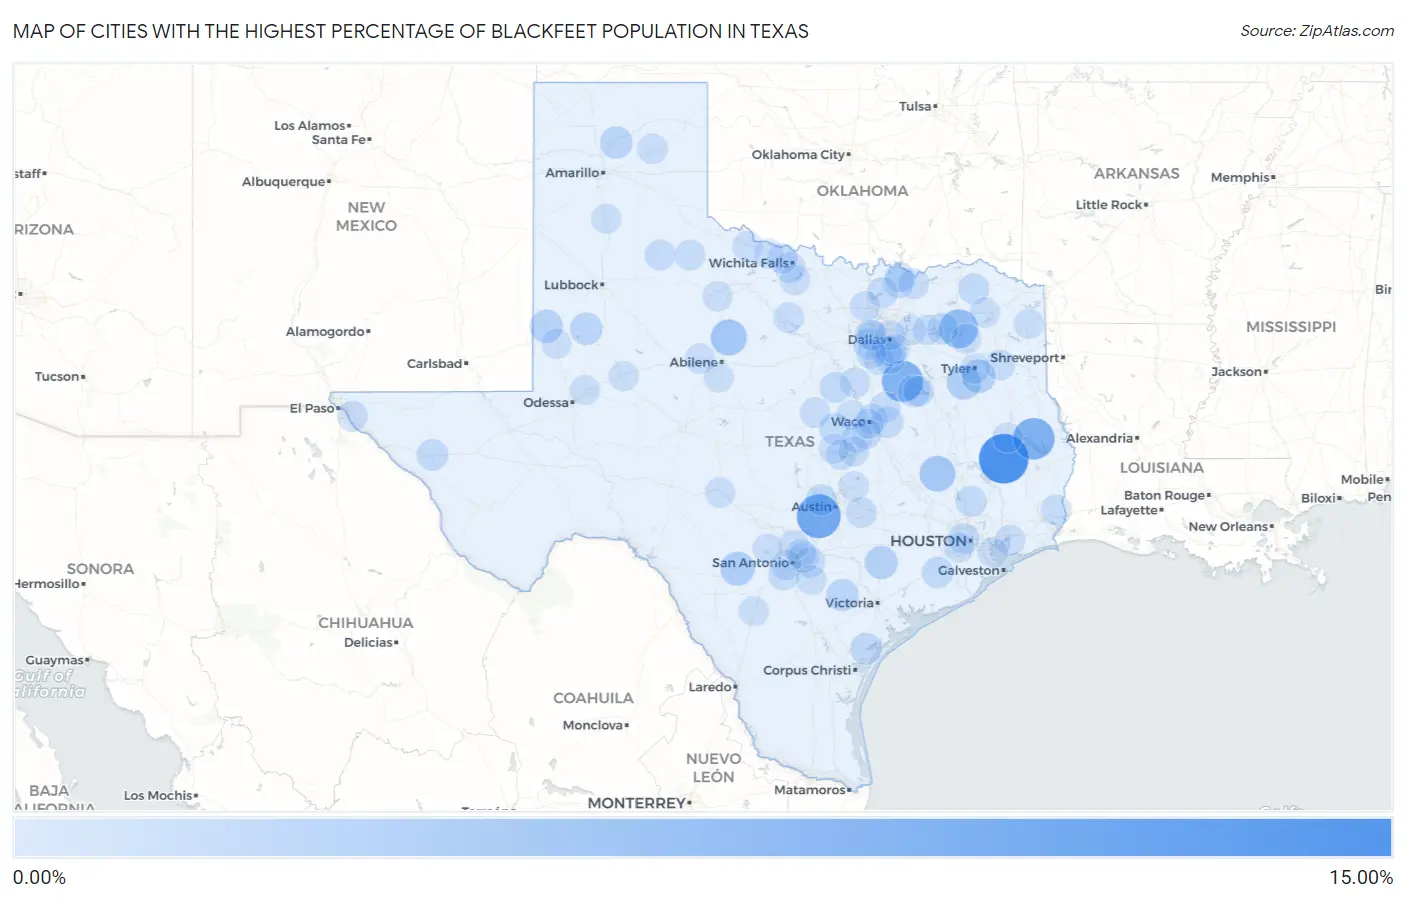
Map of Cities with the Highest Percentage of Blackfeet Population in Texas
0.00%
15.00%
Cities with the Highest Percentage of Blackfeet Population in Texas
| City | Blackfeet | vs State | vs National | |
| 1. | Pleasant Hill | 11.08% | 0.040%(+11.0)#1 | 0.062%(+11.0)#37 |
| 2. | Driftwood | 7.76% | 0.040%(+7.72)#2 | 0.062%(+7.70)#53 |
| 3. | Broaddus | 6.50% | 0.040%(+6.46)#3 | 0.062%(+6.44)#65 |
| 4. | Emhouse | 6.25% | 0.040%(+6.21)#4 | 0.062%(+6.19)#68 |
| 5. | Yantis | 4.88% | 0.040%(+4.84)#5 | 0.062%(+4.82)#87 |
| 6. | Lueders | 3.36% | 0.040%(+3.32)#6 | 0.062%(+3.30)#132 |
| 7. | Bedias | 3.21% | 0.040%(+3.17)#7 | 0.062%(+3.15)#138 |
| 8. | Carter | 3.00% | 0.040%(+2.96)#8 | 0.062%(+2.93)#147 |
| 9. | Coffee City | 2.37% | 0.040%(+2.33)#9 | 0.062%(+2.31)#179 |
| 10. | Sabinal | 2.36% | 0.040%(+2.32)#10 | 0.062%(+2.30)#181 |
| 11. | Whitehouse | 2.02% | 0.040%(+1.98)#11 | 0.062%(+1.96)#223 |
| 12. | Denver City | 1.79% | 0.040%(+1.75)#12 | 0.062%(+1.73)#260 |
| 13. | Hallettsville | 1.76% | 0.040%(+1.72)#13 | 0.062%(+1.70)#265 |
| 14. | Fritch | 1.46% | 0.040%(+1.42)#14 | 0.062%(+1.39)#339 |
| 15. | Welch | 1.36% | 0.040%(+1.32)#15 | 0.062%(+1.30)#366 |
| 16. | Nordheim | 1.36% | 0.040%(+1.32)#16 | 0.062%(+1.30)#369 |
| 17. | Navarro | 1.14% | 0.040%(+1.10)#17 | 0.062%(+1.07)#434 |
| 18. | Bayside | 1.06% | 0.040%(+1.02)#18 | 0.062%(+0.994)#467 |
| 19. | Oak Ridge Town Cooke County | 0.97% | 0.040%(+0.931)#19 | 0.062%(+0.909)#505 |
| 20. | Van Horn | 0.92% | 0.040%(+0.876)#20 | 0.062%(+0.854)#537 |
| 21. | Mart | 0.87% | 0.040%(+0.832)#21 | 0.062%(+0.810)#573 |
| 22. | Boling | 0.86% | 0.040%(+0.822)#22 | 0.062%(+0.800)#580 |
| 23. | Gatesville | 0.83% | 0.040%(+0.793)#23 | 0.062%(+0.771)#596 |
| 24. | Point Venture | 0.79% | 0.040%(+0.749)#24 | 0.062%(+0.727)#626 |
| 25. | Point | 0.79% | 0.040%(+0.747)#25 | 0.062%(+0.725)#629 |
| 26. | Pantego | 0.67% | 0.040%(+0.633)#26 | 0.062%(+0.611)#734 |
| 27. | Sherman | 0.67% | 0.040%(+0.625)#27 | 0.062%(+0.604)#743 |
| 28. | Deport | 0.65% | 0.040%(+0.607)#28 | 0.062%(+0.585)#759 |
| 29. | Hilshire Village | 0.64% | 0.040%(+0.597)#29 | 0.062%(+0.575)#773 |
| 30. | Walnut Springs | 0.63% | 0.040%(+0.591)#30 | 0.062%(+0.569)#779 |
| 31. | Santa Rita Ranch | 0.60% | 0.040%(+0.562)#31 | 0.062%(+0.540)#809 |
| 32. | Cut And Shoot | 0.60% | 0.040%(+0.559)#32 | 0.062%(+0.537)#817 |
| 33. | Bedford | 0.57% | 0.040%(+0.533)#33 | 0.062%(+0.511)#848 |
| 34. | Somerset | 0.56% | 0.040%(+0.518)#34 | 0.062%(+0.496)#866 |
| 35. | Camp Swift | 0.55% | 0.040%(+0.510)#35 | 0.062%(+0.489)#877 |
| 36. | Matador | 0.54% | 0.040%(+0.496)#36 | 0.062%(+0.474)#891 |
| 37. | Mauriceville | 0.51% | 0.040%(+0.474)#37 | 0.062%(+0.452)#928 |
| 38. | Mount Calm | 0.51% | 0.040%(+0.467)#38 | 0.062%(+0.445)#941 |
| 39. | St Hedwig | 0.49% | 0.040%(+0.448)#39 | 0.062%(+0.426)#981 |
| 40. | Tioga | 0.46% | 0.040%(+0.422)#40 | 0.062%(+0.400)#1,020 |
| 41. | Lakeside City | 0.46% | 0.040%(+0.419)#41 | 0.062%(+0.397)#1,022 |
| 42. | Socorro | 0.44% | 0.040%(+0.401)#42 | 0.062%(+0.379)#1,054 |
| 43. | Lakeside Town Tarrant County | 0.42% | 0.040%(+0.382)#43 | 0.062%(+0.360)#1,095 |
| 44. | Eureka | 0.42% | 0.040%(+0.380)#44 | 0.062%(+0.359)#1,100 |
| 45. | Paducah | 0.42% | 0.040%(+0.377)#45 | 0.062%(+0.355)#1,108 |
| 46. | Trent | 0.40% | 0.040%(+0.362)#46 | 0.062%(+0.340)#1,133 |
| 47. | Bellmead | 0.40% | 0.040%(+0.361)#47 | 0.062%(+0.339)#1,135 |
| 48. | Pampa | 0.39% | 0.040%(+0.346)#48 | 0.062%(+0.324)#1,166 |
| 49. | Hamilton | 0.38% | 0.040%(+0.340)#49 | 0.062%(+0.318)#1,184 |
| 50. | Graham | 0.38% | 0.040%(+0.338)#50 | 0.062%(+0.317)#1,188 |
| 51. | Moody | 0.36% | 0.040%(+0.319)#51 | 0.062%(+0.297)#1,229 |
| 52. | Scotland | 0.36% | 0.040%(+0.316)#52 | 0.062%(+0.294)#1,244 |
| 53. | Vernon | 0.35% | 0.040%(+0.310)#53 | 0.062%(+0.288)#1,264 |
| 54. | Krum | 0.34% | 0.040%(+0.298)#54 | 0.062%(+0.276)#1,304 |
| 55. | Forest Heights | 0.34% | 0.040%(+0.298)#55 | 0.062%(+0.276)#1,307 |
| 56. | Kilgore | 0.34% | 0.040%(+0.296)#56 | 0.062%(+0.274)#1,314 |
| 57. | Anahuac | 0.33% | 0.040%(+0.291)#57 | 0.062%(+0.269)#1,326 |
| 58. | Savoy | 0.31% | 0.040%(+0.272)#58 | 0.062%(+0.251)#1,385 |
| 59. | Iowa Park | 0.31% | 0.040%(+0.267)#59 | 0.062%(+0.245)#1,414 |
| 60. | Seabrook | 0.30% | 0.040%(+0.263)#60 | 0.062%(+0.241)#1,434 |
| 61. | Desoto | 0.30% | 0.040%(+0.256)#61 | 0.062%(+0.234)#1,456 |
| 62. | Pecan Hill | 0.29% | 0.040%(+0.253)#62 | 0.062%(+0.231)#1,467 |
| 63. | Converse | 0.27% | 0.040%(+0.231)#63 | 0.062%(+0.209)#1,529 |
| 64. | Lancaster | 0.27% | 0.040%(+0.229)#64 | 0.062%(+0.207)#1,536 |
| 65. | Blum | 0.25% | 0.040%(+0.209)#65 | 0.062%(+0.187)#1,626 |
| 66. | Midlothian | 0.24% | 0.040%(+0.203)#66 | 0.062%(+0.181)#1,650 |
| 67. | Lorena | 0.24% | 0.040%(+0.203)#67 | 0.062%(+0.181)#1,651 |
| 68. | Junction | 0.24% | 0.040%(+0.201)#68 | 0.062%(+0.179)#1,656 |
| 69. | Lackland Afb | 0.24% | 0.040%(+0.201)#69 | 0.062%(+0.179)#1,657 |
| 70. | Harker Heights | 0.24% | 0.040%(+0.199)#70 | 0.062%(+0.178)#1,661 |
| 71. | Linden | 0.23% | 0.040%(+0.195)#71 | 0.062%(+0.173)#1,674 |
| 72. | Temple | 0.23% | 0.040%(+0.190)#72 | 0.062%(+0.168)#1,695 |
| 73. | Knox City | 0.22% | 0.040%(+0.183)#73 | 0.062%(+0.161)#1,726 |
| 74. | Live Oak | 0.22% | 0.040%(+0.177)#74 | 0.062%(+0.155)#1,753 |
| 75. | Big Spring | 0.22% | 0.040%(+0.176)#75 | 0.062%(+0.154)#1,755 |
| 76. | Euless | 0.21% | 0.040%(+0.166)#76 | 0.062%(+0.144)#1,799 |
| 77. | Knollwood | 0.20% | 0.040%(+0.163)#77 | 0.062%(+0.141)#1,813 |
| 78. | Rockwall | 0.20% | 0.040%(+0.157)#78 | 0.062%(+0.135)#1,845 |
| 79. | Meadows Place | 0.19% | 0.040%(+0.151)#79 | 0.062%(+0.129)#1,881 |
| 80. | Winfield | 0.19% | 0.040%(+0.150)#80 | 0.062%(+0.128)#1,885 |
| 81. | Floresville | 0.19% | 0.040%(+0.148)#81 | 0.062%(+0.127)#1,889 |
| 82. | Seminole | 0.19% | 0.040%(+0.145)#82 | 0.062%(+0.124)#1,911 |
| 83. | Timberwood Park | 0.18% | 0.040%(+0.144)#83 | 0.062%(+0.122)#1,916 |
| 84. | Quitman | 0.17% | 0.040%(+0.134)#84 | 0.062%(+0.112)#1,975 |
| 85. | Valley Mills | 0.16% | 0.040%(+0.119)#85 | 0.062%(+0.097)#2,041 |
| 86. | Tyler | 0.16% | 0.040%(+0.119)#86 | 0.062%(+0.097)#2,042 |
| 87. | Tulia | 0.16% | 0.040%(+0.118)#87 | 0.062%(+0.096)#2,046 |
| 88. | Beverly Hills | 0.16% | 0.040%(+0.118)#88 | 0.062%(+0.096)#2,050 |
| 89. | Midland | 0.16% | 0.040%(+0.116)#89 | 0.062%(+0.094)#2,066 |
| 90. | Lakehills | 0.15% | 0.040%(+0.111)#90 | 0.062%(+0.090)#2,102 |
| 91. | Dilley | 0.15% | 0.040%(+0.110)#91 | 0.062%(+0.088)#2,115 |
| 92. | Fort Hood | 0.15% | 0.040%(+0.109)#92 | 0.062%(+0.088)#2,120 |
| 93. | University Park | 0.15% | 0.040%(+0.107)#93 | 0.062%(+0.085)#2,142 |
| 94. | Lufkin | 0.15% | 0.040%(+0.107)#94 | 0.062%(+0.085)#2,147 |
| 95. | Tuscola | 0.14% | 0.040%(+0.104)#95 | 0.062%(+0.082)#2,166 |
| 96. | Hutchins | 0.14% | 0.040%(+0.102)#96 | 0.062%(+0.080)#2,176 |
| 97. | Electra | 0.14% | 0.040%(+0.101)#97 | 0.062%(+0.079)#2,189 |
| 98. | Taylor | 0.14% | 0.040%(+0.100)#98 | 0.062%(+0.078)#2,199 |
| 99. | Quinlan | 0.14% | 0.040%(+0.096)#99 | 0.062%(+0.074)#2,221 |
| 100. | Mansfield | 0.13% | 0.040%(+0.095)#100 | 0.062%(+0.073)#2,240 |
Common Questions
What are the Top 10 Cities with the Highest Percentage of Blackfeet Population in Texas?
Top 10 Cities with the Highest Percentage of Blackfeet Population in Texas are:
#1
11.08%
#2
7.76%
#3
6.50%
#4
6.25%
#5
4.88%
#6
3.36%
#7
3.21%
#8
2.37%
#9
2.36%
#10
2.02%
What city has the Highest Percentage of Blackfeet Population in Texas?
Pleasant Hill has the Highest Percentage of Blackfeet Population in Texas with 11.08%.
What is the Percentage of Blackfeet Population in the State of Texas?
Percentage of Blackfeet Population in Texas is 0.040%.
What is the Percentage of Blackfeet Population in the United States?
Percentage of Blackfeet Population in the United States is 0.062%.