Cities with the Largest Ethiopian Community in Illinois
RELATED REPORTS & OPTIONS
Ethiopian
Illinois
Compare Cities
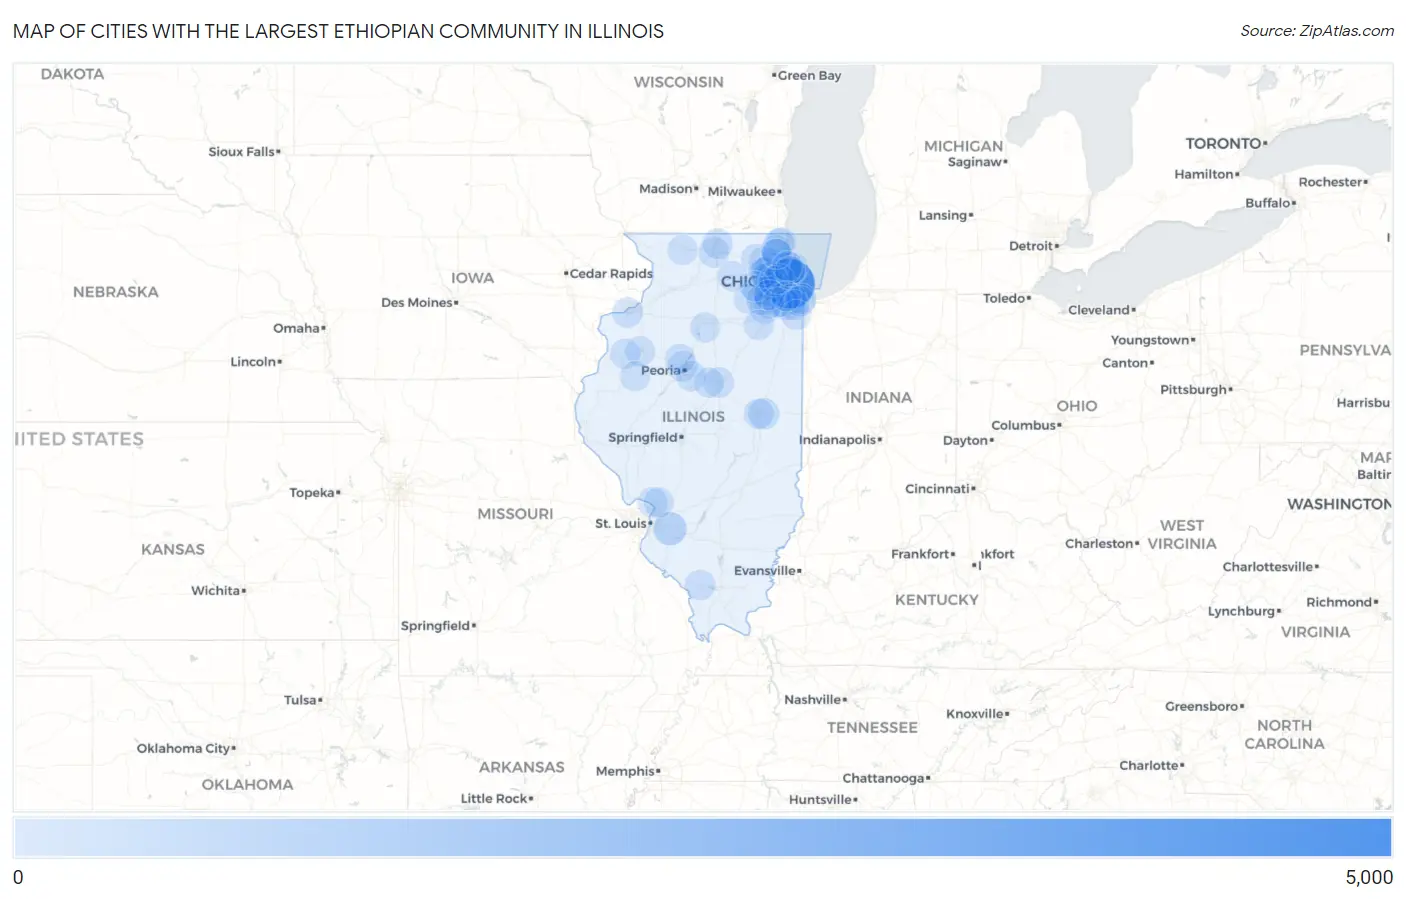
Map of Cities with the Largest Ethiopian Community in Illinois
0
5,000
Cities with the Largest Ethiopian Community in Illinois
| City | Ethiopian | vs State | vs National | |
| 1. | Chicago | 4,225 | 7,374(57.30%)#1 | 355,176(1.19%)#13 |
| 2. | Scott Afb | 610 | 7,374(8.27%)#2 | 355,176(0.17%)#106 |
| 3. | Urbana | 223 | 7,374(3.02%)#3 | 355,176(0.06%)#262 |
| 4. | Wheaton | 193 | 7,374(2.62%)#4 | 355,176(0.05%)#286 |
| 5. | Evanston | 177 | 7,374(2.40%)#5 | 355,176(0.05%)#305 |
| 6. | Skokie | 157 | 7,374(2.13%)#6 | 355,176(0.04%)#335 |
| 7. | Rockford | 87 | 7,374(1.18%)#7 | 355,176(0.02%)#512 |
| 8. | Normal | 81 | 7,374(1.10%)#8 | 355,176(0.02%)#531 |
| 9. | Rock Island | 79 | 7,374(1.07%)#9 | 355,176(0.02%)#541 |
| 10. | Machesney Park | 79 | 7,374(1.07%)#10 | 355,176(0.02%)#542 |
| 11. | Hanover Park | 70 | 7,374(0.95%)#11 | 355,176(0.02%)#593 |
| 12. | Schaumburg | 67 | 7,374(0.91%)#12 | 355,176(0.02%)#603 |
| 13. | Romeoville | 67 | 7,374(0.91%)#13 | 355,176(0.02%)#605 |
| 14. | Orland Park | 56 | 7,374(0.76%)#14 | 355,176(0.02%)#660 |
| 15. | Murphysboro | 55 | 7,374(0.75%)#15 | 355,176(0.02%)#674 |
| 16. | Joliet | 54 | 7,374(0.73%)#16 | 355,176(0.02%)#677 |
| 17. | Downers Grove | 51 | 7,374(0.69%)#17 | 355,176(0.01%)#693 |
| 18. | Rolling Meadows | 51 | 7,374(0.69%)#18 | 355,176(0.01%)#697 |
| 19. | Morton Grove | 47 | 7,374(0.64%)#19 | 355,176(0.01%)#719 |
| 20. | Glendale Heights | 42 | 7,374(0.57%)#20 | 355,176(0.01%)#752 |
| 21. | Algonquin | 37 | 7,374(0.50%)#21 | 355,176(0.01%)#795 |
| 22. | Aurora | 35 | 7,374(0.47%)#22 | 355,176(0.01%)#812 |
| 23. | Carol Stream | 34 | 7,374(0.46%)#23 | 355,176(0.01%)#821 |
| 24. | Naperville | 32 | 7,374(0.43%)#24 | 355,176(0.01%)#846 |
| 25. | Tinley Park | 32 | 7,374(0.43%)#25 | 355,176(0.01%)#849 |
| 26. | Peoria | 31 | 7,374(0.42%)#26 | 355,176(0.01%)#862 |
| 27. | Alton | 27 | 7,374(0.37%)#27 | 355,176(0.01%)#914 |
| 28. | Gurnee | 25 | 7,374(0.34%)#28 | 355,176(0.01%)#931 |
| 29. | Robbins | 24 | 7,374(0.33%)#29 | 355,176(0.01%)#956 |
| 30. | Calumet City | 23 | 7,374(0.31%)#30 | 355,176(0.01%)#968 |
| 31. | Homewood | 22 | 7,374(0.30%)#31 | 355,176(0.01%)#996 |
| 32. | Morton | 22 | 7,374(0.30%)#32 | 355,176(0.01%)#998 |
| 33. | Barrington Hills | 22 | 7,374(0.30%)#33 | 355,176(0.01%)#1,005 |
| 34. | Yorkville | 20 | 7,374(0.27%)#34 | 355,176(0.01%)#1,037 |
| 35. | Monmouth | 20 | 7,374(0.27%)#35 | 355,176(0.01%)#1,043 |
| 36. | Crest Hill | 18 | 7,374(0.24%)#36 | 355,176(0.01%)#1,070 |
| 37. | Danvers | 18 | 7,374(0.24%)#37 | 355,176(0.01%)#1,078 |
| 38. | Plainfield | 15 | 7,374(0.20%)#38 | 355,176(0.00%)#1,124 |
| 39. | Bartlett | 15 | 7,374(0.20%)#39 | 355,176(0.00%)#1,126 |
| 40. | Vernon Hills | 13 | 7,374(0.18%)#40 | 355,176(0.00%)#1,179 |
| 41. | North Aurora | 13 | 7,374(0.18%)#41 | 355,176(0.00%)#1,183 |
| 42. | Lombard | 12 | 7,374(0.16%)#42 | 355,176(0.00%)#1,209 |
| 43. | Libertyville | 12 | 7,374(0.16%)#43 | 355,176(0.00%)#1,214 |
| 44. | Burnham | 12 | 7,374(0.16%)#44 | 355,176(0.00%)#1,223 |
| 45. | Dekalb | 11 | 7,374(0.15%)#45 | 355,176(0.00%)#1,240 |
| 46. | Galesburg | 11 | 7,374(0.15%)#46 | 355,176(0.00%)#1,242 |
| 47. | Coal City | 11 | 7,374(0.15%)#47 | 355,176(0.00%)#1,257 |
| 48. | Waukegan | 10 | 7,374(0.14%)#48 | 355,176(0.00%)#1,269 |
| 49. | Bethalto | 10 | 7,374(0.14%)#49 | 355,176(0.00%)#1,281 |
| 50. | Champaign | 9 | 7,374(0.12%)#50 | 355,176(0.00%)#1,294 |
| 51. | Crete | 9 | 7,374(0.12%)#51 | 355,176(0.00%)#1,319 |
| 52. | Granville | 9 | 7,374(0.12%)#52 | 355,176(0.00%)#1,329 |
| 53. | Freeport | 8 | 7,374(0.11%)#53 | 355,176(0.00%)#1,350 |
| 54. | Indian Creek | 8 | 7,374(0.11%)#54 | 355,176(0.00%)#1,368 |
| 55. | Bolingbrook | 7 | 7,374(0.09%)#55 | 355,176(0.00%)#1,373 |
| 56. | Elmhurst | 6 | 7,374(0.08%)#56 | 355,176(0.00%)#1,411 |
| 57. | Golf | 6 | 7,374(0.08%)#57 | 355,176(0.00%)#1,441 |
| 58. | Homer Glen | 3 | 7,374(0.04%)#58 | 355,176(0.00%)#1,519 |
| 59. | Lincolnwood | 2 | 7,374(0.03%)#59 | 355,176(0.00%)#1,556 |
| 60. | Palos Heights | 2 | 7,374(0.03%)#60 | 355,176(0.00%)#1,557 |
| 61. | Dunlap | 2 | 7,374(0.03%)#61 | 355,176(0.00%)#1,569 |
| 62. | Prairie City | 2 | 7,374(0.03%)#62 | 355,176(0.00%)#1,577 |
Common Questions
What are the Top 10 Cities with the Largest Ethiopian Community in Illinois?
Top 10 Cities with the Largest Ethiopian Community in Illinois are:
#1
4,225
#2
610
#3
223
#4
193
#5
177
#6
157
#7
87
#8
81
#9
79
#10
79
What city has the Largest Ethiopian Community in Illinois?
Chicago has the Largest Ethiopian Community in Illinois with 4,225.
What is the Total Ethiopian Population in the State of Illinois?
Total Ethiopian Population in Illinois is 7,374.
What is the Total Ethiopian Population in the United States?
Total Ethiopian Population in the United States is 355,176.