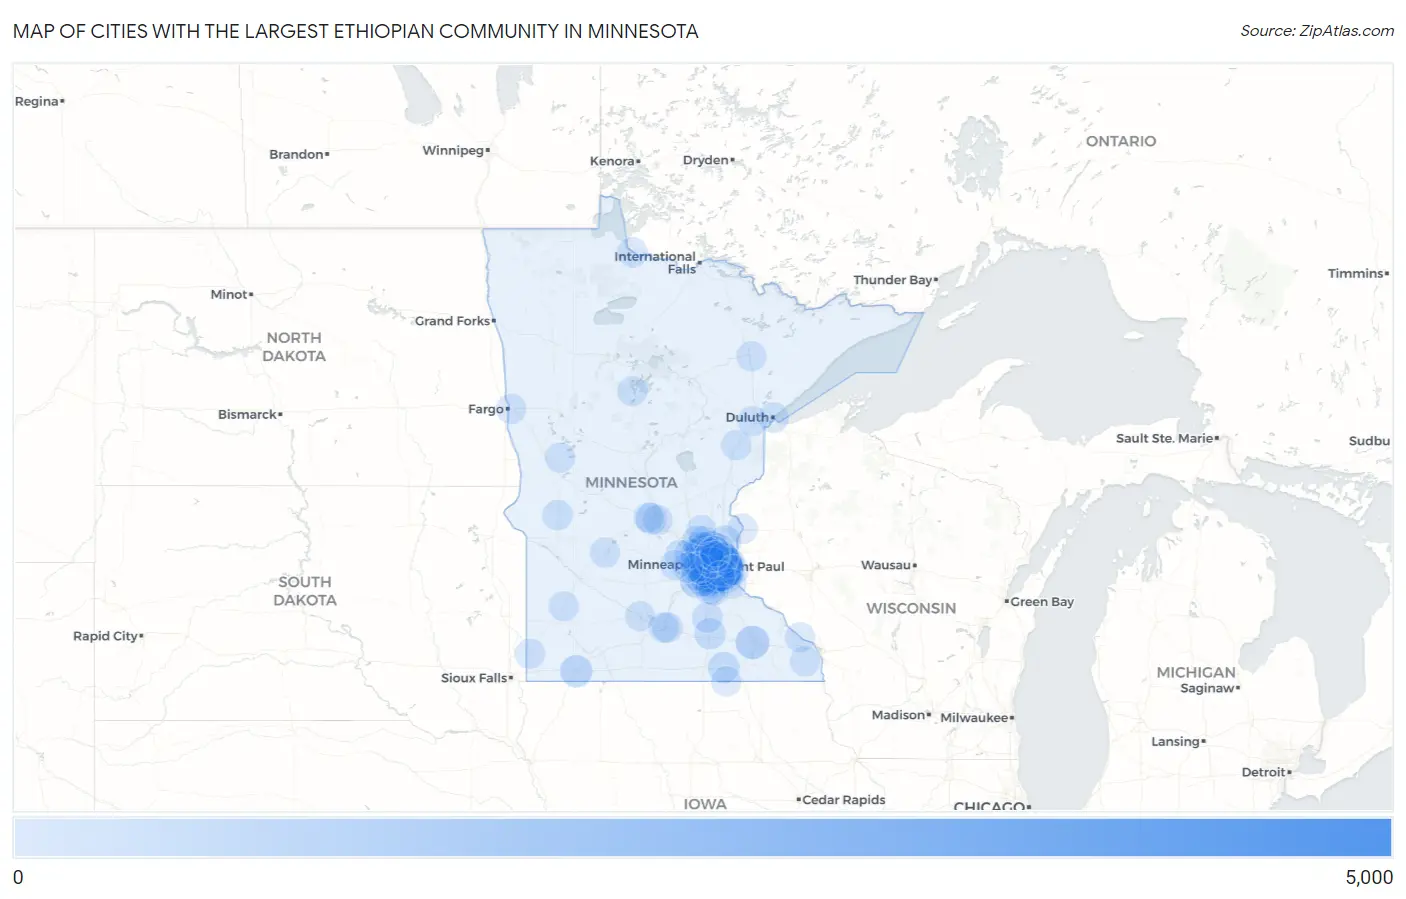
Cities with the Largest Ethiopian Community in Minnesota
RELATED REPORTS & OPTIONS
Ethiopian
Minnesota
Compare Cities
Map of Cities with the Largest Ethiopian Community in Minnesota
0
5,000
Cities with the Largest Ethiopian Community in Minnesota
| City | Ethiopian | vs State | vs National | |
| 1. | St Paul | 4,626 | 26,858(17.22%)#1 | 355,176(1.30%)#11 |
| 2. | Minneapolis | 3,928 | 26,858(14.63%)#2 | 355,176(1.11%)#15 |
| 3. | Brooklyn Park | 1,518 | 26,858(5.65%)#3 | 355,176(0.43%)#39 |
| 4. | Eagan | 1,263 | 26,858(4.70%)#4 | 355,176(0.36%)#47 |
| 5. | Blaine | 1,122 | 26,858(4.18%)#5 | 355,176(0.32%)#54 |
| 6. | Oakdale | 891 | 26,858(3.32%)#6 | 355,176(0.25%)#68 |
| 7. | Woodbury | 806 | 26,858(3.00%)#7 | 355,176(0.23%)#79 |
| 8. | Rochester | 734 | 26,858(2.73%)#8 | 355,176(0.21%)#89 |
| 9. | Fridley | 623 | 26,858(2.32%)#9 | 355,176(0.18%)#101 |
| 10. | Shakopee | 574 | 26,858(2.14%)#10 | 355,176(0.16%)#114 |
| 11. | Burnsville | 521 | 26,858(1.94%)#11 | 355,176(0.15%)#126 |
| 12. | Roseville | 521 | 26,858(1.94%)#12 | 355,176(0.15%)#127 |
| 13. | Bloomington | 488 | 26,858(1.82%)#13 | 355,176(0.14%)#135 |
| 14. | Brooklyn Center | 464 | 26,858(1.73%)#14 | 355,176(0.13%)#140 |
| 15. | Worthington | 457 | 26,858(1.70%)#15 | 355,176(0.13%)#144 |
| 16. | Apple Valley | 421 | 26,858(1.57%)#16 | 355,176(0.12%)#150 |
| 17. | Maplewood | 419 | 26,858(1.56%)#17 | 355,176(0.12%)#152 |
| 18. | Columbia Heights | 410 | 26,858(1.53%)#18 | 355,176(0.12%)#156 |
| 19. | Plymouth | 381 | 26,858(1.42%)#19 | 355,176(0.11%)#166 |
| 20. | Coon Rapids | 352 | 26,858(1.31%)#20 | 355,176(0.10%)#178 |
| 21. | Cottage Grove | 348 | 26,858(1.30%)#21 | 355,176(0.10%)#179 |
| 22. | New Hope | 343 | 26,858(1.28%)#22 | 355,176(0.10%)#184 |
| 23. | New Brighton | 331 | 26,858(1.23%)#23 | 355,176(0.09%)#189 |
| 24. | Forest Lake | 305 | 26,858(1.14%)#24 | 355,176(0.09%)#205 |
| 25. | Austin | 286 | 26,858(1.06%)#25 | 355,176(0.08%)#210 |
| 26. | Eden Prairie | 258 | 26,858(0.96%)#26 | 355,176(0.07%)#222 |
| 27. | Robbinsdale | 249 | 26,858(0.93%)#27 | 355,176(0.07%)#231 |
| 28. | Lakeville | 247 | 26,858(0.92%)#28 | 355,176(0.07%)#236 |
| 29. | Champlin | 232 | 26,858(0.86%)#29 | 355,176(0.07%)#251 |
| 30. | Ramsey | 230 | 26,858(0.86%)#30 | 355,176(0.06%)#253 |
| 31. | Richfield | 219 | 26,858(0.82%)#31 | 355,176(0.06%)#265 |
| 32. | Waite Park | 199 | 26,858(0.74%)#32 | 355,176(0.06%)#277 |
| 33. | Owatonna | 194 | 26,858(0.72%)#33 | 355,176(0.05%)#285 |
| 34. | White Bear Lake | 171 | 26,858(0.64%)#34 | 355,176(0.05%)#314 |
| 35. | North St Paul | 170 | 26,858(0.63%)#35 | 355,176(0.05%)#316 |
| 36. | Little Canada | 157 | 26,858(0.58%)#36 | 355,176(0.04%)#338 |
| 37. | West St Paul | 146 | 26,858(0.54%)#37 | 355,176(0.04%)#357 |
| 38. | Lexington | 126 | 26,858(0.47%)#38 | 355,176(0.04%)#401 |
| 39. | Lino Lakes | 123 | 26,858(0.46%)#39 | 355,176(0.03%)#407 |
| 40. | Maple Grove | 117 | 26,858(0.44%)#40 | 355,176(0.03%)#422 |
| 41. | Lake Elmo | 105 | 26,858(0.39%)#41 | 355,176(0.03%)#461 |
| 42. | St Anthony City Hennepin And Ramsey Counties | 105 | 26,858(0.39%)#42 | 355,176(0.03%)#463 |
| 43. | South St Paul | 93 | 26,858(0.35%)#43 | 355,176(0.03%)#489 |
| 44. | Farmington | 92 | 26,858(0.34%)#44 | 355,176(0.03%)#495 |
| 45. | Mankato | 89 | 26,858(0.33%)#45 | 355,176(0.03%)#503 |
| 46. | Faribault | 85 | 26,858(0.32%)#46 | 355,176(0.02%)#518 |
| 47. | Hopkins | 81 | 26,858(0.30%)#47 | 355,176(0.02%)#533 |
| 48. | Golden Valley | 80 | 26,858(0.30%)#48 | 355,176(0.02%)#536 |
| 49. | St Louis Park | 76 | 26,858(0.28%)#49 | 355,176(0.02%)#555 |
| 50. | Crystal | 75 | 26,858(0.28%)#50 | 355,176(0.02%)#564 |
| 51. | Falcon Heights | 73 | 26,858(0.27%)#51 | 355,176(0.02%)#578 |
| 52. | Arden Hills | 68 | 26,858(0.25%)#52 | 355,176(0.02%)#601 |
| 53. | Savage | 62 | 26,858(0.23%)#53 | 355,176(0.02%)#624 |
| 54. | Morris | 57 | 26,858(0.21%)#54 | 355,176(0.02%)#658 |
| 55. | Corcoran | 47 | 26,858(0.17%)#55 | 355,176(0.01%)#720 |
| 56. | Moose Lake | 42 | 26,858(0.16%)#56 | 355,176(0.01%)#756 |
| 57. | Duluth | 38 | 26,858(0.14%)#57 | 355,176(0.01%)#780 |
| 58. | Andover | 36 | 26,858(0.13%)#58 | 355,176(0.01%)#805 |
| 59. | Spring Lake Park | 35 | 26,858(0.13%)#59 | 355,176(0.01%)#819 |
| 60. | Moorhead | 33 | 26,858(0.12%)#60 | 355,176(0.01%)#836 |
| 61. | Lauderdale | 32 | 26,858(0.12%)#61 | 355,176(0.01%)#859 |
| 62. | St Cloud | 31 | 26,858(0.12%)#62 | 355,176(0.01%)#864 |
| 63. | Edina | 28 | 26,858(0.10%)#63 | 355,176(0.01%)#899 |
| 64. | North Mankato | 28 | 26,858(0.10%)#64 | 355,176(0.01%)#901 |
| 65. | Hilltop | 25 | 26,858(0.09%)#65 | 355,176(0.01%)#938 |
| 66. | Mounds View | 24 | 26,858(0.09%)#66 | 355,176(0.01%)#953 |
| 67. | Rockford | 24 | 26,858(0.09%)#67 | 355,176(0.01%)#957 |
| 68. | Birchwood Village | 22 | 26,858(0.08%)#68 | 355,176(0.01%)#1,007 |
| 69. | Virginia | 20 | 26,858(0.07%)#69 | 355,176(0.01%)#1,044 |
| 70. | Minnetonka | 17 | 26,858(0.06%)#70 | 355,176(0.00%)#1,084 |
| 71. | Willmar | 13 | 26,858(0.05%)#71 | 355,176(0.00%)#1,182 |
| 72. | Shoreview | 12 | 26,858(0.04%)#72 | 355,176(0.00%)#1,212 |
| 73. | Taylors Falls | 11 | 26,858(0.04%)#73 | 355,176(0.00%)#1,261 |
| 74. | Houston | 11 | 26,858(0.04%)#74 | 355,176(0.00%)#1,262 |
| 75. | Jasper | 11 | 26,858(0.04%)#75 | 355,176(0.00%)#1,264 |
| 76. | St Joseph | 9 | 26,858(0.03%)#76 | 355,176(0.00%)#1,321 |
| 77. | Circle Pines | 9 | 26,858(0.03%)#77 | 355,176(0.00%)#1,325 |
| 78. | Spring Park | 8 | 26,858(0.03%)#78 | 355,176(0.00%)#1,366 |
| 79. | New Ulm | 6 | 26,858(0.02%)#79 | 355,176(0.00%)#1,423 |
| 80. | Hastings | 5 | 26,858(0.02%)#80 | 355,176(0.00%)#1,455 |
| 81. | Cloquet | 4 | 26,858(0.01%)#81 | 355,176(0.00%)#1,488 |
| 82. | Marshall | 3 | 26,858(0.01%)#82 | 355,176(0.00%)#1,523 |
| 83. | Watertown | 3 | 26,858(0.01%)#83 | 355,176(0.00%)#1,530 |
| 84. | Afton | 3 | 26,858(0.01%)#84 | 355,176(0.00%)#1,531 |
| 85. | Lyle | 3 | 26,858(0.01%)#85 | 355,176(0.00%)#1,541 |
| 86. | Inver Grove Heights | 2 | 26,858(0.01%)#86 | 355,176(0.00%)#1,550 |
| 87. | St Francis | 2 | 26,858(0.01%)#87 | 355,176(0.00%)#1,561 |
| 88. | Winona | 1 | 26,858(0.00%)#88 | 355,176(0.00%)#1,588 |
| 89. | Baudette | 1 | 26,858(0.00%)#89 | 355,176(0.00%)#1,618 |
| 90. | Walker | 1 | 26,858(0.00%)#90 | 355,176(0.00%)#1,620 |
| 91. | Underwood | 1 | 26,858(0.00%)#91 | 355,176(0.00%)#1,623 |
Common Questions
What are the Top 10 Cities with the Largest Ethiopian Community in Minnesota?
Top 10 Cities with the Largest Ethiopian Community in Minnesota are:
#1
4,626
#2
3,928
#3
1,518
#4
1,263
#5
1,122
#6
891
#7
806
#8
734
#9
623
#10
574
What city has the Largest Ethiopian Community in Minnesota?
St Paul has the Largest Ethiopian Community in Minnesota with 4,626.
What is the Total Ethiopian Population in the State of Minnesota?
Total Ethiopian Population in Minnesota is 26,858.
What is the Total Ethiopian Population in the United States?
Total Ethiopian Population in the United States is 355,176.