Cities with the Largest Ethiopian Community in Michigan

RELATED REPORTS & OPTIONS

Ethiopian
Population
Families and Households
Female Fertility
Female Fertility (Unmarried)
Race (Community Size)
Race (Percentage)
Ancestry (Community Size)
AfghanAfricanAlaska NativeAlaskan AthabascanAlbanianAleutAlsatianAmericanApacheArabArapahoArgentineanArmenianAssyrian / Chaldean / SyriacAustralianAustrianBahamianBangladeshiBarbadianBasqueBelgianBelizeanBermudanBhutaneseBlackfeetBolivianBrazilianBritishBritish West IndianBulgarianBurmeseCajunCambodianCanadianCape VerdeanCarpatho RusynCelticCentral AmericanCentral American IndianCherokeeCheyenneChickasawChileanChineseChippewaChoctawColombianColvilleComancheCosta RicanCreeCreekCroatianCrowCubanCypriotCzechCzechoslovakianDanishDelawareDominicanDutchDutch West IndianEastern EuropeanEcuadorianEgyptianEnglishEstonianEthiopianEuropeanFijianFilipinoFinnishFrenchFrench American IndianFrench CanadianGermanGerman RussianGhanaianGreekGuamanian / ChamorroGuatemalanGuyaneseHaitianHmongHonduranHopiHoumaHungarianIcelanderIndian (Asian)IndonesianInupiatIranianIraqiIrishIroquoisIsraeliItalianJamaicanJapaneseJordanianKenyanKiowaKoreanLaotianLatvianLebaneseLiberianLithuanianLumbeeLuxembourgerMacedonianMalaysianMalteseMarshalleseMenomineeMexicanMexican American IndianMongolianMoroccanNative HawaiianNavajoNepaleseNew ZealanderNicaraguanNigerianNorthern EuropeanNorwegianOkinawanOsageOttawaPaiutePakistaniPalestinianPanamanianParaguayanPennsylvania GermanPeruvianPimaPolishPortuguesePotawatomiPuebloPuerto RicanPuget Sound SalishRomanianRussianSalvadoranSamoanScandinavianScotch-IrishScottishSeminoleSenegaleseSerbianShoshoneSierra LeoneanSiouxSlavicSlovakSloveneSomaliSouth AfricanSouth AmericanSouth American IndianSoviet UnionSpaniardSpanishSpanish AmericanSpanish American IndianSri LankanSubsaharan AfricanSudaneseSwedishSwissSyrianTaiwaneseThaiTlingit-HaidaTohono O'OdhamTonganTrinidadian and TobagonianTsimshianTurkishU.S. Virgin IslanderUgandanUkrainianUruguayanUteVenezuelanVietnameseWelshWest IndianYakamaYaquiYugoslavianYumanYup'ikZimbabwean
Ancestry (Percentage)
AfghanAfricanAlaska NativeAlaskan AthabascanAlbanianAleutAlsatianAmericanApacheArabArapahoArgentineanArmenianAssyrian / Chaldean / SyriacAustralianAustrianBahamianBangladeshiBarbadianBasqueBelgianBelizeanBermudanBhutaneseBlackfeetBolivianBrazilianBritishBritish West IndianBulgarianBurmeseCajunCambodianCanadianCape VerdeanCarpatho RusynCelticCentral AmericanCentral American IndianCherokeeCheyenneChickasawChileanChineseChippewaChoctawColombianColvilleComancheCosta RicanCreeCreekCroatianCrowCubanCypriotCzechCzechoslovakianDanishDelawareDominicanDutchDutch West IndianEastern EuropeanEcuadorianEgyptianEnglishEstonianEthiopianEuropeanFijianFilipinoFinnishFrenchFrench American IndianFrench CanadianGermanGerman RussianGhanaianGreekGuamanian / ChamorroGuatemalanGuyaneseHaitianHmongHonduranHopiHoumaHungarianIcelanderIndian (Asian)IndonesianInupiatIranianIraqiIrishIroquoisIsraeliItalianJamaicanJapaneseJordanianKenyanKiowaKoreanLaotianLatvianLebaneseLiberianLithuanianLumbeeLuxembourgerMacedonianMalaysianMalteseMarshalleseMenomineeMexicanMexican American IndianMongolianMoroccanNative HawaiianNavajoNepaleseNew ZealanderNicaraguanNigerianNorthern EuropeanNorwegianOkinawanOsageOttawaPaiutePakistaniPalestinianPanamanianParaguayanPennsylvania GermanPeruvianPimaPolishPortuguesePotawatomiPuebloPuerto RicanPuget Sound SalishRomanianRussianSalvadoranSamoanScandinavianScotch-IrishScottishSeminoleSenegaleseSerbianShoshoneSierra LeoneanSiouxSlavicSlovakSloveneSomaliSouth AfricanSouth AmericanSouth American IndianSoviet UnionSpaniardSpanishSpanish AmericanSpanish American IndianSri LankanSubsaharan AfricanSudaneseSwedishSwissSyrianTaiwaneseThaiTlingit-HaidaTohono O'OdhamTonganTrinidadian and TobagonianTsimshianTurkishU.S. Virgin IslanderUgandanUkrainianUruguayanUteVenezuelanVietnameseWelshWest IndianYakamaYaquiYugoslavianYumanYup'ikZimbabwean
Immigrant Origin (Total)
AfghanistanAfricaAlbaniaArgentinaArmeniaAsiaAustraliaAustriaAzoresBahamasBangladeshBarbadosBelarusBelgiumBelizeBoliviaBosnia and HerzegovinaBrazilBulgariaBurma / MyanmarCabo VerdeCambodiaCameroonCanadaCaribbeanCentral AmericaChileChinaColombiaCongoCosta RicaCroatiaCubaCzechoslovakiaDenmarkDominicaDominican RepublicEastern AfricaEastern AsiaEastern EuropeEcuadorEgyptEl SalvadorEnglandEritreaEthiopiaEuropeFijiFranceGermanyGhanaGreeceGrenadaGuatemalaGuyanaHaitiHondurasHong KongHungaryIndiaIndonesiaIranIraqIrelandIsraelItalyJamaicaJapanJordanKazakhstanKenyaKoreaKuwaitLaosLatin AmericaLatviaLebanonLiberiaLithuaniaMalaysiaMexicoMicronesiaMiddle AfricaMoldovaMoroccoNepalNetherlandsNicaraguaNigeriaNorth MacedoniaNorthern AfricaNorthern EuropeNorwayOceaniaPakistanPanamaPeruPhilippinesPolandPortugalRomaniaRussiaSaudi ArabiaScotlandSenegalSerbiaSierra LeoneSingaporeSomaliaSouth AfricaSouth AmericaSouth Central AsiaSouth Eastern AsiaSouthern EuropeSpainSri LankaSt. Vincent and the GrenadinesSudanSwedenSwitzerlandSyriaTaiwanThailandTrinidad and TobagoTurkeyUgandaUkraineUruguayUzbekistanVenezuelaVietnamWest IndiesWestern AfricaWestern AsiaWestern EuropeYemenZaireZimbabwe
Immigrant Origin (Percentage)
AfghanistanAfricaAlbaniaArgentinaArmeniaAsiaAustraliaAustriaAzoresBahamasBangladeshBarbadosBelarusBelgiumBelizeBoliviaBosnia and HerzegovinaBrazilBulgariaBurma / MyanmarCabo VerdeCambodiaCameroonCanadaCaribbeanCentral AmericaChileChinaColombiaCongoCosta RicaCroatiaCubaCzechoslovakiaDenmarkDominicaDominican RepublicEastern AfricaEastern AsiaEastern EuropeEcuadorEgyptEl SalvadorEnglandEritreaEthiopiaEuropeFijiFranceGermanyGhanaGreeceGrenadaGuatemalaGuyanaHaitiHondurasHong KongHungaryIndiaIndonesiaIranIraqIrelandIsraelItalyJamaicaJapanJordanKazakhstanKenyaKoreaKuwaitLaosLatin AmericaLatviaLebanonLiberiaLithuaniaMalaysiaMexicoMicronesiaMiddle AfricaMoldovaMoroccoNepalNetherlandsNicaraguaNigeriaNorth MacedoniaNorthern AfricaNorthern EuropeNorwayOceaniaPakistanPanamaPeruPhilippinesPolandPortugalRomaniaRussiaSaudi ArabiaScotlandSenegalSerbiaSierra LeoneSingaporeSomaliaSouth AfricaSouth AmericaSouth Central AsiaSouth Eastern AsiaSouthern EuropeSpainSri LankaSt. Vincent and the GrenadinesSudanSwedenSwitzerlandSyriaTaiwanThailandTrinidad and TobagoTurkeyUgandaUkraineUruguayUzbekistanVenezuelaVietnamWest IndiesWestern AfricaWestern AsiaWestern EuropeYemenZaireZimbabwe
Income
Income (Families)
Income (Households)
Poverty
Poverty (Families)
Unemployment
Employment Occupations
Employment Industries
Employer Class
Commute Time
Commute Means
School Enrollment
Education by Degree Field
Occupancy
Finances
Physical Characteristics
Michigan
Compare Cities
Comparison Subject

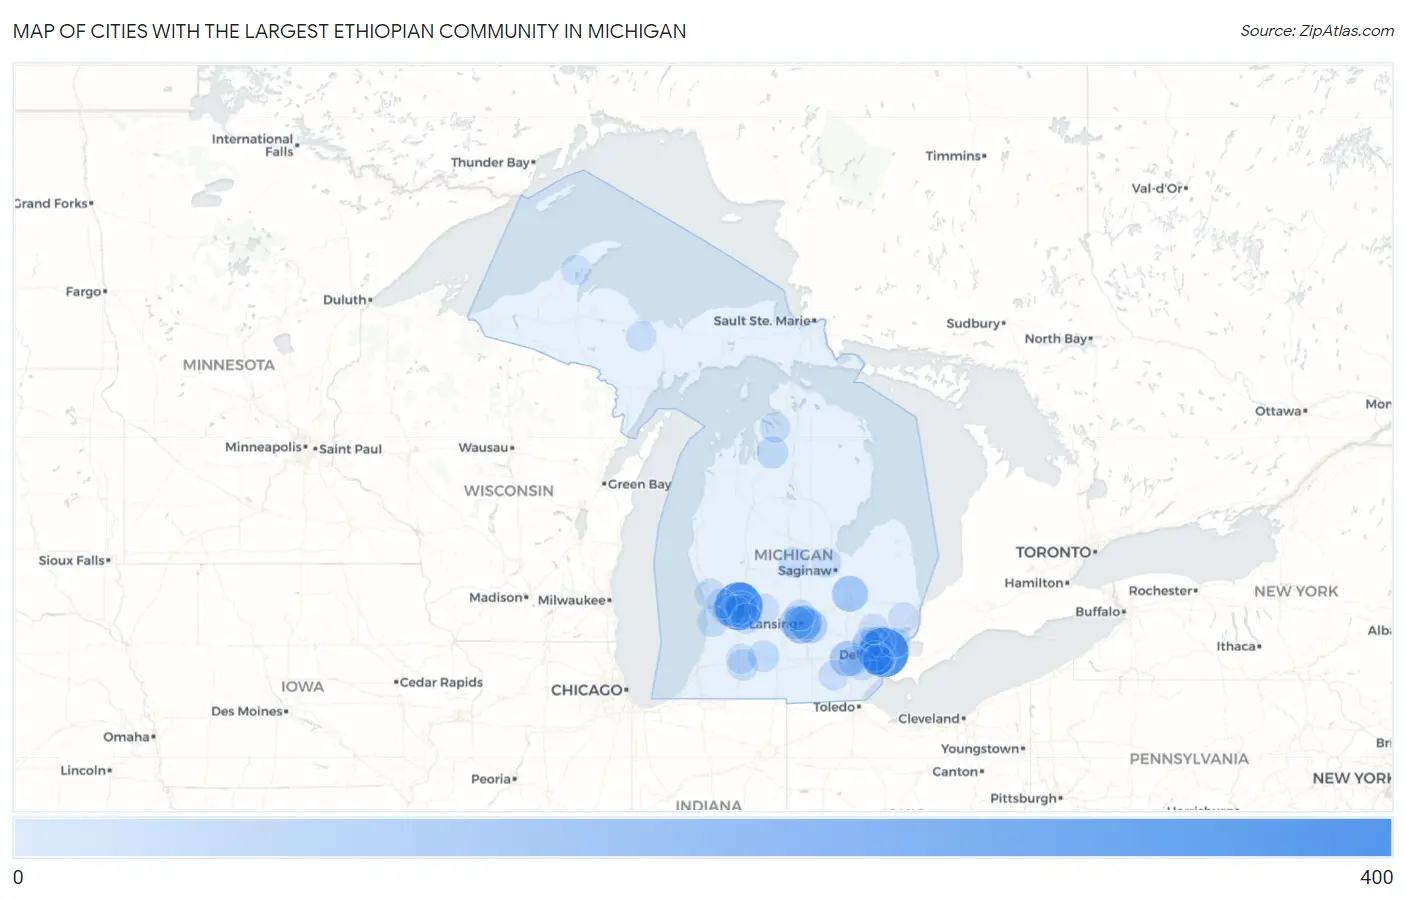
Map of Cities with the Largest Ethiopian Community in Michigan

0
400
Cities with the Largest Ethiopian Community in Michigan Map

Cities with the Largest Ethiopian Community in Michigan

City Ethiopian vs State vs National
1.Detroit3972,910(13.64%)#1355,176(0.11%)#161
2.Grand Rapids3592,910(12.34%)#2355,176(0.10%)#173
3.Dearborn1512,910(5.19%)#3355,176(0.04%)#348
4.Lansing1442,910(4.95%)#4355,176(0.04%)#359
5.Mount Morris1142,910(3.92%)#5355,176(0.03%)#433
6.Ann Arbor1052,910(3.61%)#6355,176(0.03%)#459
7.Northview1032,910(3.54%)#7355,176(0.03%)#466
8.Okemos842,910(2.89%)#8355,176(0.02%)#525
9.East Lansing792,910(2.71%)#9355,176(0.02%)#539
10.Waverly672,910(2.30%)#10355,176(0.02%)#608
11.Kentwood632,910(2.16%)#11355,176(0.02%)#619
12.Scotts602,910(2.06%)#12355,176(0.02%)#635
13.Southfield492,910(1.68%)#13355,176(0.01%)#707
14.Jenison452,910(1.55%)#14355,176(0.01%)#731
15.East Grand Rapids422,910(1.44%)#15355,176(0.01%)#754
16.Mancelona362,910(1.24%)#16355,176(0.01%)#811
17.Wyoming292,910(1.00%)#17355,176(0.01%)#882
18.Battle Creek242,910(0.82%)#18355,176(0.01%)#946
19.Portage222,910(0.76%)#19355,176(0.01%)#985
20.Holland212,910(0.72%)#20355,176(0.01%)#1,013
21.Melvindale212,910(0.72%)#21355,176(0.01%)#1,019
22.Belleville172,910(0.58%)#22355,176(0.00%)#1,091
23.Farmington Hills132,910(0.45%)#23355,176(0.00%)#1,172
24.Lincoln Park132,910(0.45%)#24355,176(0.00%)#1,176
25.Dewitt132,910(0.45%)#25355,176(0.00%)#1,195
26.Fruitport132,910(0.45%)#26355,176(0.00%)#1,199
27.Boyne City122,910(0.41%)#27355,176(0.00%)#1,224
28.Shepherd122,910(0.41%)#28355,176(0.00%)#1,228
29.Royal Oak112,910(0.38%)#29355,176(0.00%)#1,237
30.Richmond112,910(0.38%)#30355,176(0.00%)#1,255
31.Farmington102,910(0.34%)#31355,176(0.00%)#1,280
32.Dearborn Heights92,910(0.31%)#32355,176(0.00%)#1,300
33.Clinton92,910(0.31%)#33355,176(0.00%)#1,327
34.Ypsilanti82,910(0.27%)#34355,176(0.00%)#1,352
35.Saranac72,910(0.24%)#35355,176(0.00%)#1,401
36.Allen Park62,910(0.21%)#36355,176(0.00%)#1,414
37.Allendale62,910(0.21%)#37355,176(0.00%)#1,417
38.K I Sawyer62,910(0.21%)#38355,176(0.00%)#1,431
39.Caledonia62,910(0.21%)#39355,176(0.00%)#1,433
40.Kalamazoo52,910(0.17%)#40355,176(0.00%)#1,447
41.St Clair Shores52,910(0.17%)#41355,176(0.00%)#1,448
42.Freeland52,910(0.17%)#42355,176(0.00%)#1,461
43.Auburn Hills42,910(0.14%)#43355,176(0.00%)#1,484
44.Dollar Bay22,910(0.07%)#44355,176(0.00%)#1,570

Common Questions

What are the Top 10 Cities with the Largest Ethiopian Community in Michigan?
Top 10 Cities with the Largest Ethiopian Community in Michigan are:
What city has the Largest Ethiopian Community in Michigan?
Detroit has the Largest Ethiopian Community in Michigan with 397.
What is the Total Ethiopian Population in the State of Michigan?
Total Ethiopian Population in Michigan is 2,910.
What is the Total Ethiopian Population in the United States?
Total Ethiopian Population in the United States is 355,176.