Cities with the Largest Ethiopian Community in New York
RELATED REPORTS & OPTIONS
Ethiopian
New York
Compare Cities
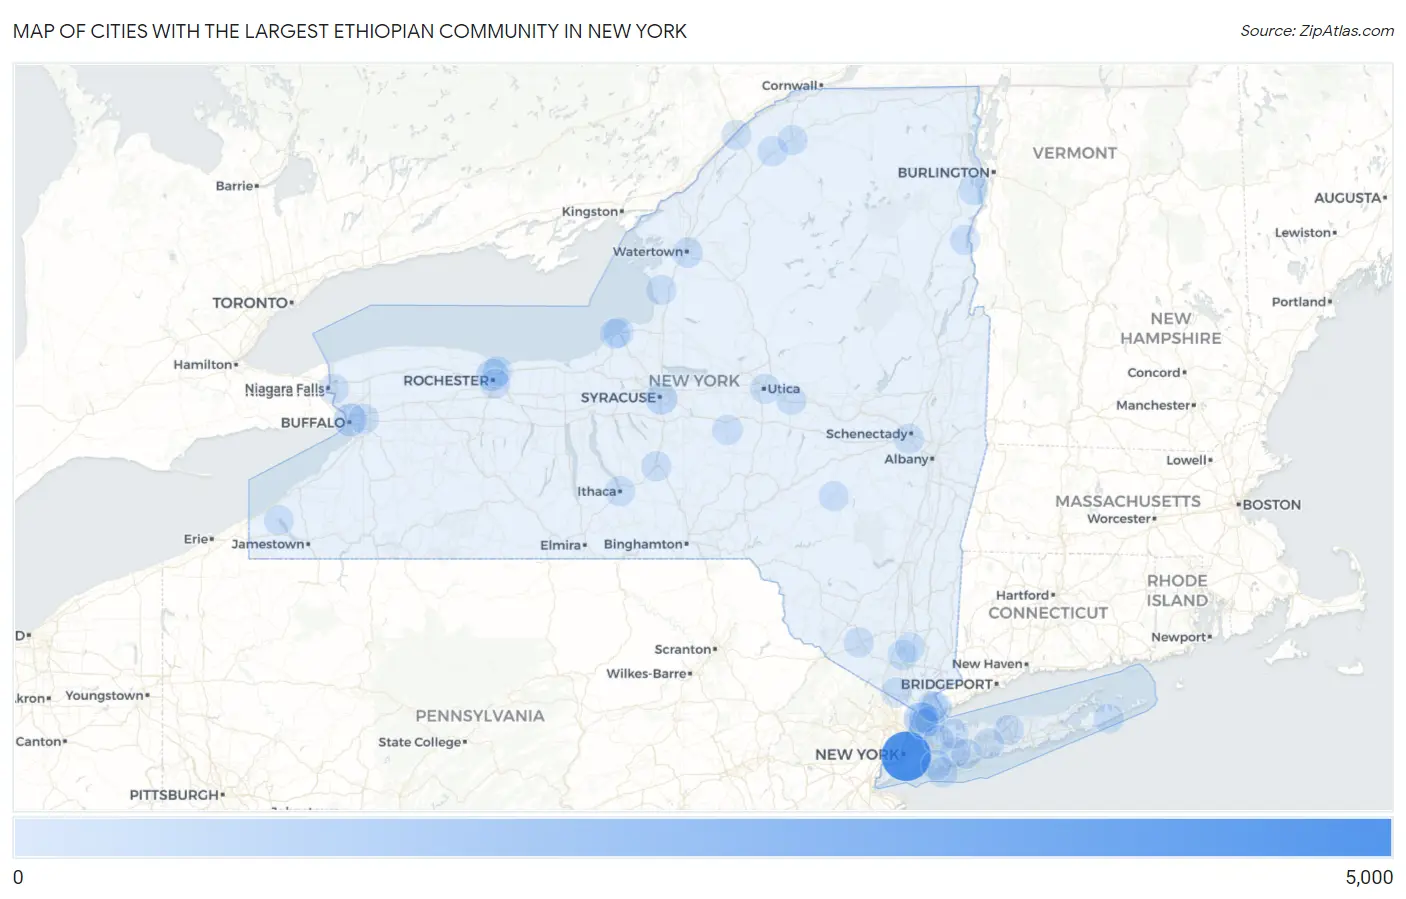
Map of Cities with the Largest Ethiopian Community in New York
0
5,000
Cities with the Largest Ethiopian Community in New York
| City | Ethiopian | vs State | vs National | |
| 1. | New York | 4,518 | 8,675(52.08%)#1 | 355,176(1.27%)#12 |
| 2. | Buffalo | 617 | 8,675(7.11%)#2 | 355,176(0.17%)#103 |
| 3. | Yonkers | 603 | 8,675(6.95%)#3 | 355,176(0.17%)#108 |
| 4. | Rochester | 415 | 8,675(4.78%)#4 | 355,176(0.12%)#154 |
| 5. | Syracuse | 395 | 8,675(4.55%)#5 | 355,176(0.11%)#162 |
| 6. | Harrison | 235 | 8,675(2.71%)#6 | 355,176(0.07%)#245 |
| 7. | Centereach | 62 | 8,675(0.71%)#7 | 355,176(0.02%)#625 |
| 8. | Mount Vernon | 58 | 8,675(0.67%)#8 | 355,176(0.02%)#649 |
| 9. | Rochester Institute Of Technology | 53 | 8,675(0.61%)#9 | 355,176(0.01%)#685 |
| 10. | New Rochelle | 49 | 8,675(0.56%)#10 | 355,176(0.01%)#705 |
| 11. | Brentwood | 45 | 8,675(0.52%)#11 | 355,176(0.01%)#725 |
| 12. | East Meadow | 45 | 8,675(0.52%)#12 | 355,176(0.01%)#726 |
| 13. | Willsboro | 42 | 8,675(0.48%)#13 | 355,176(0.01%)#757 |
| 14. | Watertown | 39 | 8,675(0.45%)#14 | 355,176(0.01%)#778 |
| 15. | Cheektowaga | 36 | 8,675(0.41%)#15 | 355,176(0.01%)#803 |
| 16. | Long Beach | 32 | 8,675(0.37%)#16 | 355,176(0.01%)#853 |
| 17. | Canton | 32 | 8,675(0.37%)#17 | 355,176(0.01%)#857 |
| 18. | Ithaca | 31 | 8,675(0.36%)#18 | 355,176(0.01%)#868 |
| 19. | White Plains | 28 | 8,675(0.32%)#19 | 355,176(0.01%)#898 |
| 20. | Hamilton | 27 | 8,675(0.31%)#20 | 355,176(0.01%)#920 |
| 21. | Woodmere | 26 | 8,675(0.30%)#21 | 355,176(0.01%)#926 |
| 22. | Tuckahoe | 21 | 8,675(0.24%)#22 | 355,176(0.01%)#1,023 |
| 23. | Cortland | 20 | 8,675(0.23%)#23 | 355,176(0.01%)#1,041 |
| 24. | Mechanicstown | 19 | 8,675(0.22%)#24 | 355,176(0.01%)#1,057 |
| 25. | Rotterdam | 16 | 8,675(0.18%)#25 | 355,176(0.00%)#1,104 |
| 26. | Upper Brookville | 14 | 8,675(0.16%)#26 | 355,176(0.00%)#1,167 |
| 27. | Utica | 12 | 8,675(0.14%)#27 | 355,176(0.00%)#1,206 |
| 28. | East Hampton | 12 | 8,675(0.14%)#28 | 355,176(0.00%)#1,229 |
| 29. | Monsey | 9 | 8,675(0.10%)#29 | 355,176(0.00%)#1,309 |
| 30. | Herkimer | 9 | 8,675(0.10%)#30 | 355,176(0.00%)#1,322 |
| 31. | Irondequoit | 8 | 8,675(0.09%)#31 | 355,176(0.00%)#1,339 |
| 32. | West Point | 8 | 8,675(0.09%)#32 | 355,176(0.00%)#1,358 |
| 33. | Niagara Falls | 7 | 8,675(0.08%)#33 | 355,176(0.00%)#1,376 |
| 34. | Oswego | 7 | 8,675(0.08%)#34 | 355,176(0.00%)#1,390 |
| 35. | Suny Oswego | 7 | 8,675(0.08%)#35 | 355,176(0.00%)#1,398 |
| 36. | Latham | 6 | 8,675(0.07%)#36 | 355,176(0.00%)#1,424 |
| 37. | Mayville | 6 | 8,675(0.07%)#37 | 355,176(0.00%)#1,439 |
| 38. | Brighton | 5 | 8,675(0.06%)#38 | 355,176(0.00%)#1,452 |
| 39. | Potsdam | 5 | 8,675(0.06%)#39 | 355,176(0.00%)#1,460 |
| 40. | South Farmingdale | 4 | 8,675(0.05%)#40 | 355,176(0.00%)#1,487 |
| 41. | Cold Spring | 4 | 8,675(0.05%)#41 | 355,176(0.00%)#1,499 |
| 42. | Port Henry | 4 | 8,675(0.05%)#42 | 355,176(0.00%)#1,503 |
| 43. | Plandome | 4 | 8,675(0.05%)#43 | 355,176(0.00%)#1,504 |
| 44. | St. John Fisher College | 4 | 8,675(0.05%)#44 | 355,176(0.00%)#1,506 |
| 45. | Stamford | 4 | 8,675(0.05%)#45 | 355,176(0.00%)#1,507 |
| 46. | Ogdensburg | 1 | 8,675(0.01%)#46 | 355,176(0.00%)#1,597 |
| 47. | Ellisburg | 1 | 8,675(0.01%)#47 | 355,176(0.00%)#1,625 |
Common Questions
What are the Top 10 Cities with the Largest Ethiopian Community in New York?
Top 10 Cities with the Largest Ethiopian Community in New York are:
#1
4,518
#2
617
#3
603
#4
415
#5
395
#6
235
#7
62
#8
58
#9
49
#10
45
What city has the Largest Ethiopian Community in New York?
New York has the Largest Ethiopian Community in New York with 4,518.
What is the Total Ethiopian Population in the State of New York?
Total Ethiopian Population in New York is 8,675.
What is the Total Ethiopian Population in the United States?
Total Ethiopian Population in the United States is 355,176.