Cities with the Largest Ethiopian Community in Massachusetts
RELATED REPORTS & OPTIONS
Ethiopian
Massachusetts
Compare Cities
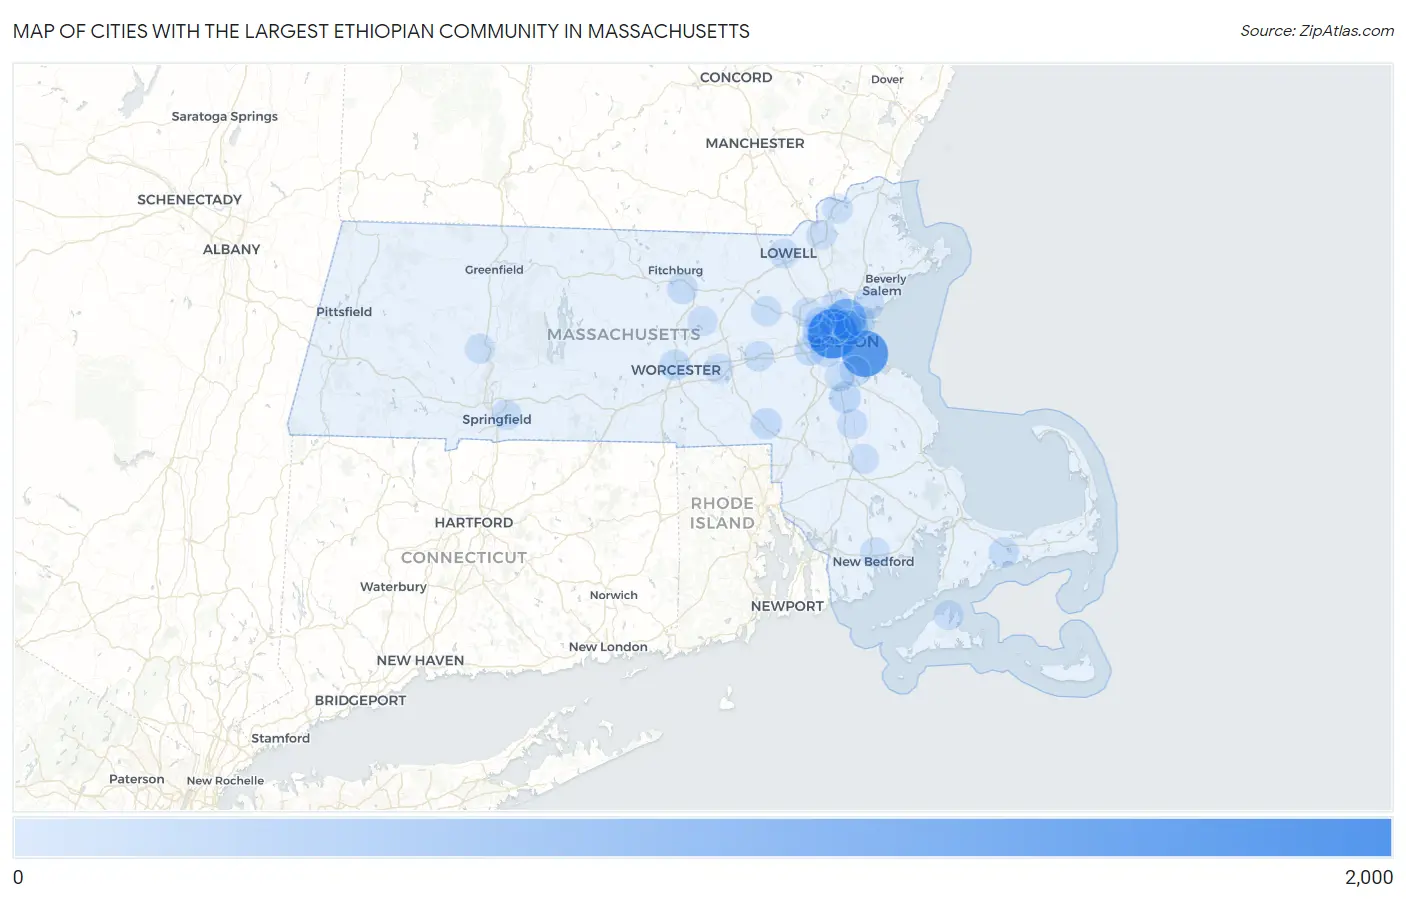
Map of Cities with the Largest Ethiopian Community in Massachusetts
0
2,000
Cities with the Largest Ethiopian Community in Massachusetts
| City | Ethiopian | vs State | vs National | |
| 1. | Cambridge | 1,710 | 6,060(28.22%)#1 | 355,176(0.48%)#34 |
| 2. | Boston | 1,439 | 6,060(23.75%)#2 | 355,176(0.41%)#42 |
| 3. | Malden | 844 | 6,060(13.93%)#3 | 355,176(0.24%)#74 |
| 4. | Chelsea | 380 | 6,060(6.27%)#4 | 355,176(0.11%)#167 |
| 5. | Randolph Town | 130 | 6,060(2.15%)#5 | 355,176(0.04%)#390 |
| 6. | Brookline | 128 | 6,060(2.11%)#6 | 355,176(0.04%)#395 |
| 7. | Medford | 102 | 6,060(1.68%)#7 | 355,176(0.03%)#469 |
| 8. | Somerville | 95 | 6,060(1.57%)#8 | 355,176(0.03%)#481 |
| 9. | Newton | 94 | 6,060(1.55%)#9 | 355,176(0.03%)#486 |
| 10. | Franklin Town | 92 | 6,060(1.52%)#10 | 355,176(0.03%)#493 |
| 11. | Everett | 88 | 6,060(1.45%)#11 | 355,176(0.02%)#509 |
| 12. | Worcester | 73 | 6,060(1.20%)#12 | 355,176(0.02%)#570 |
| 13. | Revere | 63 | 6,060(1.04%)#13 | 355,176(0.02%)#618 |
| 14. | Lynn | 61 | 6,060(1.01%)#14 | 355,176(0.02%)#628 |
| 15. | Quincy | 58 | 6,060(0.96%)#15 | 355,176(0.02%)#648 |
| 16. | Barnstable Town | 51 | 6,060(0.84%)#16 | 355,176(0.01%)#694 |
| 17. | Leominster | 50 | 6,060(0.83%)#17 | 355,176(0.01%)#700 |
| 18. | Watertown Town | 37 | 6,060(0.61%)#18 | 355,176(0.01%)#794 |
| 19. | Stoneham | 35 | 6,060(0.58%)#19 | 355,176(0.01%)#815 |
| 20. | Framingham | 28 | 6,060(0.46%)#20 | 355,176(0.01%)#897 |
| 21. | Brockton | 27 | 6,060(0.45%)#21 | 355,176(0.01%)#909 |
| 22. | Springfield | 20 | 6,060(0.33%)#22 | 355,176(0.01%)#1,028 |
| 23. | West Concord | 17 | 6,060(0.28%)#23 | 355,176(0.00%)#1,089 |
| 24. | Arlington | 16 | 6,060(0.26%)#24 | 355,176(0.00%)#1,100 |
| 25. | Milton | 15 | 6,060(0.25%)#25 | 355,176(0.00%)#1,127 |
| 26. | Westborough | 15 | 6,060(0.25%)#26 | 355,176(0.00%)#1,138 |
| 27. | Lawrence | 14 | 6,060(0.23%)#27 | 355,176(0.00%)#1,146 |
| 28. | Amherst | 14 | 6,060(0.23%)#28 | 355,176(0.00%)#1,151 |
| 29. | New Bedford | 11 | 6,060(0.18%)#29 | 355,176(0.00%)#1,233 |
| 30. | Belmont | 11 | 6,060(0.18%)#30 | 355,176(0.00%)#1,243 |
| 31. | Haverhill | 10 | 6,060(0.17%)#31 | 355,176(0.00%)#1,270 |
| 32. | Lexington | 8 | 6,060(0.13%)#32 | 355,176(0.00%)#1,342 |
| 33. | Bridgewater Town | 8 | 6,060(0.13%)#33 | 355,176(0.00%)#1,347 |
| 34. | Clinton | 4 | 6,060(0.07%)#34 | 355,176(0.00%)#1,494 |
| 35. | Northampton | 2 | 6,060(0.03%)#35 | 355,176(0.00%)#1,551 |
| 36. | Vineyard Haven | 2 | 6,060(0.03%)#36 | 355,176(0.00%)#1,567 |
| 37. | Lowell | 1 | 6,060(0.02%)#37 | 355,176(0.00%)#1,580 |
Common Questions
What are the Top 10 Cities with the Largest Ethiopian Community in Massachusetts?
Top 10 Cities with the Largest Ethiopian Community in Massachusetts are:
#1
1,710
#2
1,439
#3
844
#4
380
#5
130
#6
128
#7
102
#8
95
#9
94
#10
92
What city has the Largest Ethiopian Community in Massachusetts?
Cambridge has the Largest Ethiopian Community in Massachusetts with 1,710.
What is the Total Ethiopian Population in the State of Massachusetts?
Total Ethiopian Population in Massachusetts is 6,060.
What is the Total Ethiopian Population in the United States?
Total Ethiopian Population in the United States is 355,176.