Cities with the Largest Ethiopian Community in Texas
RELATED REPORTS & OPTIONS
Ethiopian
Texas
Compare Cities
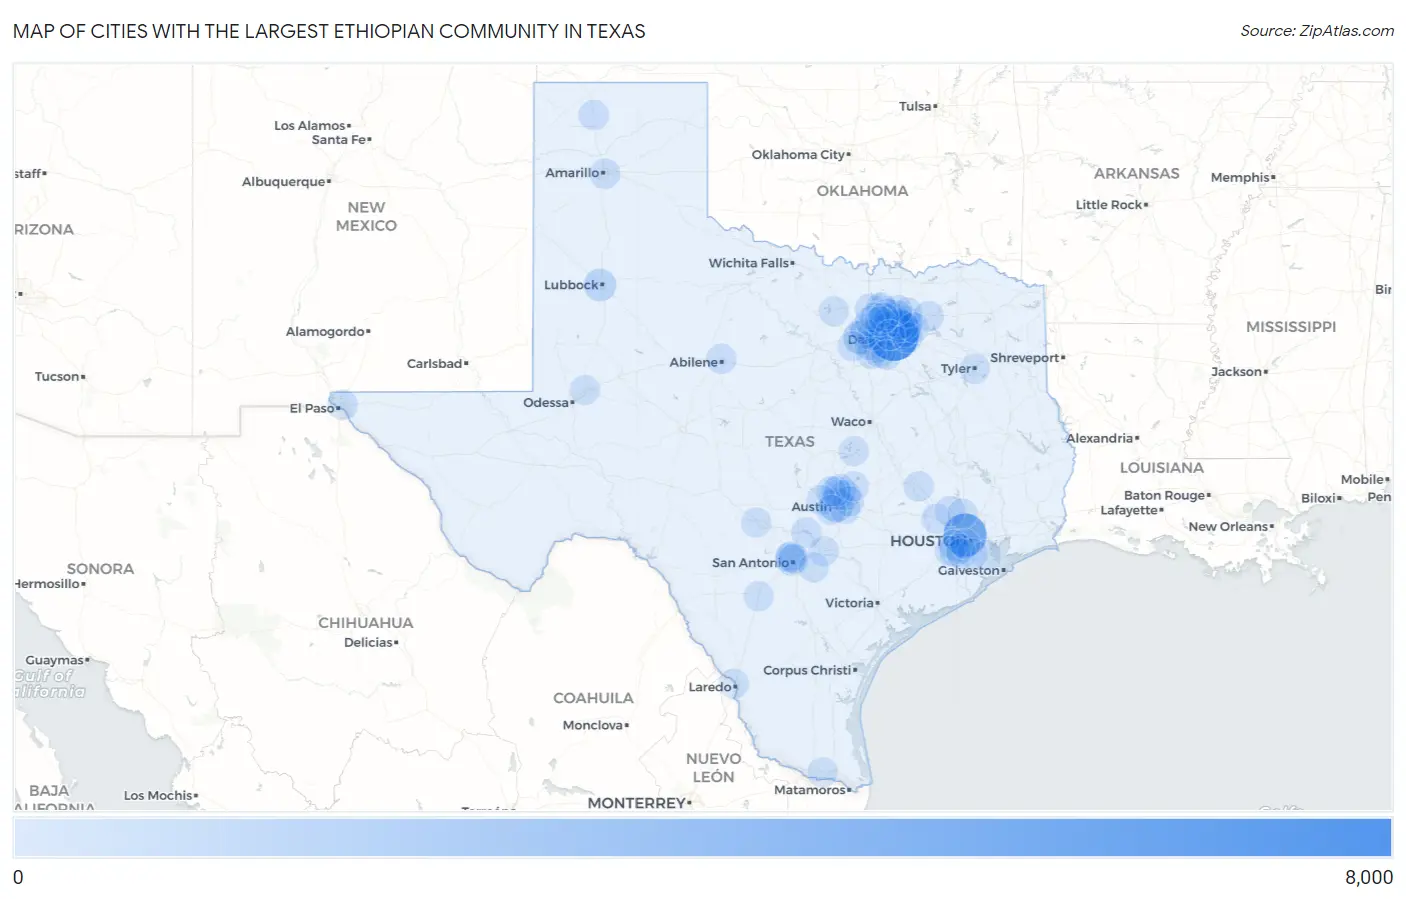
Map of Cities with the Largest Ethiopian Community in Texas
0
8,000
Cities with the Largest Ethiopian Community in Texas
| City | Ethiopian | vs State | vs National | |
| 1. | Dallas | 6,243 | 29,054(21.49%)#1 | 355,176(1.76%)#6 |
| 2. | Houston | 4,161 | 29,054(14.32%)#2 | 355,176(1.17%)#14 |
| 3. | Garland | 2,922 | 29,054(10.06%)#3 | 355,176(0.82%)#21 |
| 4. | Austin | 1,229 | 29,054(4.23%)#4 | 355,176(0.35%)#50 |
| 5. | Rowlett | 1,185 | 29,054(4.08%)#5 | 355,176(0.33%)#51 |
| 6. | Richardson | 1,158 | 29,054(3.99%)#6 | 355,176(0.33%)#52 |
| 7. | Irving | 1,065 | 29,054(3.67%)#7 | 355,176(0.30%)#55 |
| 8. | Fort Worth | 1,041 | 29,054(3.58%)#8 | 355,176(0.29%)#58 |
| 9. | Plano | 1,000 | 29,054(3.44%)#9 | 355,176(0.28%)#60 |
| 10. | Lubbock | 744 | 29,054(2.56%)#10 | 355,176(0.21%)#88 |
| 11. | Wylie | 630 | 29,054(2.17%)#11 | 355,176(0.18%)#99 |
| 12. | Allen | 592 | 29,054(2.04%)#12 | 355,176(0.17%)#110 |
| 13. | Sachse | 499 | 29,054(1.72%)#13 | 355,176(0.14%)#132 |
| 14. | Round Rock | 375 | 29,054(1.29%)#14 | 355,176(0.11%)#168 |
| 15. | Little Elm | 313 | 29,054(1.08%)#15 | 355,176(0.09%)#200 |
| 16. | Sugar Land | 268 | 29,054(0.92%)#16 | 355,176(0.08%)#213 |
| 17. | Grand Prairie | 259 | 29,054(0.89%)#17 | 355,176(0.07%)#221 |
| 18. | San Antonio | 199 | 29,054(0.68%)#18 | 355,176(0.06%)#276 |
| 19. | Cedar Hill | 160 | 29,054(0.55%)#19 | 355,176(0.05%)#326 |
| 20. | Murphy | 152 | 29,054(0.52%)#20 | 355,176(0.04%)#344 |
| 21. | Hornsby Bend | 134 | 29,054(0.46%)#21 | 355,176(0.04%)#376 |
| 22. | Wells Branch | 133 | 29,054(0.46%)#22 | 355,176(0.04%)#379 |
| 23. | Carrollton | 132 | 29,054(0.45%)#23 | 355,176(0.04%)#381 |
| 24. | Arlington | 131 | 29,054(0.45%)#24 | 355,176(0.04%)#386 |
| 25. | Cactus | 126 | 29,054(0.43%)#25 | 355,176(0.04%)#400 |
| 26. | Abilene | 115 | 29,054(0.40%)#26 | 355,176(0.03%)#429 |
| 27. | Greenville | 113 | 29,054(0.39%)#27 | 355,176(0.03%)#436 |
| 28. | Canyon Lake | 111 | 29,054(0.38%)#28 | 355,176(0.03%)#441 |
| 29. | Pearland | 110 | 29,054(0.38%)#29 | 355,176(0.03%)#444 |
| 30. | Amarillo | 108 | 29,054(0.37%)#30 | 355,176(0.03%)#452 |
| 31. | El Paso | 89 | 29,054(0.31%)#31 | 355,176(0.03%)#500 |
| 32. | Euless | 84 | 29,054(0.29%)#32 | 355,176(0.02%)#523 |
| 33. | Pflugerville | 81 | 29,054(0.28%)#33 | 355,176(0.02%)#530 |
| 34. | Travis Ranch | 80 | 29,054(0.28%)#34 | 355,176(0.02%)#538 |
| 35. | Denton | 75 | 29,054(0.26%)#35 | 355,176(0.02%)#560 |
| 36. | Magnolia | 66 | 29,054(0.23%)#36 | 355,176(0.02%)#611 |
| 37. | The Woodlands | 60 | 29,054(0.21%)#37 | 355,176(0.02%)#630 |
| 38. | Frisco | 59 | 29,054(0.20%)#38 | 355,176(0.02%)#637 |
| 39. | Manor | 56 | 29,054(0.19%)#39 | 355,176(0.02%)#668 |
| 40. | Bridgeport | 55 | 29,054(0.19%)#40 | 355,176(0.02%)#675 |
| 41. | Castle Hills | 52 | 29,054(0.18%)#41 | 355,176(0.01%)#692 |
| 42. | North Richland Hills | 47 | 29,054(0.16%)#42 | 355,176(0.01%)#717 |
| 43. | Mission Bend | 47 | 29,054(0.16%)#43 | 355,176(0.01%)#718 |
| 44. | Seguin | 45 | 29,054(0.15%)#44 | 355,176(0.01%)#728 |
| 45. | Princeton | 45 | 29,054(0.15%)#45 | 355,176(0.01%)#730 |
| 46. | Balcones Heights | 40 | 29,054(0.14%)#46 | 355,176(0.01%)#772 |
| 47. | Brushy Creek | 38 | 29,054(0.13%)#47 | 355,176(0.01%)#784 |
| 48. | Weslaco | 33 | 29,054(0.11%)#48 | 355,176(0.01%)#837 |
| 49. | Stafford | 33 | 29,054(0.11%)#49 | 355,176(0.01%)#838 |
| 50. | Fate | 32 | 29,054(0.11%)#50 | 355,176(0.01%)#855 |
| 51. | Mckinney | 31 | 29,054(0.11%)#51 | 355,176(0.01%)#861 |
| 52. | Richmond | 27 | 29,054(0.09%)#52 | 355,176(0.01%)#915 |
| 53. | Missouri City | 24 | 29,054(0.08%)#53 | 355,176(0.01%)#942 |
| 54. | Mansfield | 24 | 29,054(0.08%)#54 | 355,176(0.01%)#943 |
| 55. | Nassau Bay | 21 | 29,054(0.07%)#55 | 355,176(0.01%)#1,025 |
| 56. | College Station | 19 | 29,054(0.07%)#56 | 355,176(0.01%)#1,047 |
| 57. | Glenn Heights | 17 | 29,054(0.06%)#57 | 355,176(0.00%)#1,087 |
| 58. | Keller | 15 | 29,054(0.05%)#58 | 355,176(0.00%)#1,123 |
| 59. | Providence Village | 15 | 29,054(0.05%)#59 | 355,176(0.00%)#1,137 |
| 60. | Olmos Park | 15 | 29,054(0.05%)#60 | 355,176(0.00%)#1,139 |
| 61. | Flower Mound | 13 | 29,054(0.04%)#61 | 355,176(0.00%)#1,173 |
| 62. | Highland Village | 13 | 29,054(0.04%)#62 | 355,176(0.00%)#1,185 |
| 63. | Midland | 12 | 29,054(0.04%)#63 | 355,176(0.00%)#1,200 |
| 64. | Tyler | 12 | 29,054(0.04%)#64 | 355,176(0.00%)#1,202 |
| 65. | Temple | 12 | 29,054(0.04%)#65 | 355,176(0.00%)#1,205 |
| 66. | Pearsall | 11 | 29,054(0.04%)#66 | 355,176(0.00%)#1,253 |
| 67. | Lewisville | 10 | 29,054(0.03%)#67 | 355,176(0.00%)#1,268 |
| 68. | Cedar Park | 9 | 29,054(0.03%)#68 | 355,176(0.00%)#1,298 |
| 69. | Bellaire | 9 | 29,054(0.03%)#69 | 355,176(0.00%)#1,313 |
| 70. | Benbrook | 8 | 29,054(0.03%)#70 | 355,176(0.00%)#1,349 |
| 71. | Point Venture | 8 | 29,054(0.03%)#71 | 355,176(0.00%)#1,367 |
| 72. | Laredo | 6 | 29,054(0.02%)#72 | 355,176(0.00%)#1,406 |
| 73. | The Colony | 6 | 29,054(0.02%)#73 | 355,176(0.00%)#1,412 |
| 74. | University Park | 6 | 29,054(0.02%)#74 | 355,176(0.00%)#1,418 |
| 75. | La Vernia | 5 | 29,054(0.02%)#75 | 355,176(0.00%)#1,470 |
| 76. | Kerrville | 4 | 29,054(0.01%)#76 | 355,176(0.00%)#1,485 |
| 77. | Taylor | 4 | 29,054(0.01%)#77 | 355,176(0.00%)#1,486 |
| 78. | Prairie View | 4 | 29,054(0.01%)#78 | 355,176(0.00%)#1,493 |
| 79. | Sunset Valley | 3 | 29,054(0.01%)#79 | 355,176(0.00%)#1,539 |
Common Questions
What are the Top 10 Cities with the Largest Ethiopian Community in Texas?
Top 10 Cities with the Largest Ethiopian Community in Texas are:
#1
6,243
#2
4,161
#3
2,922
#4
1,229
#5
1,185
#6
1,158
#7
1,065
#8
1,041
#9
1,000
#10
744
What city has the Largest Ethiopian Community in Texas?
Dallas has the Largest Ethiopian Community in Texas with 6,243.
What is the Total Ethiopian Population in the State of Texas?
Total Ethiopian Population in Texas is 29,054.
What is the Total Ethiopian Population in the United States?
Total Ethiopian Population in the United States is 355,176.