Cities with the Largest Bangladeshi Community in the United States
RELATED REPORTS & OPTIONS
Bangladeshi
United States
Compare Cities
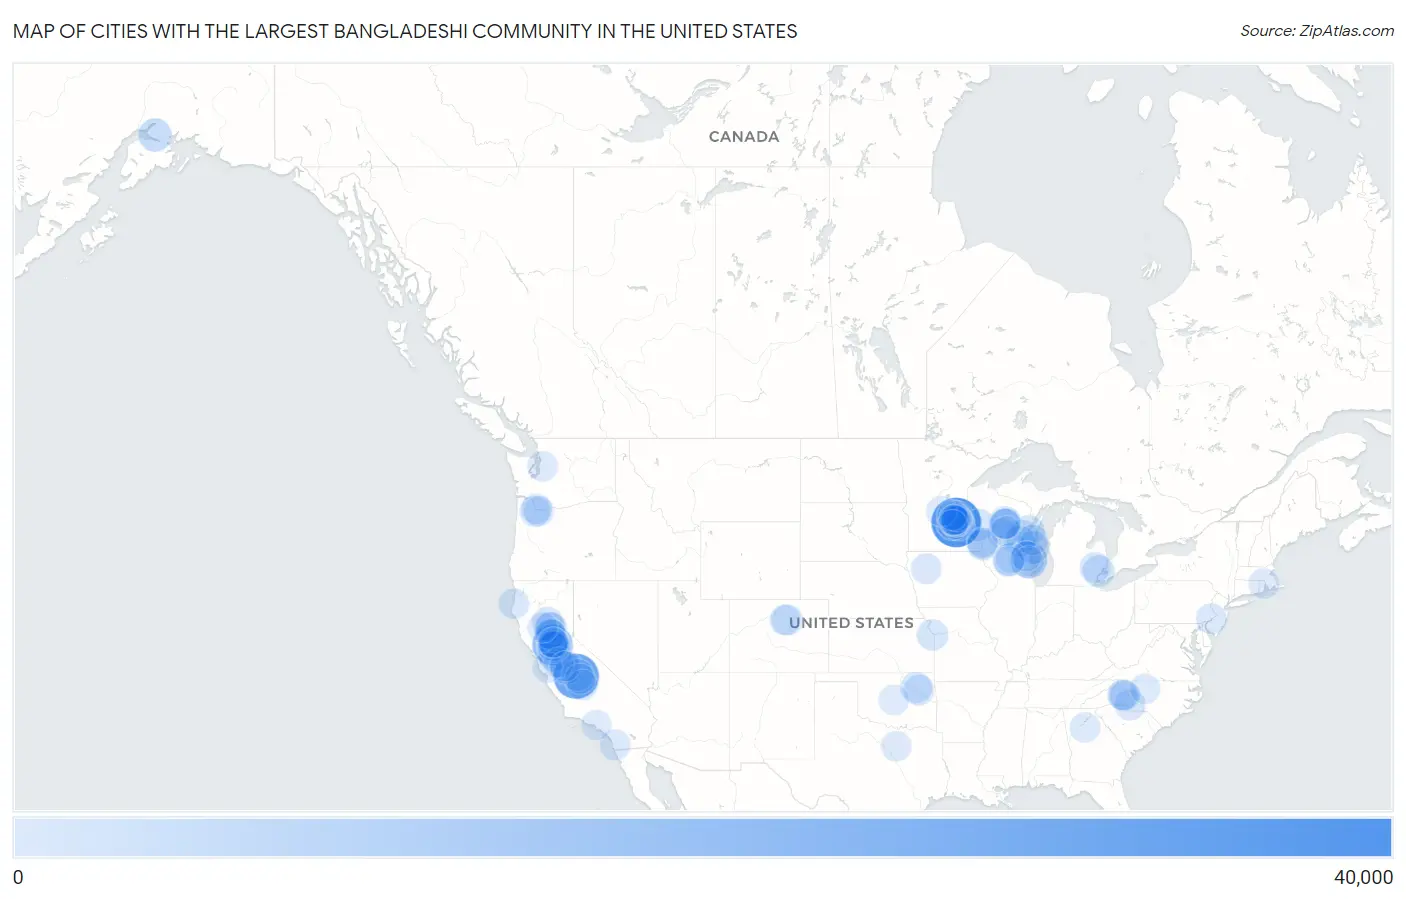
Map of Cities with the Largest Bangladeshi Community in the United States
0
40,000
Cities with the Largest Bangladeshi Community in the United States
| City | Bangladeshi | vs State | vs National | |
| 1. | St Paul | 34,815 | 97,741(35.62%)#1 | 348,407(9.99%)#1 |
| 2. | Fresno | 26,899 | 112,008(24.02%)#1 | 348,407(7.72%)#2 |
| 3. | Sacramento | 18,134 | 112,008(16.19%)#2 | 348,407(5.20%)#3 |
| 4. | Milwaukee | 11,469 | 58,516(19.60%)#1 | 348,407(3.29%)#4 |
| 5. | Brooklyn Park | 10,843 | 97,741(11.09%)#2 | 348,407(3.11%)#5 |
| 6. | Minneapolis | 7,388 | 97,741(7.56%)#3 | 348,407(2.12%)#6 |
| 7. | Maplewood | 6,374 | 97,741(6.52%)#4 | 348,407(1.83%)#7 |
| 8. | Florin | 5,369 | 112,008(4.79%)#3 | 348,407(1.54%)#8 |
| 9. | Anchorage | 5,363 | 5,909(90.76%)#1 | 348,407(1.54%)#9 |
| 10. | Stockton | 5,262 | 112,008(4.70%)#4 | 348,407(1.51%)#10 |
| 11. | Sheboygan | 5,002 | 58,516(8.55%)#2 | 348,407(1.44%)#11 |
| 12. | Merced | 4,854 | 112,008(4.33%)#5 | 348,407(1.39%)#12 |
| 13. | Wausau | 3,617 | 58,516(6.18%)#3 | 348,407(1.04%)#13 |
| 14. | Brooklyn Center | 3,279 | 97,741(3.35%)#5 | 348,407(0.94%)#14 |
| 15. | Clovis | 3,194 | 112,008(2.85%)#6 | 348,407(0.92%)#15 |
| 16. | Appleton | 2,965 | 58,516(5.07%)#4 | 348,407(0.85%)#16 |
| 17. | Eau Claire | 2,868 | 58,516(4.90%)#5 | 348,407(0.82%)#17 |
| 18. | Green Bay | 2,822 | 58,516(4.82%)#6 | 348,407(0.81%)#18 |
| 19. | Warren | 2,821 | 7,768(36.32%)#1 | 348,407(0.81%)#19 |
| 20. | Oakdale | 2,772 | 97,741(2.84%)#6 | 348,407(0.80%)#20 |
| 21. | Woodbury | 2,706 | 97,741(2.77%)#7 | 348,407(0.78%)#21 |
| 22. | Madison | 2,516 | 58,516(4.30%)#7 | 348,407(0.72%)#22 |
| 23. | Elk Grove | 2,435 | 112,008(2.17%)#7 | 348,407(0.70%)#23 |
| 24. | Linda | 2,313 | 112,008(2.07%)#8 | 348,407(0.66%)#24 |
| 25. | Coon Rapids | 2,247 | 97,741(2.30%)#8 | 348,407(0.64%)#25 |
| 26. | Kansas City | 2,239 | 3,299(67.87%)#1 | 348,407(0.64%)#26 |
| 27. | Oshkosh | 2,165 | 58,516(3.70%)#8 | 348,407(0.62%)#27 |
| 28. | Blaine | 2,144 | 97,741(2.19%)#9 | 348,407(0.62%)#28 |
| 29. | Cottage Grove | 1,936 | 97,741(1.98%)#10 | 348,407(0.56%)#29 |
| 30. | Tulsa | 1,804 | 7,291(24.74%)#1 | 348,407(0.52%)#30 |
| 31. | North St Paul | 1,722 | 97,741(1.76%)#11 | 348,407(0.49%)#31 |
| 32. | Chico | 1,684 | 112,008(1.50%)#9 | 348,407(0.48%)#32 |
| 33. | Oroville | 1,662 | 112,008(1.48%)#10 | 348,407(0.48%)#33 |
| 34. | Lemon Hill | 1,521 | 112,008(1.36%)#11 | 348,407(0.44%)#34 |
| 35. | Charlotte | 1,444 | 13,851(10.43%)#1 | 348,407(0.41%)#35 |
| 36. | Manitowoc | 1,442 | 58,516(2.46%)#9 | 348,407(0.41%)#36 |
| 37. | Franklin Cdp Merced County | 1,382 | 112,008(1.23%)#12 | 348,407(0.40%)#37 |
| 38. | Visalia | 1,153 | 112,008(1.03%)#13 | 348,407(0.33%)#38 |
| 39. | Rancho Cordova | 1,152 | 112,008(1.03%)#14 | 348,407(0.33%)#39 |
| 40. | La Crosse | 1,129 | 58,516(1.93%)#10 | 348,407(0.32%)#40 |
| 41. | Thermalito | 1,119 | 112,008(1.00%)#15 | 348,407(0.32%)#41 |
| 42. | Olivehurst | 1,106 | 112,008(0.99%)#16 | 348,407(0.32%)#42 |
| 43. | Vineyard | 1,098 | 112,008(0.98%)#17 | 348,407(0.32%)#43 |
| 44. | Portland | 1,089 | 3,114(34.97%)#1 | 348,407(0.31%)#44 |
| 45. | Broken Arrow | 1,086 | 7,291(14.90%)#2 | 348,407(0.31%)#45 |
| 46. | Thornton | 1,060 | 4,951(21.41%)#1 | 348,407(0.30%)#46 |
| 47. | Hickory | 1,059 | 13,851(7.65%)#2 | 348,407(0.30%)#47 |
| 48. | Pontiac | 1,050 | 7,768(13.52%)#2 | 348,407(0.30%)#48 |
| 49. | San Diego | 1,003 | 112,008(0.90%)#18 | 348,407(0.29%)#49 |
| 50. | Arden Arcade | 859 | 112,008(0.77%)#19 | 348,407(0.25%)#50 |
| 51. | White Bear Lake | 857 | 97,741(0.88%)#12 | 348,407(0.25%)#51 |
| 52. | Little Canada | 856 | 97,741(0.88%)#13 | 348,407(0.25%)#52 |
| 53. | Westminster | 836 | 4,951(16.89%)#2 | 348,407(0.24%)#53 |
| 54. | Andover | 820 | 97,741(0.84%)#14 | 348,407(0.24%)#54 |
| 55. | Eureka | 813 | 112,008(0.73%)#20 | 348,407(0.23%)#55 |
| 56. | Yuba City | 810 | 112,008(0.72%)#21 | 348,407(0.23%)#56 |
| 57. | Fridley | 799 | 97,741(0.82%)#15 | 348,407(0.23%)#57 |
| 58. | Storm Lake | 762 | 1,274(59.81%)#1 | 348,407(0.22%)#58 |
| 59. | Weston | 756 | 58,516(1.29%)#11 | 348,407(0.22%)#59 |
| 60. | Onalaska | 748 | 58,516(1.28%)#12 | 348,407(0.21%)#60 |
| 61. | Roseville | 735 | 97,741(0.75%)#16 | 348,407(0.21%)#61 |
| 62. | Philadelphia | 710 | 1,880(37.77%)#1 | 348,407(0.20%)#62 |
| 63. | Parkway | 678 | 112,008(0.61%)#22 | 348,407(0.19%)#63 |
| 64. | Kirkland | 677 | 4,730(14.31%)#1 | 348,407(0.19%)#64 |
| 65. | Wisconsin Rapids | 670 | 58,516(1.14%)#13 | 348,407(0.19%)#65 |
| 66. | Vadnais Heights | 665 | 97,741(0.68%)#17 | 348,407(0.19%)#66 |
| 67. | Fort Worth | 619 | 3,288(18.83%)#1 | 348,407(0.18%)#67 |
| 68. | Ham Lake | 615 | 97,741(0.63%)#18 | 348,407(0.18%)#68 |
| 69. | Mounds View | 598 | 97,741(0.61%)#19 | 348,407(0.17%)#69 |
| 70. | Holmen | 586 | 58,516(1.00%)#14 | 348,407(0.17%)#70 |
| 71. | Sun Prairie | 563 | 58,516(0.96%)#15 | 348,407(0.16%)#71 |
| 72. | Providence | 559 | 900(62.11%)#1 | 348,407(0.16%)#72 |
| 73. | New Brighton | 531 | 97,741(0.54%)#20 | 348,407(0.15%)#73 |
| 74. | West Allis | 516 | 58,516(0.88%)#16 | 348,407(0.15%)#74 |
| 75. | San Jose | 506 | 112,008(0.45%)#23 | 348,407(0.15%)#75 |
| 76. | Forest Lake | 505 | 97,741(0.52%)#21 | 348,407(0.14%)#76 |
| 77. | Rothschild | 499 | 58,516(0.85%)#17 | 348,407(0.14%)#77 |
| 78. | Fitchburg | 480 | 58,516(0.82%)#18 | 348,407(0.14%)#78 |
| 79. | Snellville | 480 | 5,534(8.67%)#1 | 348,407(0.14%)#79 |
| 80. | Newton | 474 | 13,851(3.42%)#3 | 348,407(0.14%)#80 |
| 81. | Long View | 472 | 13,851(3.41%)#4 | 348,407(0.14%)#81 |
| 82. | Modesto | 467 | 112,008(0.42%)#24 | 348,407(0.13%)#82 |
| 83. | Rib Mountain | 465 | 58,516(0.79%)#19 | 348,407(0.13%)#83 |
| 84. | Oklahoma City | 459 | 7,291(6.30%)#3 | 348,407(0.13%)#84 |
| 85. | Rio Linda | 459 | 112,008(0.41%)#25 | 348,407(0.13%)#85 |
| 86. | St Cloud | 457 | 97,741(0.47%)#22 | 348,407(0.13%)#86 |
| 87. | North Highlands | 452 | 112,008(0.40%)#26 | 348,407(0.13%)#87 |
| 88. | Atwater | 451 | 112,008(0.40%)#27 | 348,407(0.13%)#88 |
| 89. | Willows | 450 | 112,008(0.40%)#28 | 348,407(0.13%)#89 |
| 90. | Lino Lakes | 449 | 97,741(0.46%)#23 | 348,407(0.13%)#90 |
| 91. | Vancouver | 434 | 4,730(9.18%)#2 | 348,407(0.12%)#91 |
| 92. | Los Angeles | 428 | 112,008(0.38%)#29 | 348,407(0.12%)#92 |
| 93. | Greensboro | 426 | 13,851(3.08%)#5 | 348,407(0.12%)#93 |
| 94. | Germantown | 421 | 58,516(0.72%)#20 | 348,407(0.12%)#94 |
| 95. | Spring Lake Park | 412 | 97,741(0.42%)#24 | 348,407(0.12%)#95 |
| 96. | Stevens Point | 411 | 58,516(0.70%)#21 | 348,407(0.12%)#96 |
| 97. | Gresham | 410 | 3,114(13.17%)#2 | 348,407(0.12%)#97 |
| 98. | Oak Grove | 401 | 97,741(0.41%)#25 | 348,407(0.12%)#98 |
| 99. | Sanger | 399 | 112,008(0.36%)#30 | 348,407(0.11%)#99 |
| 100. | Bloomington | 398 | 97,741(0.41%)#26 | 348,407(0.11%)#100 |
Common Questions
What are the Top 10 Cities with the Largest Bangladeshi Community in the United States?
Top 10 Cities with the Largest Bangladeshi Community in the United States are:
What city has the Largest Bangladeshi Community in the United States?
St Paul has the Largest Bangladeshi Community in the United States with 34,815.
What is the Total Bangladeshi Population in the United States?
Total Bangladeshi Population in the United States is 348,407.