Cities with the Highest Percentage of Renter-Occupied Units in Oregon
RELATED REPORTS & OPTIONS
Highest Renter-Occupied
Oregon
Compare Cities
Map of Cities with the Highest Percentage of Renter-Occupied Units in Oregon
0.0%
100.0%
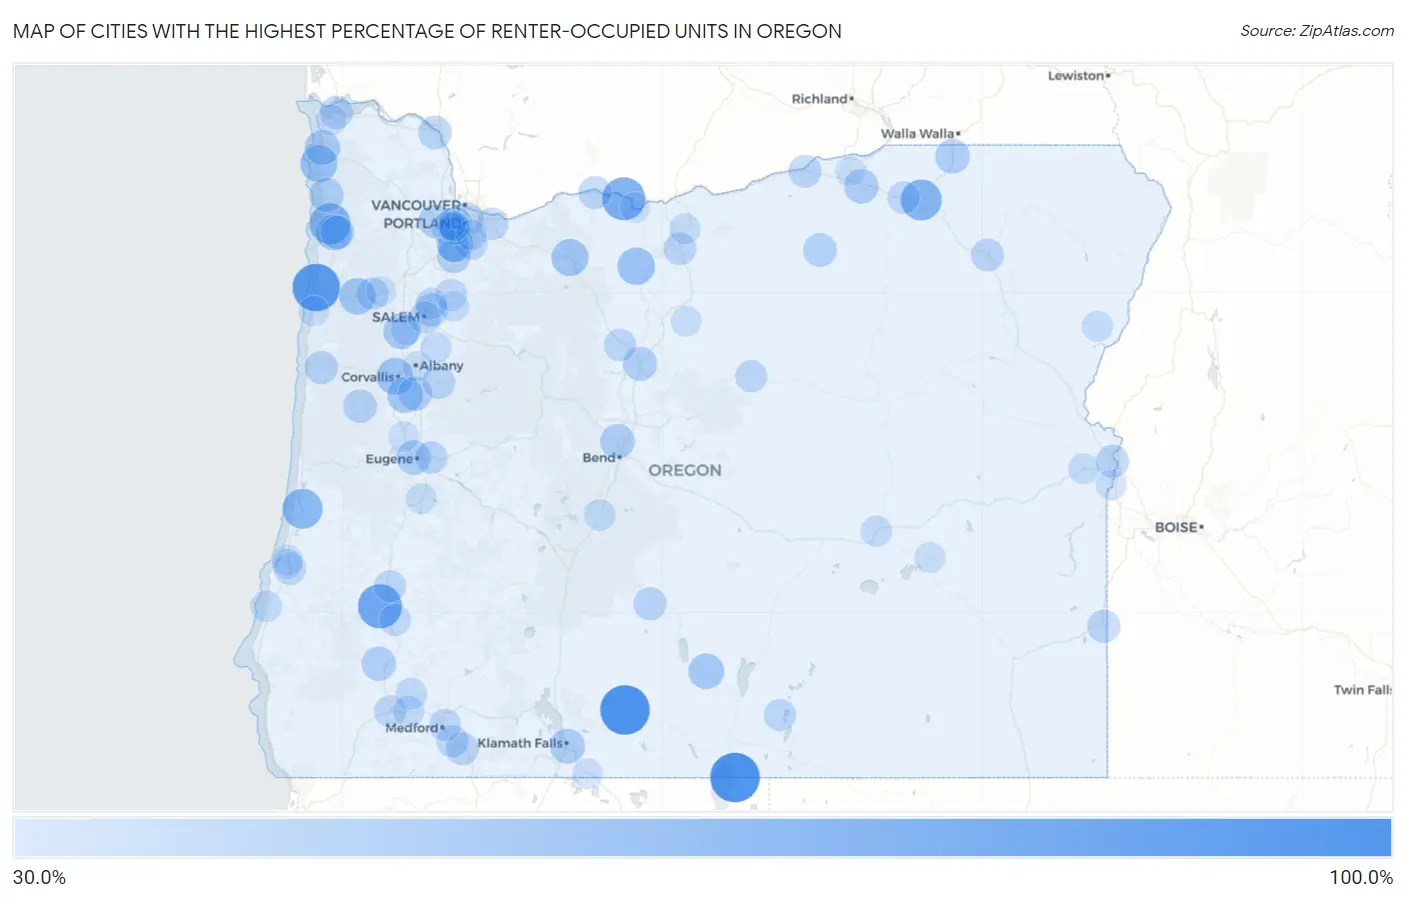
Cities with the Highest Percentage of Renter-Occupied Units in Oregon
| City | % Renter-Occupied | vs State | vs National | |
| 1. | New Pine Creek | 100.0% | 36.8%(+63.2)#1 | 35.2%(+64.8)#83 |
| 2. | Beatty | 100.0% | 36.8%(+63.2)#2 | 35.2%(+64.8)#198 |
| 3. | Neskowin | 93.3% | 36.8%(+56.5)#3 | 35.2%(+58.1)#297 |
| 4. | Dillard | 82.6% | 36.8%(+45.9)#4 | 35.2%(+47.5)#400 |
| 5. | Rowena | 78.9% | 36.8%(+42.2)#5 | 35.2%(+43.8)#466 |
| 6. | Idaville | 72.5% | 36.8%(+35.7)#6 | 35.2%(+37.3)#616 |
| 7. | Mission | 71.9% | 36.8%(+35.2)#7 | 35.2%(+36.8)#639 |
| 8. | Gardiner | 69.1% | 36.8%(+32.4)#8 | 35.2%(+34.0)#757 |
| 9. | Chemult | 67.4% | 36.8%(+30.6)#9 | 35.2%(+32.2)#826 |
| 10. | Tygh Valley | 60.6% | 36.8%(+23.8)#10 | 35.2%(+25.4)#1,312 |
| 11. | Cannon Beach | 60.0% | 36.8%(+23.2)#11 | 35.2%(+24.8)#1,378 |
| 12. | Government Camp | 59.7% | 36.8%(+22.9)#12 | 35.2%(+24.5)#1,410 |
| 13. | Corvallis | 59.0% | 36.8%(+22.2)#13 | 35.2%(+23.8)#1,485 |
| 14. | Grand Ronde | 58.3% | 36.8%(+21.5)#14 | 35.2%(+23.1)#1,553 |
| 15. | Durham | 58.3% | 36.8%(+21.5)#15 | 35.2%(+23.1)#1,556 |
| 16. | Wedderburn | 57.9% | 36.8%(+21.2)#16 | 35.2%(+22.8)#1,596 |
| 17. | Peoria | 56.2% | 36.8%(+19.5)#17 | 35.2%(+21.1)#1,835 |
| 18. | Tillamook | 56.2% | 36.8%(+19.4)#18 | 35.2%(+21.0)#1,847 |
| 19. | Monmouth | 56.0% | 36.8%(+19.3)#19 | 35.2%(+20.9)#1,862 |
| 20. | Paisley | 55.7% | 36.8%(+18.9)#20 | 35.2%(+20.5)#1,915 |
| 21. | Seaside | 54.2% | 36.8%(+17.5)#21 | 35.2%(+19.1)#2,149 |
| 22. | Trent | 54.1% | 36.8%(+17.3)#22 | 35.2%(+18.9)#2,165 |
| 23. | Klamath Falls | 53.4% | 36.8%(+16.7)#23 | 35.2%(+18.3)#2,279 |
| 24. | Echo | 52.7% | 36.8%(+15.9)#24 | 35.2%(+17.5)#2,444 |
| 25. | Tumalo | 52.4% | 36.8%(+15.6)#25 | 35.2%(+17.2)#2,490 |
| 26. | Milton Freewater | 52.4% | 36.8%(+15.6)#26 | 35.2%(+17.2)#2,493 |
| 27. | Eugene | 52.2% | 36.8%(+15.4)#27 | 35.2%(+17.0)#2,560 |
| 28. | Wheeler | 51.6% | 36.8%(+14.8)#28 | 35.2%(+16.4)#2,675 |
| 29. | Glendale | 51.4% | 36.8%(+14.6)#29 | 35.2%(+16.2)#2,725 |
| 30. | Shedd | 50.9% | 36.8%(+14.1)#30 | 35.2%(+15.7)#2,871 |
| 31. | Madras | 50.6% | 36.8%(+13.8)#31 | 35.2%(+15.4)#2,941 |
| 32. | Beaverton | 49.7% | 36.8%(+13.0)#32 | 35.2%(+14.6)#3,188 |
| 33. | Fairview | 49.6% | 36.8%(+12.8)#33 | 35.2%(+14.4)#3,221 |
| 34. | Heppner | 49.5% | 36.8%(+12.7)#34 | 35.2%(+14.3)#3,239 |
| 35. | Hillsboro | 49.5% | 36.8%(+12.7)#35 | 35.2%(+14.3)#3,255 |
| 36. | Wilsonville | 49.4% | 36.8%(+12.6)#36 | 35.2%(+14.2)#3,278 |
| 37. | Alsea | 49.3% | 36.8%(+12.5)#37 | 35.2%(+14.1)#3,309 |
| 38. | West Haven Sylvan | 49.1% | 36.8%(+12.3)#38 | 35.2%(+13.9)#3,355 |
| 39. | Hayesville | 48.8% | 36.8%(+12.0)#39 | 35.2%(+13.6)#3,451 |
| 40. | Rainier | 48.8% | 36.8%(+12.0)#40 | 35.2%(+13.6)#3,456 |
| 41. | Toledo | 48.2% | 36.8%(+11.4)#41 | 35.2%(+13.0)#3,612 |
| 42. | Silver Lake | 48.2% | 36.8%(+11.4)#42 | 35.2%(+13.0)#3,616 |
| 43. | Astoria | 48.1% | 36.8%(+11.3)#43 | 35.2%(+12.9)#3,656 |
| 44. | Hood River | 47.7% | 36.8%(+10.9)#44 | 35.2%(+12.5)#3,786 |
| 45. | Ontario | 47.5% | 36.8%(+10.7)#45 | 35.2%(+12.3)#3,857 |
| 46. | Jordan Valley | 47.4% | 36.8%(+10.6)#46 | 35.2%(+12.2)#3,891 |
| 47. | Lebanon | 47.3% | 36.8%(+10.6)#47 | 35.2%(+12.2)#3,897 |
| 48. | Ashland | 47.2% | 36.8%(+10.4)#48 | 35.2%(+12.0)#3,968 |
| 49. | La Grande | 46.8% | 36.8%(+10.1)#49 | 35.2%(+11.7)#4,079 |
| 50. | Grass Valley | 46.7% | 36.8%(+9.95)#50 | 35.2%(+11.6)#4,108 |
| 51. | Boardman | 46.7% | 36.8%(+9.95)#51 | 35.2%(+11.6)#4,109 |
| 52. | Portland | 46.7% | 36.8%(+9.93)#52 | 35.2%(+11.5)#4,116 |
| 53. | Springfield | 46.0% | 36.8%(+9.26)#53 | 35.2%(+10.9)#4,324 |
| 54. | Willamina | 46.0% | 36.8%(+9.17)#54 | 35.2%(+10.8)#4,362 |
| 55. | Talent | 45.9% | 36.8%(+9.15)#55 | 35.2%(+10.8)#4,369 |
| 56. | Pendleton | 45.5% | 36.8%(+8.69)#56 | 35.2%(+10.3)#4,506 |
| 57. | Jennings Lodge | 45.5% | 36.8%(+8.69)#57 | 35.2%(+10.3)#4,508 |
| 58. | Warm Springs | 45.4% | 36.8%(+8.64)#58 | 35.2%(+10.2)#4,530 |
| 59. | Medford | 45.3% | 36.8%(+8.49)#59 | 35.2%(+10.1)#4,590 |
| 60. | Bunker Hill | 45.2% | 36.8%(+8.46)#60 | 35.2%(+10.1)#4,600 |
| 61. | Plush | 45.2% | 36.8%(+8.45)#61 | 35.2%(+10.1)#4,606 |
| 62. | Salem | 45.1% | 36.8%(+8.30)#62 | 35.2%(+9.90)#4,658 |
| 63. | Tualatin | 44.9% | 36.8%(+8.16)#63 | 35.2%(+9.76)#4,704 |
| 64. | Grants Pass | 44.9% | 36.8%(+8.07)#64 | 35.2%(+9.67)#4,743 |
| 65. | Mitchell | 44.8% | 36.8%(+8.04)#65 | 35.2%(+9.64)#4,752 |
| 66. | Roseburg | 44.8% | 36.8%(+8.03)#66 | 35.2%(+9.63)#4,756 |
| 67. | Gresham | 44.7% | 36.8%(+7.89)#67 | 35.2%(+9.49)#4,807 |
| 68. | Mount Angel | 44.3% | 36.8%(+7.53)#68 | 35.2%(+9.13)#4,946 |
| 69. | Myrtle Creek | 44.2% | 36.8%(+7.43)#69 | 35.2%(+9.03)#4,982 |
| 70. | Labish Village | 43.8% | 36.8%(+7.02)#70 | 35.2%(+8.62)#5,133 |
| 71. | Wimer | 43.7% | 36.8%(+6.90)#71 | 35.2%(+8.51)#5,183 |
| 72. | Raleigh Hills | 43.6% | 36.8%(+6.79)#72 | 35.2%(+8.39)#5,242 |
| 73. | Rogue River | 43.1% | 36.8%(+6.29)#73 | 35.2%(+7.89)#5,429 |
| 74. | La Pine | 43.0% | 36.8%(+6.25)#74 | 35.2%(+7.85)#5,448 |
| 75. | Bandon | 42.9% | 36.8%(+6.12)#75 | 35.2%(+7.72)#5,495 |
| 76. | Burns | 42.5% | 36.8%(+5.68)#76 | 35.2%(+7.28)#5,683 |
| 77. | Moro | 42.3% | 36.8%(+5.55)#77 | 35.2%(+7.15)#5,738 |
| 78. | Meacham | 42.3% | 36.8%(+5.52)#78 | 35.2%(+7.12)#5,753 |
| 79. | Halfway | 41.8% | 36.8%(+5.06)#79 | 35.2%(+6.66)#5,953 |
| 80. | Vale | 41.7% | 36.8%(+4.89)#80 | 35.2%(+6.50)#6,026 |
| 81. | Marion | 41.5% | 36.8%(+4.74)#81 | 35.2%(+6.34)#6,077 |
| 82. | Milwaukie | 41.4% | 36.8%(+4.63)#82 | 35.2%(+6.23)#6,133 |
| 83. | Cedar Hills | 41.4% | 36.8%(+4.58)#83 | 35.2%(+6.18)#6,165 |
| 84. | Crane | 41.2% | 36.8%(+4.39)#84 | 35.2%(+5.99)#6,236 |
| 85. | Jeffers Gardens | 40.9% | 36.8%(+4.12)#85 | 35.2%(+5.73)#6,352 |
| 86. | Antelope | 40.9% | 36.8%(+4.12)#86 | 35.2%(+5.73)#6,354 |
| 87. | North Bend | 40.9% | 36.8%(+4.08)#87 | 35.2%(+5.69)#6,373 |
| 88. | Junction City | 40.8% | 36.8%(+3.98)#88 | 35.2%(+5.58)#6,408 |
| 89. | Nyssa | 40.7% | 36.8%(+3.94)#89 | 35.2%(+5.54)#6,431 |
| 90. | Independence | 40.7% | 36.8%(+3.91)#90 | 35.2%(+5.51)#6,445 |
| 91. | Cottage Grove | 40.6% | 36.8%(+3.79)#91 | 35.2%(+5.39)#6,511 |
| 92. | Lincoln City | 40.1% | 36.8%(+3.32)#92 | 35.2%(+4.92)#6,738 |
| 93. | The Dalles | 40.0% | 36.8%(+3.19)#93 | 35.2%(+4.79)#6,816 |
| 94. | Merrill | 39.9% | 36.8%(+3.15)#94 | 35.2%(+4.75)#6,830 |
| 95. | Coos Bay | 39.9% | 36.8%(+3.12)#95 | 35.2%(+4.72)#6,840 |
| 96. | Silverton | 39.9% | 36.8%(+3.11)#96 | 35.2%(+4.71)#6,846 |
| 97. | West Slope | 39.8% | 36.8%(+3.05)#97 | 35.2%(+4.65)#6,882 |
| 98. | Albany | 39.8% | 36.8%(+3.03)#98 | 35.2%(+4.63)#6,891 |
| 99. | Sheridan | 39.0% | 36.8%(+2.24)#99 | 35.2%(+3.84)#7,263 |
| 100. | Hermiston | 38.8% | 36.8%(+1.99)#100 | 35.2%(+3.59)#7,380 |
Common Questions
What are the Top 10 Cities with the Highest Percentage of Renter-Occupied Units in Oregon?
Top 10 Cities with the Highest Percentage of Renter-Occupied Units in Oregon are:
#1
100.0%
#2
100.0%
#3
93.3%
#4
82.6%
#5
78.9%
#6
72.5%
#7
71.9%
#8
69.1%
#9
60.6%
#10
60.0%
What city has the Highest Percentage of Renter-Occupied Units in Oregon?
New Pine Creek has the Highest Percentage of Renter-Occupied Units in Oregon with 100.0%.
What is the Percentage of Renter-Occupied Units in the State of Oregon?
Percentage of Renter-Occupied Units in Oregon is 36.8%.
What is the Percentage of Renter-Occupied Units in the United States?
Percentage of Renter-Occupied Units in the United States is 35.2%.