Cities with the Highest Percentage of Renter-Occupied Units in Connecticut
RELATED REPORTS & OPTIONS
Highest Renter-Occupied
Connecticut
Compare Cities
Map of Cities with the Highest Percentage of Renter-Occupied Units in Connecticut
0.0%
100.0%
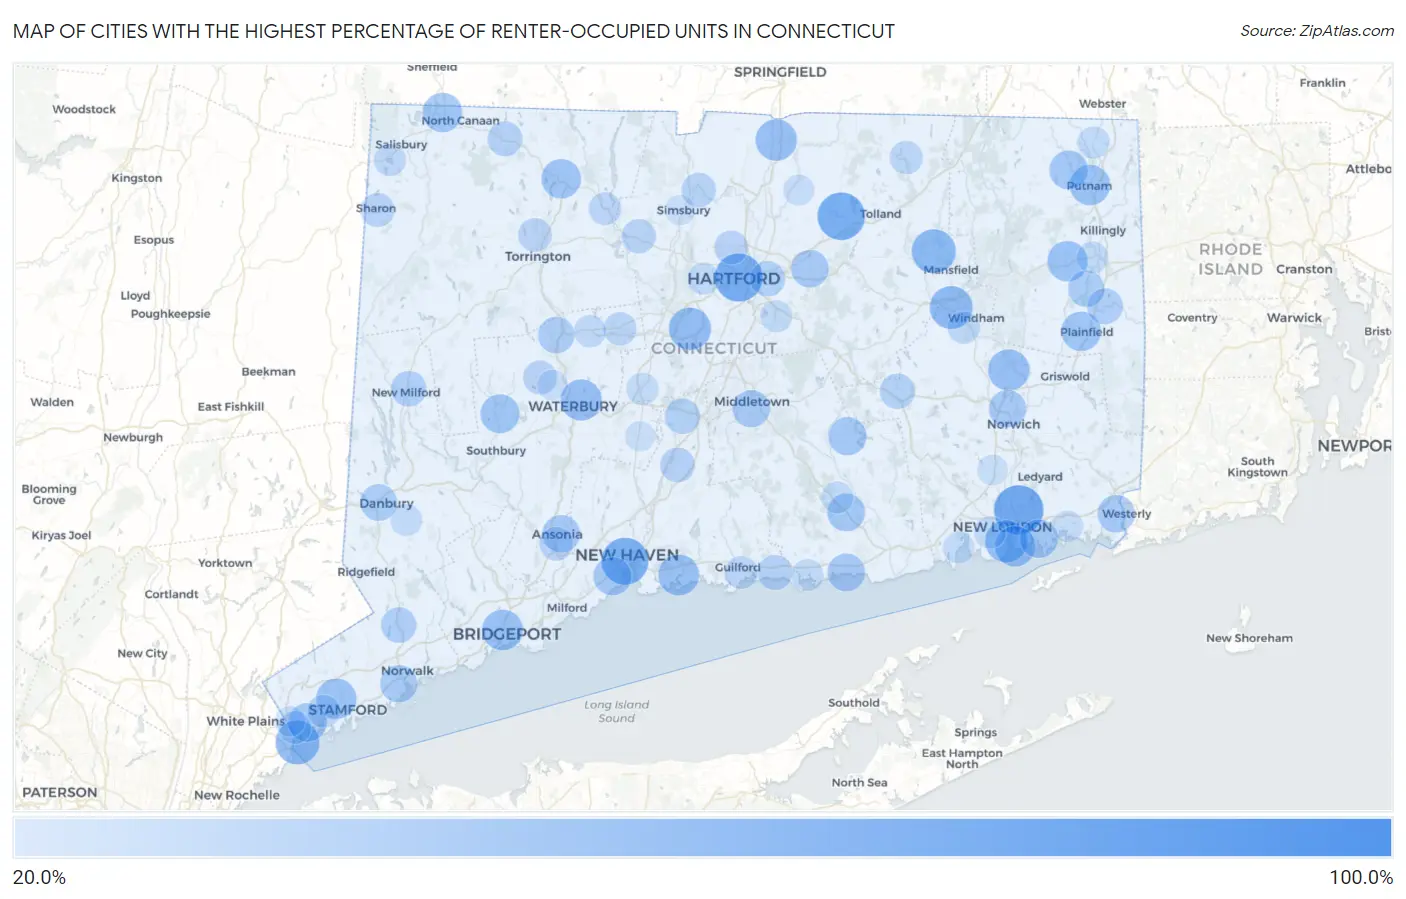
Cities with the Highest Percentage of Renter-Occupied Units in Connecticut
| City | % Renter-Occupied | vs State | vs National | |
| 1. | Fairfield University | 100.0% | 33.8%(+66.2)#1 | 35.2%(+64.8)#24 |
| 2. | Branchville | 82.3% | 33.8%(+48.4)#2 | 35.2%(+47.1)#406 |
| 3. | Conning Towers Nautilus Park | 78.6% | 33.8%(+44.7)#3 | 35.2%(+43.4)#473 |
| 4. | Hartford | 74.4% | 33.8%(+40.5)#4 | 35.2%(+39.2)#565 |
| 5. | Rockville | 73.1% | 33.8%(+39.2)#5 | 35.2%(+37.9)#596 |
| 6. | New Haven | 71.4% | 33.8%(+37.5)#6 | 35.2%(+36.2)#657 |
| 7. | Jewett City Borough | 64.4% | 33.8%(+30.6)#7 | 35.2%(+29.2)#994 |
| 8. | Storrs | 63.7% | 33.8%(+29.8)#8 | 35.2%(+28.5)#1,044 |
| 9. | Byram | 63.2% | 33.8%(+29.4)#9 | 35.2%(+28.0)#1,083 |
| 10. | Willimantic | 60.8% | 33.8%(+27.0)#10 | 35.2%(+25.6)#1,293 |
| 11. | Danielson Borough | 59.7% | 33.8%(+25.8)#11 | 35.2%(+24.5)#1,414 |
| 12. | New London | 58.9% | 33.8%(+25.1)#12 | 35.2%(+23.7)#1,494 |
| 13. | New Britain | 58.7% | 33.8%(+24.8)#13 | 35.2%(+23.5)#1,518 |
| 14. | Bantam Borough | 57.2% | 33.8%(+23.4)#14 | 35.2%(+22.0)#1,701 |
| 15. | Thompsonville | 56.4% | 33.8%(+22.6)#15 | 35.2%(+21.2)#1,805 |
| 16. | Baltic | 56.2% | 33.8%(+22.3)#16 | 35.2%(+21.0)#1,842 |
| 17. | Mechanicsville | 56.2% | 33.8%(+22.3)#17 | 35.2%(+21.0)#1,849 |
| 18. | Waterbury | 56.2% | 33.8%(+22.3)#18 | 35.2%(+21.0)#1,851 |
| 19. | Branford Center | 55.1% | 33.8%(+21.2)#19 | 35.2%(+19.9)#2,024 |
| 20. | Bridgeport | 54.8% | 33.8%(+20.9)#20 | 35.2%(+19.6)#2,070 |
| 21. | Groton | 54.7% | 33.8%(+20.9)#21 | 35.2%(+19.5)#2,074 |
| 22. | Sherman | 54.5% | 33.8%(+20.7)#22 | 35.2%(+19.4)#2,109 |
| 23. | Stamford | 54.0% | 33.8%(+20.1)#23 | 35.2%(+18.8)#2,187 |
| 24. | Brooklyn | 53.7% | 33.8%(+19.8)#24 | 35.2%(+18.5)#2,235 |
| 25. | Putnam | 53.7% | 33.8%(+19.8)#25 | 35.2%(+18.5)#2,237 |
| 26. | Dayville | 53.1% | 33.8%(+19.3)#26 | 35.2%(+17.9)#2,351 |
| 27. | Hawleyville | 52.6% | 33.8%(+18.8)#27 | 35.2%(+17.4)#2,452 |
| 28. | Winsted | 51.5% | 33.8%(+17.7)#28 | 35.2%(+16.4)#2,691 |
| 29. | Canaan | 51.4% | 33.8%(+17.6)#29 | 35.2%(+16.2)#2,724 |
| 30. | Plainfield Village | 51.3% | 33.8%(+17.5)#30 | 35.2%(+16.1)#2,744 |
| 31. | Woodbury Center | 50.1% | 33.8%(+16.2)#31 | 35.2%(+14.9)#3,068 |
| 32. | West Cornwall | 50.0% | 33.8%(+16.2)#32 | 35.2%(+14.8)#3,125 |
| 33. | Greenwich | 49.2% | 33.8%(+15.3)#33 | 35.2%(+14.0)#3,324 |
| 34. | South Woodstock | 49.1% | 33.8%(+15.3)#34 | 35.2%(+14.0)#3,335 |
| 35. | Poquonock Bridge | 48.5% | 33.8%(+14.7)#35 | 35.2%(+13.3)#3,528 |
| 36. | West Haven | 47.9% | 33.8%(+14.1)#36 | 35.2%(+12.7)#3,702 |
| 37. | Moodus | 47.6% | 33.8%(+13.8)#37 | 35.2%(+12.5)#3,798 |
| 38. | Stonington Borough | 47.1% | 33.8%(+13.2)#38 | 35.2%(+11.9)#3,998 |
| 39. | Deep River Center | 46.9% | 33.8%(+13.1)#39 | 35.2%(+11.7)#4,051 |
| 40. | Westbrook Center | 46.8% | 33.8%(+12.9)#40 | 35.2%(+11.6)#4,097 |
| 41. | Manchester | 46.2% | 33.8%(+12.4)#41 | 35.2%(+11.0)#4,258 |
| 42. | Ansonia | 46.1% | 33.8%(+12.2)#42 | 35.2%(+10.9)#4,300 |
| 43. | Pawcatuck | 46.1% | 33.8%(+12.2)#43 | 35.2%(+10.9)#4,317 |
| 44. | Middletown | 45.9% | 33.8%(+12.0)#44 | 35.2%(+10.7)#4,391 |
| 45. | Norwich | 45.7% | 33.8%(+11.8)#45 | 35.2%(+10.5)#4,460 |
| 46. | Norwalk | 45.2% | 33.8%(+11.3)#46 | 35.2%(+9.97)#4,636 |
| 47. | Danbury | 44.1% | 33.8%(+10.2)#47 | 35.2%(+8.90)#5,021 |
| 48. | Thomaston | 43.5% | 33.8%(+9.68)#48 | 35.2%(+8.35)#5,264 |
| 49. | Wauregan | 43.2% | 33.8%(+9.37)#49 | 35.2%(+8.03)#5,374 |
| 50. | Route 7 Gateway | 42.5% | 33.8%(+8.69)#50 | 35.2%(+7.36)#5,657 |
| 51. | Moosup | 41.7% | 33.8%(+7.84)#51 | 35.2%(+6.50)#6,021 |
| 52. | Wilton Center | 40.9% | 33.8%(+7.04)#52 | 35.2%(+5.70)#6,360 |
| 53. | Pleasant Valley | 40.8% | 33.8%(+6.93)#53 | 35.2%(+5.59)#6,401 |
| 54. | New Milford | 40.7% | 33.8%(+6.82)#54 | 35.2%(+5.48)#6,462 |
| 55. | Meriden | 40.5% | 33.8%(+6.68)#55 | 35.2%(+5.35)#6,532 |
| 56. | East Hartford | 40.5% | 33.8%(+6.67)#56 | 35.2%(+5.33)#6,545 |
| 57. | Colchester | 40.1% | 33.8%(+6.26)#57 | 35.2%(+4.93)#6,737 |
| 58. | Madison Center | 39.3% | 33.8%(+5.47)#58 | 35.2%(+4.14)#7,127 |
| 59. | Norfolk | 39.2% | 33.8%(+5.32)#59 | 35.2%(+3.99)#7,192 |
| 60. | Wallingford Center | 38.7% | 33.8%(+4.85)#60 | 35.2%(+3.51)#7,412 |
| 61. | Tariffville | 37.9% | 33.8%(+4.06)#61 | 35.2%(+2.73)#7,776 |
| 62. | Canton Valley | 37.8% | 33.8%(+3.91)#62 | 35.2%(+2.58)#7,863 |
| 63. | Lake Chaffee | 37.1% | 33.8%(+3.29)#63 | 35.2%(+1.96)#8,197 |
| 64. | Sharon | 36.6% | 33.8%(+2.73)#64 | 35.2%(+1.39)#8,510 |
| 65. | Blue Hills | 36.5% | 33.8%(+2.68)#65 | 35.2%(+1.34)#8,546 |
| 66. | Watertown | 36.4% | 33.8%(+2.59)#66 | 35.2%(+1.26)#8,591 |
| 67. | Derby | 36.2% | 33.8%(+2.35)#67 | 35.2%(+1.01)#8,721 |
| 68. | Torrington | 36.0% | 33.8%(+2.15)#68 | 35.2%(+0.815)#8,854 |
| 69. | Bristol | 35.0% | 33.8%(+1.11)#69 | 35.2%(-0.223)#9,402 |
| 70. | Stafford Springs | 34.9% | 33.8%(+1.02)#70 | 35.2%(-0.310)#9,450 |
| 71. | Cornwall Bridge | 34.5% | 33.8%(+0.696)#71 | 35.2%(-0.638)#9,643 |
| 72. | New Canaan | 34.4% | 33.8%(+0.510)#72 | 35.2%(-0.824)#9,734 |
| 73. | Naugatuck Borough | 34.0% | 33.8%(+0.188)#73 | 35.2%(-1.15)#9,915 |
| 74. | Cos Cob | 34.0% | 33.8%(+0.110)#74 | 35.2%(-1.22)#9,958 |
| 75. | Guilford Center | 33.9% | 33.8%(+0.074)#75 | 35.2%(-1.26)#9,977 |
| 76. | Pemberwick | 33.5% | 33.8%(-0.311)#76 | 35.2%(-1.64)#10,176 |
| 77. | New Hartford Center | 33.4% | 33.8%(-0.405)#77 | 35.2%(-1.74)#10,219 |
| 78. | South Windham | 32.6% | 33.8%(-1.22)#78 | 35.2%(-2.56)#10,760 |
| 79. | Terryville | 32.2% | 33.8%(-1.65)#79 | 35.2%(-2.99)#11,022 |
| 80. | Lakeville | 32.2% | 33.8%(-1.70)#80 | 35.2%(-3.03)#11,051 |
| 81. | Plantsville | 32.0% | 33.8%(-1.89)#81 | 35.2%(-3.22)#11,157 |
| 82. | North Grosvenor Dale | 31.8% | 33.8%(-2.06)#82 | 35.2%(-3.39)#11,259 |
| 83. | Bogus Hill | 31.7% | 33.8%(-2.14)#83 | 35.2%(-3.48)#11,305 |
| 84. | Glastonbury Center | 31.5% | 33.8%(-2.36)#84 | 35.2%(-3.70)#11,441 |
| 85. | Waterford | 31.4% | 33.8%(-2.43)#85 | 35.2%(-3.77)#11,481 |
| 86. | West Hartford | 31.4% | 33.8%(-2.45)#86 | 35.2%(-3.79)#11,490 |
| 87. | Bethel | 31.3% | 33.8%(-2.52)#87 | 35.2%(-3.85)#11,519 |
| 88. | Chester Center | 31.3% | 33.8%(-2.55)#88 | 35.2%(-3.88)#11,541 |
| 89. | East Brooklyn | 31.3% | 33.8%(-2.59)#89 | 35.2%(-3.93)#11,565 |
| 90. | Clinton | 31.2% | 33.8%(-2.63)#90 | 35.2%(-3.96)#11,589 |
| 91. | Niantic | 30.5% | 33.8%(-3.30)#91 | 35.2%(-4.64)#12,022 |
| 92. | Mystic | 29.5% | 33.8%(-4.31)#92 | 35.2%(-5.64)#12,669 |
| 93. | Stratford Downtown | 29.5% | 33.8%(-4.35)#93 | 35.2%(-5.68)#12,697 |
| 94. | Broad Brook | 28.8% | 33.8%(-5.06)#94 | 35.2%(-6.39)#13,199 |
| 95. | Oxoboxo River | 28.3% | 33.8%(-5.59)#95 | 35.2%(-6.92)#13,550 |
| 96. | Glenville | 27.9% | 33.8%(-5.93)#96 | 35.2%(-7.26)#13,774 |
| 97. | Oakville | 27.5% | 33.8%(-6.33)#97 | 35.2%(-7.67)#14,051 |
| 98. | Simsbury Center | 27.0% | 33.8%(-6.81)#98 | 35.2%(-8.14)#14,376 |
| 99. | Cheshire Village | 27.0% | 33.8%(-6.86)#99 | 35.2%(-8.19)#14,418 |
| 100. | South Wilton | 26.6% | 33.8%(-7.27)#100 | 35.2%(-8.61)#14,702 |
Common Questions
What are the Top 10 Cities with the Highest Percentage of Renter-Occupied Units in Connecticut?
Top 10 Cities with the Highest Percentage of Renter-Occupied Units in Connecticut are:
#1
78.6%
#2
74.4%
#3
73.1%
#4
71.4%
#5
63.7%
#6
63.2%
#7
60.8%
#8
58.9%
#9
58.7%
#10
56.4%
What city has the Highest Percentage of Renter-Occupied Units in Connecticut?
Conning Towers Nautilus Park has the Highest Percentage of Renter-Occupied Units in Connecticut with 78.6%.
What is the Percentage of Renter-Occupied Units in the State of Connecticut?
Percentage of Renter-Occupied Units in Connecticut is 33.8%.
What is the Percentage of Renter-Occupied Units in the United States?
Percentage of Renter-Occupied Units in the United States is 35.2%.