Cities with the Highest Percentage of Renter-Occupied Units in South Carolina
RELATED REPORTS & OPTIONS
Highest Renter-Occupied
South Carolina
Compare Cities
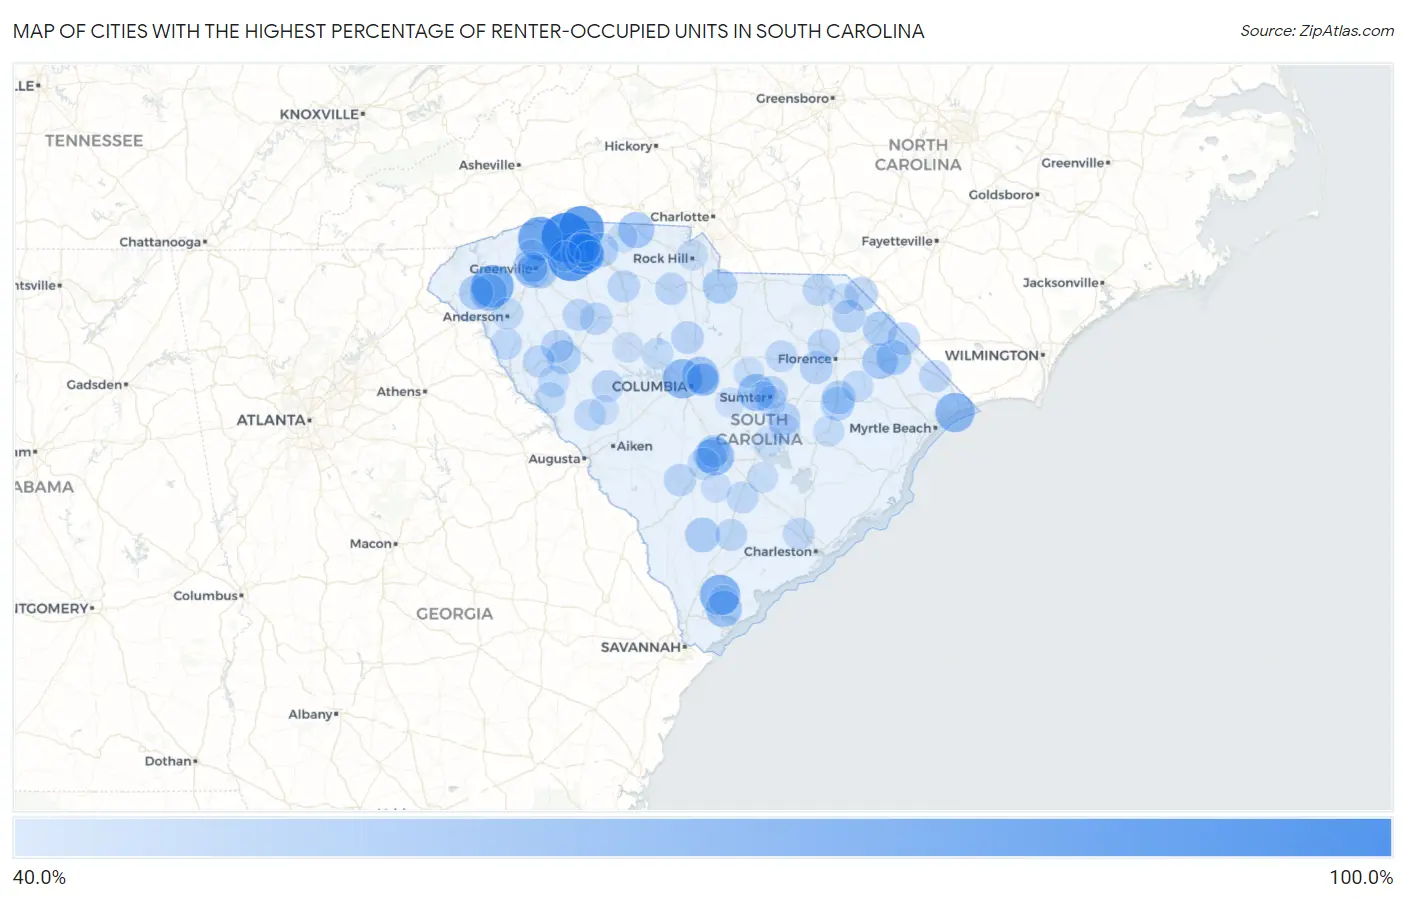
Map of Cities with the Highest Percentage of Renter-Occupied Units in South Carolina
0.0%
100.0%
Cities with the Highest Percentage of Renter-Occupied Units in South Carolina
| City | % Renter-Occupied | vs State | vs National | |
| 1. | Clemson University | 100.0% | 29.1%(+70.9)#1 | 35.2%(+64.8)#10 |
| 2. | Gramling | 100.0% | 29.1%(+70.9)#2 | 35.2%(+64.8)#130 |
| 3. | Startex | 94.1% | 29.1%(+65.0)#3 | 35.2%(+58.9)#295 |
| 4. | Fingerville | 88.8% | 29.1%(+59.7)#4 | 35.2%(+53.6)#341 |
| 5. | Tigerville | 83.9% | 29.1%(+54.8)#5 | 35.2%(+48.7)#382 |
| 6. | Olympia | 80.7% | 29.1%(+51.6)#6 | 35.2%(+45.5)#430 |
| 7. | Central | 79.9% | 29.1%(+50.8)#7 | 35.2%(+44.7)#450 |
| 8. | Arcadia | 79.1% | 29.1%(+50.0)#8 | 35.2%(+43.9)#464 |
| 9. | Arthurtown | 78.1% | 29.1%(+49.0)#9 | 35.2%(+42.9)#482 |
| 10. | Laurel Bay | 74.4% | 29.1%(+45.3)#10 | 35.2%(+39.2)#563 |
| 11. | Atlantic Beach | 71.4% | 29.1%(+42.3)#11 | 35.2%(+36.2)#650 |
| 12. | St Andrews | 71.3% | 29.1%(+42.2)#12 | 35.2%(+36.1)#658 |
| 13. | Wilkinson Heights | 68.1% | 29.1%(+39.0)#13 | 35.2%(+32.9)#799 |
| 14. | La France | 67.8% | 29.1%(+38.7)#14 | 35.2%(+32.6)#808 |
| 15. | Rains | 67.1% | 29.1%(+38.0)#15 | 35.2%(+31.9)#845 |
| 16. | Little Rock | 64.9% | 29.1%(+35.8)#16 | 35.2%(+29.7)#957 |
| 17. | Cherryvale | 64.5% | 29.1%(+35.4)#17 | 35.2%(+29.3)#986 |
| 18. | Clemson | 64.3% | 29.1%(+35.2)#18 | 35.2%(+29.1)#1,003 |
| 19. | Dentsville | 63.6% | 29.1%(+34.5)#19 | 35.2%(+28.4)#1,056 |
| 20. | Saxon | 63.5% | 29.1%(+34.4)#20 | 35.2%(+28.3)#1,062 |
| 21. | Port Royal | 63.4% | 29.1%(+34.3)#21 | 35.2%(+28.2)#1,076 |
| 22. | Blacksburg | 62.5% | 29.1%(+33.4)#22 | 35.2%(+27.3)#1,145 |
| 23. | Marion | 60.6% | 29.1%(+31.5)#23 | 35.2%(+25.4)#1,315 |
| 24. | Mullins | 59.1% | 29.1%(+30.0)#24 | 35.2%(+23.9)#1,474 |
| 25. | Lancaster | 58.7% | 29.1%(+29.6)#25 | 35.2%(+23.5)#1,514 |
| 26. | Islandton | 58.6% | 29.1%(+29.5)#26 | 35.2%(+23.4)#1,521 |
| 27. | Greenville | 58.4% | 29.1%(+29.3)#27 | 35.2%(+23.2)#1,545 |
| 28. | Utica | 57.8% | 29.1%(+28.7)#28 | 35.2%(+22.6)#1,619 |
| 29. | Parker | 57.6% | 29.1%(+28.5)#29 | 35.2%(+22.4)#1,660 |
| 30. | Dillon | 57.5% | 29.1%(+28.4)#30 | 35.2%(+22.3)#1,664 |
| 31. | Hilltop | 57.0% | 29.1%(+27.9)#31 | 35.2%(+21.8)#1,726 |
| 32. | Clifton | 56.8% | 29.1%(+27.7)#32 | 35.2%(+21.6)#1,754 |
| 33. | Capitol View | 56.6% | 29.1%(+27.5)#33 | 35.2%(+21.4)#1,783 |
| 34. | Conestee | 56.5% | 29.1%(+27.5)#34 | 35.2%(+21.4)#1,787 |
| 35. | Finklea | 56.2% | 29.1%(+27.1)#35 | 35.2%(+21.0)#1,843 |
| 36. | Judson | 55.7% | 29.1%(+26.6)#36 | 35.2%(+20.5)#1,914 |
| 37. | Lake City | 55.6% | 29.1%(+26.6)#37 | 35.2%(+20.5)#1,916 |
| 38. | Greenwood | 55.6% | 29.1%(+26.6)#38 | 35.2%(+20.5)#1,918 |
| 39. | Hamer | 55.6% | 29.1%(+26.5)#39 | 35.2%(+20.4)#1,932 |
| 40. | Scranton | 55.5% | 29.1%(+26.4)#40 | 35.2%(+20.3)#1,958 |
| 41. | Southern Shops | 55.4% | 29.1%(+26.3)#41 | 35.2%(+20.2)#1,971 |
| 42. | Mccoll | 55.2% | 29.1%(+26.1)#42 | 35.2%(+20.0)#2,003 |
| 43. | Orangeburg | 54.6% | 29.1%(+25.5)#43 | 35.2%(+19.4)#2,090 |
| 44. | Daviston | 54.6% | 29.1%(+25.5)#44 | 35.2%(+19.4)#2,093 |
| 45. | Alcolu | 54.5% | 29.1%(+25.5)#45 | 35.2%(+19.4)#2,104 |
| 46. | Timmonsville | 53.9% | 29.1%(+24.8)#46 | 35.2%(+18.7)#2,199 |
| 47. | Mulberry | 53.8% | 29.1%(+24.8)#47 | 35.2%(+18.7)#2,211 |
| 48. | Lake View | 53.5% | 29.1%(+24.5)#48 | 35.2%(+18.4)#2,263 |
| 49. | Winnsboro Mills | 53.3% | 29.1%(+24.2)#49 | 35.2%(+18.1)#2,304 |
| 50. | Blenheim | 53.3% | 29.1%(+24.2)#50 | 35.2%(+18.1)#2,308 |
| 51. | Woodfield | 53.1% | 29.1%(+24.0)#51 | 35.2%(+17.9)#2,362 |
| 52. | Drayton | 53.0% | 29.1%(+24.0)#52 | 35.2%(+17.9)#2,371 |
| 53. | Columbia | 53.0% | 29.1%(+23.9)#53 | 35.2%(+17.8)#2,383 |
| 54. | Cokesbury | 52.8% | 29.1%(+23.7)#54 | 35.2%(+17.6)#2,420 |
| 55. | Brookdale | 52.6% | 29.1%(+23.5)#55 | 35.2%(+17.4)#2,461 |
| 56. | Denmark | 52.3% | 29.1%(+23.2)#56 | 35.2%(+17.1)#2,529 |
| 57. | Clinton | 52.2% | 29.1%(+23.1)#57 | 35.2%(+17.0)#2,543 |
| 58. | Union | 52.1% | 29.1%(+23.0)#58 | 35.2%(+16.9)#2,568 |
| 59. | Valley Falls | 52.0% | 29.1%(+22.9)#59 | 35.2%(+16.8)#2,600 |
| 60. | Chester | 52.0% | 29.1%(+22.9)#60 | 35.2%(+16.8)#2,602 |
| 61. | Walterboro | 51.8% | 29.1%(+22.7)#61 | 35.2%(+16.6)#2,631 |
| 62. | Loris | 51.8% | 29.1%(+22.7)#62 | 35.2%(+16.6)#2,638 |
| 63. | Darlington | 51.5% | 29.1%(+22.4)#63 | 35.2%(+16.3)#2,711 |
| 64. | Saluda | 51.4% | 29.1%(+22.3)#64 | 35.2%(+16.2)#2,732 |
| 65. | Ben Avon | 51.4% | 29.1%(+22.3)#65 | 35.2%(+16.2)#2,734 |
| 66. | Abbeville | 51.3% | 29.1%(+22.2)#66 | 35.2%(+16.1)#2,751 |
| 67. | Laurens | 51.2% | 29.1%(+22.1)#67 | 35.2%(+16.0)#2,780 |
| 68. | Cheraw | 51.1% | 29.1%(+22.0)#68 | 35.2%(+15.9)#2,826 |
| 69. | Centenary | 51.0% | 29.1%(+22.0)#69 | 35.2%(+15.9)#2,835 |
| 70. | Cordova | 50.9% | 29.1%(+21.8)#70 | 35.2%(+15.7)#2,870 |
| 71. | St George | 50.8% | 29.1%(+21.8)#71 | 35.2%(+15.7)#2,889 |
| 72. | Iva | 50.8% | 29.1%(+21.7)#72 | 35.2%(+15.6)#2,907 |
| 73. | Bishopville | 50.6% | 29.1%(+21.5)#73 | 35.2%(+15.4)#2,943 |
| 74. | North Charleston | 50.6% | 29.1%(+21.5)#74 | 35.2%(+15.4)#2,950 |
| 75. | Edgefield | 50.3% | 29.1%(+21.2)#75 | 35.2%(+15.1)#3,023 |
| 76. | Bradley | 50.0% | 29.1%(+20.9)#76 | 35.2%(+14.8)#3,109 |
| 77. | Peak | 50.0% | 29.1%(+20.9)#77 | 35.2%(+14.8)#3,119 |
| 78. | Anderson | 50.0% | 29.1%(+20.9)#78 | 35.2%(+14.8)#3,156 |
| 79. | Pamplico | 49.4% | 29.1%(+20.3)#79 | 35.2%(+14.2)#3,280 |
| 80. | Mccormick | 49.2% | 29.1%(+20.1)#80 | 35.2%(+14.0)#3,318 |
| 81. | Kingstree | 48.7% | 29.1%(+19.6)#81 | 35.2%(+13.5)#3,482 |
| 82. | Rock Hill | 48.2% | 29.1%(+19.1)#82 | 35.2%(+13.0)#3,607 |
| 83. | Holly Hill | 48.2% | 29.1%(+19.1)#83 | 35.2%(+13.0)#3,627 |
| 84. | Camp Croft | 48.0% | 29.1%(+18.9)#84 | 35.2%(+12.8)#3,670 |
| 85. | Travelers Rest | 48.0% | 29.1%(+18.9)#85 | 35.2%(+12.8)#3,672 |
| 86. | Rembert | 48.0% | 29.1%(+18.9)#86 | 35.2%(+12.8)#3,676 |
| 87. | Summerton | 47.8% | 29.1%(+18.7)#87 | 35.2%(+12.6)#3,744 |
| 88. | Branchville | 47.3% | 29.1%(+18.2)#88 | 35.2%(+12.1)#3,919 |
| 89. | South Sumter | 47.2% | 29.1%(+18.1)#89 | 35.2%(+12.0)#3,943 |
| 90. | Manning | 47.1% | 29.1%(+18.0)#90 | 35.2%(+11.9)#3,984 |
| 91. | Spartanburg | 47.0% | 29.1%(+18.0)#91 | 35.2%(+11.9)#4,012 |
| 92. | Gaffney | 47.0% | 29.1%(+17.9)#92 | 35.2%(+11.8)#4,026 |
| 93. | Newberry | 46.9% | 29.1%(+17.8)#93 | 35.2%(+11.7)#4,061 |
| 94. | Bennettsville | 46.7% | 29.1%(+17.6)#94 | 35.2%(+11.5)#4,117 |
| 95. | Duncan | 46.4% | 29.1%(+17.4)#95 | 35.2%(+11.3)#4,190 |
| 96. | City View | 46.4% | 29.1%(+17.3)#96 | 35.2%(+11.2)#4,207 |
| 97. | Eastover | 46.3% | 29.1%(+17.2)#97 | 35.2%(+11.1)#4,247 |
| 98. | Johnston | 46.1% | 29.1%(+17.0)#98 | 35.2%(+10.9)#4,296 |
| 99. | Burton | 46.1% | 29.1%(+17.0)#99 | 35.2%(+10.9)#4,305 |
| 100. | Sumter | 46.0% | 29.1%(+16.9)#100 | 35.2%(+10.8)#4,341 |
Common Questions
What are the Top 10 Cities with the Highest Percentage of Renter-Occupied Units in South Carolina?
Top 10 Cities with the Highest Percentage of Renter-Occupied Units in South Carolina are:
#1
100.0%
#2
94.1%
#3
88.8%
#4
83.9%
#5
79.9%
#6
79.1%
#7
74.4%
#8
71.4%
#9
71.3%
#10
68.1%
What city has the Highest Percentage of Renter-Occupied Units in South Carolina?
Gramling has the Highest Percentage of Renter-Occupied Units in South Carolina with 100.0%.
What is the Percentage of Renter-Occupied Units in the State of South Carolina?
Percentage of Renter-Occupied Units in South Carolina is 29.1%.
What is the Percentage of Renter-Occupied Units in the United States?
Percentage of Renter-Occupied Units in the United States is 35.2%.