Cities with the Highest Percentage of Renter-Occupied Units in Massachusetts
RELATED REPORTS & OPTIONS
Highest Renter-Occupied
Massachusetts
Compare Cities
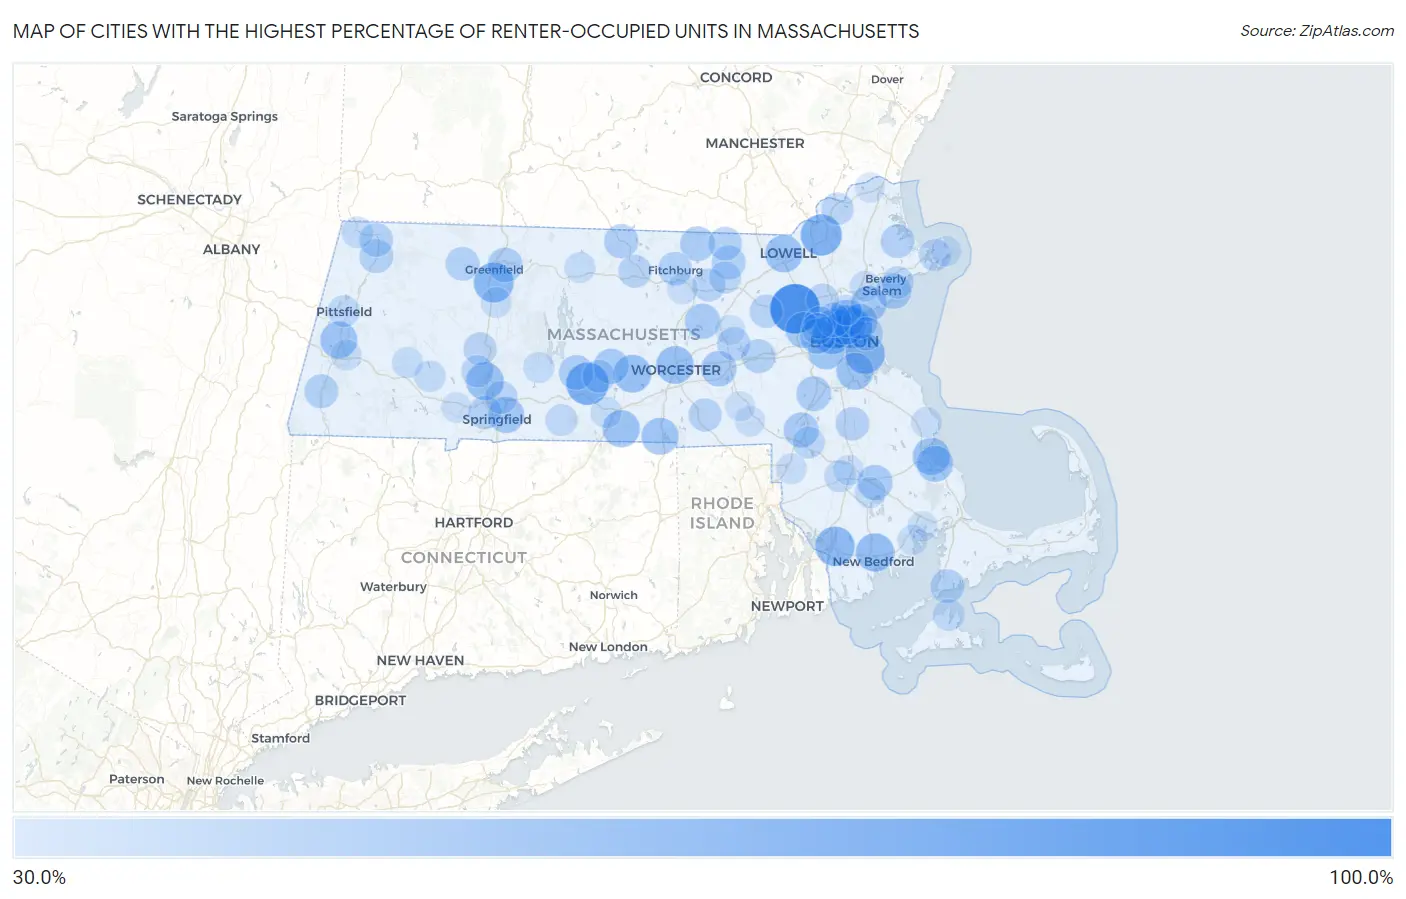
Map of Cities with the Highest Percentage of Renter-Occupied Units in Massachusetts
0.0%
100.0%
Cities with the Highest Percentage of Renter-Occupied Units in Massachusetts
| City | % Renter-Occupied | vs State | vs National | |
| 1. | Hanscom Afb | 100.0% | 37.6%(+62.4)#1 | 35.2%(+64.8)#44 |
| 2. | Warren | 74.5% | 37.6%(+36.9)#2 | 35.2%(+39.3)#561 |
| 3. | Chelsea | 72.1% | 37.6%(+34.5)#3 | 35.2%(+36.9)#632 |
| 4. | Lawrence | 70.1% | 37.6%(+32.6)#4 | 35.2%(+34.9)#701 |
| 5. | Cambridge | 66.4% | 37.6%(+28.9)#5 | 35.2%(+31.3)#883 |
| 6. | Somerville | 66.4% | 37.6%(+28.8)#6 | 35.2%(+31.2)#886 |
| 7. | Deerfield | 66.2% | 37.6%(+28.6)#7 | 35.2%(+31.0)#893 |
| 8. | Boston | 65.2% | 37.6%(+27.6)#8 | 35.2%(+30.0)#942 |
| 9. | Everett | 64.2% | 37.6%(+26.6)#9 | 35.2%(+29.0)#1,011 |
| 10. | Fall River | 64.1% | 37.6%(+26.5)#10 | 35.2%(+28.9)#1,020 |
| 11. | New Bedford | 60.1% | 37.6%(+22.5)#11 | 35.2%(+24.9)#1,355 |
| 12. | Holyoke | 58.5% | 37.6%(+20.9)#12 | 35.2%(+23.3)#1,535 |
| 13. | Worcester | 57.9% | 37.6%(+20.3)#13 | 35.2%(+22.7)#1,604 |
| 14. | Spencer | 57.8% | 37.6%(+20.2)#14 | 35.2%(+22.6)#1,623 |
| 15. | Malden | 57.4% | 37.6%(+19.8)#15 | 35.2%(+22.2)#1,682 |
| 16. | Lowell | 56.7% | 37.6%(+19.1)#16 | 35.2%(+21.5)#1,773 |
| 17. | North Plymouth | 56.3% | 37.6%(+18.7)#17 | 35.2%(+21.1)#1,823 |
| 18. | Southbridge Town | 56.2% | 37.6%(+18.6)#18 | 35.2%(+21.0)#1,846 |
| 19. | Quincy | 56.1% | 37.6%(+18.5)#19 | 35.2%(+20.9)#1,857 |
| 20. | Lenox | 56.0% | 37.6%(+18.4)#20 | 35.2%(+20.8)#1,867 |
| 21. | Webster | 55.2% | 37.6%(+17.7)#21 | 35.2%(+20.1)#1,989 |
| 22. | Amherst | 54.1% | 37.6%(+16.6)#22 | 35.2%(+19.0)#2,163 |
| 23. | Brookline | 53.6% | 37.6%(+16.1)#23 | 35.2%(+18.5)#2,242 |
| 24. | Plymouth | 53.1% | 37.6%(+15.6)#24 | 35.2%(+17.9)#2,349 |
| 25. | Springfield | 52.2% | 37.6%(+14.6)#25 | 35.2%(+17.0)#2,551 |
| 26. | Waltham | 52.1% | 37.6%(+14.5)#26 | 35.2%(+16.9)#2,576 |
| 27. | West Warren | 52.0% | 37.6%(+14.5)#27 | 35.2%(+16.9)#2,585 |
| 28. | Lynn | 51.4% | 37.6%(+13.9)#28 | 35.2%(+16.3)#2,717 |
| 29. | Westborough | 49.9% | 37.6%(+12.3)#29 | 35.2%(+14.7)#3,164 |
| 30. | North Brookfield | 49.4% | 37.6%(+11.9)#30 | 35.2%(+14.3)#3,262 |
| 31. | Salem | 49.3% | 37.6%(+11.8)#31 | 35.2%(+14.1)#3,291 |
| 32. | Middleborough Center | 49.2% | 37.6%(+11.6)#32 | 35.2%(+14.0)#3,322 |
| 33. | Clinton | 49.1% | 37.6%(+11.5)#33 | 35.2%(+13.9)#3,351 |
| 34. | Revere | 49.0% | 37.6%(+11.5)#34 | 35.2%(+13.8)#3,368 |
| 35. | Foxborough | 48.9% | 37.6%(+11.4)#35 | 35.2%(+13.8)#3,394 |
| 36. | Watertown Town | 48.7% | 37.6%(+11.2)#36 | 35.2%(+13.5)#3,463 |
| 37. | Norwood | 48.6% | 37.6%(+11.0)#37 | 35.2%(+13.4)#3,510 |
| 38. | Ware | 47.9% | 37.6%(+10.3)#38 | 35.2%(+12.7)#3,721 |
| 39. | Townsend | 47.8% | 37.6%(+10.3)#39 | 35.2%(+12.7)#3,730 |
| 40. | Turners Falls | 47.8% | 37.6%(+10.3)#40 | 35.2%(+12.6)#3,735 |
| 41. | Medford | 46.7% | 37.6%(+9.12)#41 | 35.2%(+11.5)#4,120 |
| 42. | Winchendon | 46.2% | 37.6%(+8.67)#42 | 35.2%(+11.0)#4,253 |
| 43. | Great Barrington | 45.1% | 37.6%(+7.49)#43 | 35.2%(+9.87)#4,671 |
| 44. | Adams | 45.0% | 37.6%(+7.46)#44 | 35.2%(+9.84)#4,677 |
| 45. | Framingham | 44.9% | 37.6%(+7.35)#45 | 35.2%(+9.74)#4,715 |
| 46. | Groton | 44.9% | 37.6%(+7.32)#46 | 35.2%(+9.70)#4,731 |
| 47. | Falmouth | 44.8% | 37.6%(+7.27)#47 | 35.2%(+9.65)#4,749 |
| 48. | Greenfield | 44.8% | 37.6%(+7.21)#48 | 35.2%(+9.59)#4,771 |
| 49. | Pepperell | 44.7% | 37.6%(+7.13)#49 | 35.2%(+9.52)#4,797 |
| 50. | Shelburne Falls | 44.6% | 37.6%(+7.00)#50 | 35.2%(+9.38)#4,845 |
| 51. | Fitchburg | 44.3% | 37.6%(+6.74)#51 | 35.2%(+9.12)#4,950 |
| 52. | North Adams | 44.1% | 37.6%(+6.55)#52 | 35.2%(+8.94)#5,013 |
| 53. | Ipswich | 43.9% | 37.6%(+6.33)#53 | 35.2%(+8.71)#5,099 |
| 54. | Brockton | 43.6% | 37.6%(+6.03)#54 | 35.2%(+8.41)#5,230 |
| 55. | West Springfield Town | 43.2% | 37.6%(+5.65)#55 | 35.2%(+8.03)#5,375 |
| 56. | Winthrop Town | 43.1% | 37.6%(+5.58)#56 | 35.2%(+7.96)#5,397 |
| 57. | West Concord | 42.7% | 37.6%(+5.12)#57 | 35.2%(+7.50)#5,592 |
| 58. | Marlborough | 42.7% | 37.6%(+5.09)#58 | 35.2%(+7.47)#5,613 |
| 59. | Whitinsville | 42.4% | 37.6%(+4.87)#59 | 35.2%(+7.25)#5,700 |
| 60. | Shirley | 42.4% | 37.6%(+4.86)#60 | 35.2%(+7.24)#5,707 |
| 61. | Gardner | 42.3% | 37.6%(+4.77)#61 | 35.2%(+7.15)#5,739 |
| 62. | Northampton | 41.6% | 37.6%(+4.07)#62 | 35.2%(+6.45)#6,043 |
| 63. | West Brookfield | 41.3% | 37.6%(+3.77)#63 | 35.2%(+6.15)#6,180 |
| 64. | Woburn | 41.2% | 37.6%(+3.61)#64 | 35.2%(+5.99)#6,241 |
| 65. | Chicopee | 41.0% | 37.6%(+3.46)#65 | 35.2%(+5.84)#6,303 |
| 66. | Haverhill | 40.0% | 37.6%(+2.45)#66 | 35.2%(+4.83)#6,774 |
| 67. | Beverly | 39.9% | 37.6%(+2.35)#67 | 35.2%(+4.74)#6,834 |
| 68. | Easthampton Town | 39.3% | 37.6%(+1.72)#68 | 35.2%(+4.10)#7,145 |
| 69. | Arlington | 39.3% | 37.6%(+1.71)#69 | 35.2%(+4.09)#7,149 |
| 70. | Ayer | 39.1% | 37.6%(+1.56)#70 | 35.2%(+3.94)#7,211 |
| 71. | Mansfield Center | 39.1% | 37.6%(+1.53)#71 | 35.2%(+3.91)#7,225 |
| 72. | Gloucester | 38.6% | 37.6%(+0.998)#72 | 35.2%(+3.38)#7,461 |
| 73. | Pittsfield | 38.4% | 37.6%(+0.851)#73 | 35.2%(+3.23)#7,530 |
| 74. | Taunton | 38.2% | 37.6%(+0.681)#74 | 35.2%(+3.06)#7,607 |
| 75. | Vineyard Haven | 38.2% | 37.6%(+0.670)#75 | 35.2%(+3.05)#7,613 |
| 76. | Monson Center | 38.1% | 37.6%(+0.525)#76 | 35.2%(+2.91)#7,695 |
| 77. | Williamstown | 37.3% | 37.6%(-0.223)#77 | 35.2%(+2.16)#8,096 |
| 78. | Huntington | 36.7% | 37.6%(-0.879)#78 | 35.2%(+1.50)#8,446 |
| 79. | Belmont | 36.5% | 37.6%(-1.06)#79 | 35.2%(+1.32)#8,554 |
| 80. | North Lakeville | 36.0% | 37.6%(-1.60)#80 | 35.2%(+0.778)#8,870 |
| 81. | Fiskdale | 35.9% | 37.6%(-1.65)#81 | 35.2%(+0.734)#8,889 |
| 82. | Chester | 35.8% | 37.6%(-1.74)#82 | 35.2%(+0.643)#8,936 |
| 83. | Belchertown | 35.4% | 37.6%(-2.18)#83 | 35.2%(+0.206)#9,172 |
| 84. | Athol | 35.4% | 37.6%(-2.18)#84 | 35.2%(+0.204)#9,174 |
| 85. | Peabody | 34.5% | 37.6%(-3.05)#85 | 35.2%(-0.670)#9,658 |
| 86. | Marshfield | 34.5% | 37.6%(-3.07)#86 | 35.2%(-0.690)#9,668 |
| 87. | Leominster | 34.5% | 37.6%(-3.11)#87 | 35.2%(-0.730)#9,691 |
| 88. | Lee | 34.3% | 37.6%(-3.23)#88 | 35.2%(-0.845)#9,746 |
| 89. | South Deerfield | 34.2% | 37.6%(-3.37)#89 | 35.2%(-0.986)#9,816 |
| 90. | Melrose | 34.2% | 37.6%(-3.40)#90 | 35.2%(-1.01)#9,836 |
| 91. | Attleboro | 34.1% | 37.6%(-3.47)#91 | 35.2%(-1.09)#9,876 |
| 92. | Westfield | 33.6% | 37.6%(-4.01)#92 | 35.2%(-1.63)#10,167 |
| 93. | Bellingham | 33.4% | 37.6%(-4.18)#93 | 35.2%(-1.80)#10,240 |
| 94. | Marion Center | 33.3% | 37.6%(-4.23)#94 | 35.2%(-1.85)#10,264 |
| 95. | Raynham Center | 33.3% | 37.6%(-4.25)#95 | 35.2%(-1.87)#10,362 |
| 96. | Rockport | 33.2% | 37.6%(-4.39)#96 | 35.2%(-2.00)#10,425 |
| 97. | Wareham Center | 32.9% | 37.6%(-4.65)#97 | 35.2%(-2.27)#10,602 |
| 98. | Amesbury Town | 32.6% | 37.6%(-5.00)#98 | 35.2%(-2.62)#10,799 |
| 99. | Hudson | 32.4% | 37.6%(-5.15)#99 | 35.2%(-2.77)#10,878 |
| 100. | Milford | 32.3% | 37.6%(-5.28)#100 | 35.2%(-2.90)#10,953 |
Common Questions
What are the Top 10 Cities with the Highest Percentage of Renter-Occupied Units in Massachusetts?
Top 10 Cities with the Highest Percentage of Renter-Occupied Units in Massachusetts are:
#1
100.0%
#2
74.5%
#3
72.1%
#4
70.1%
#5
66.4%
#6
66.4%
#7
66.2%
#8
65.2%
#9
64.2%
#10
64.1%
What city has the Highest Percentage of Renter-Occupied Units in Massachusetts?
Hanscom AFB has the Highest Percentage of Renter-Occupied Units in Massachusetts with 100.0%.
What is the Percentage of Renter-Occupied Units in the State of Massachusetts?
Percentage of Renter-Occupied Units in Massachusetts is 37.6%.
What is the Percentage of Renter-Occupied Units in the United States?
Percentage of Renter-Occupied Units in the United States is 35.2%.