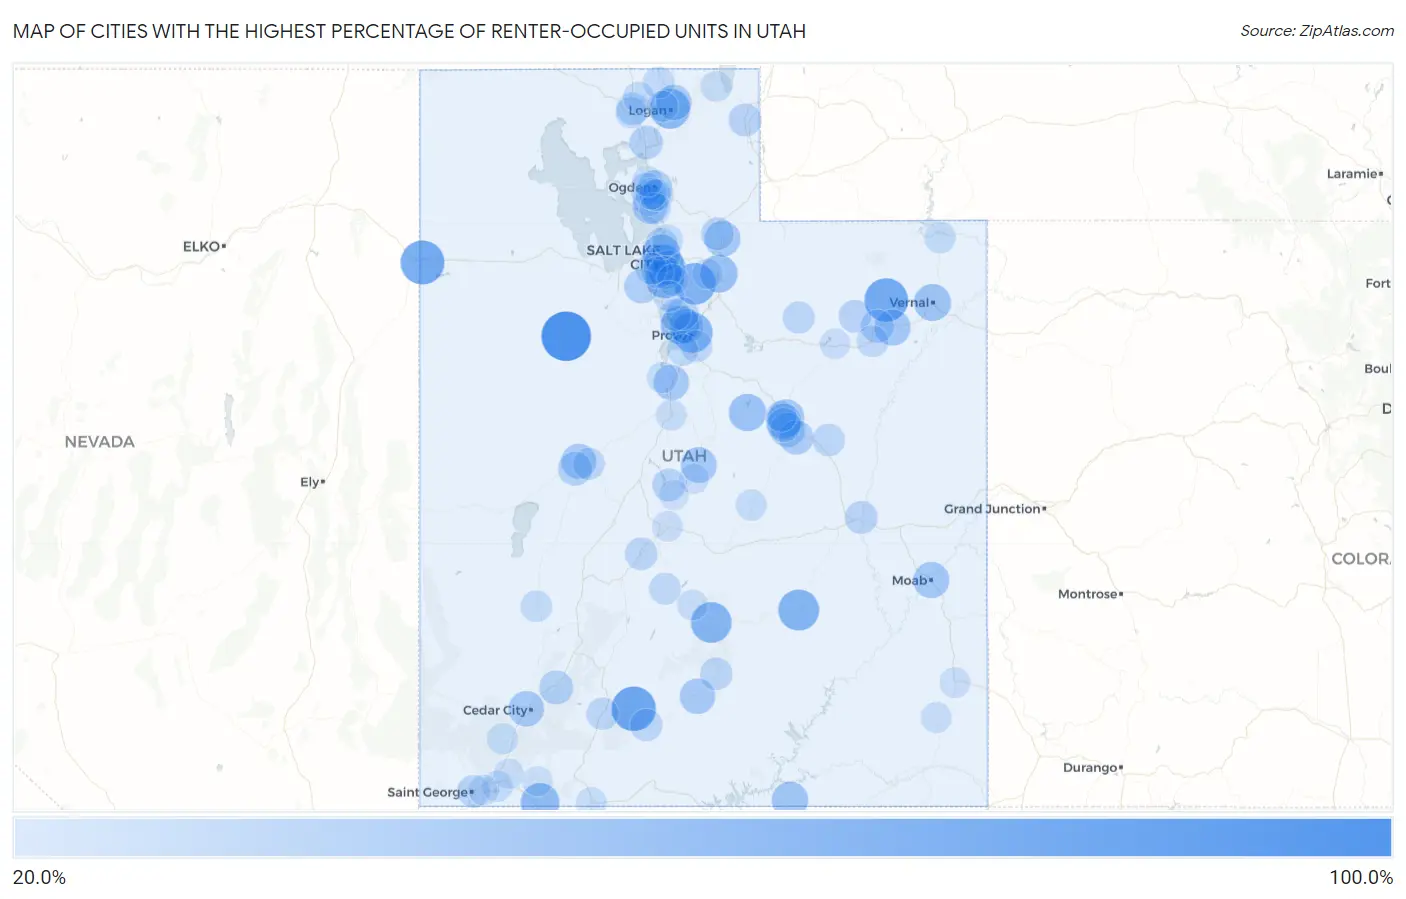
Cities with the Highest Percentage of Renter-Occupied Units in Utah
RELATED REPORTS & OPTIONS
Highest Renter-Occupied
Utah
Compare Cities
Map of Cities with the Highest Percentage of Renter-Occupied Units in Utah
0.0%
100.0%
Cities with the Highest Percentage of Renter-Occupied Units in Utah
| City | % Renter-Occupied | vs State | vs National | |
| 1. | Dugway | 96.2% | 29.3%(+67.0)#1 | 35.2%(+61.1)#282 |
| 2. | Bryce Canyon City | 76.5% | 29.3%(+47.2)#2 | 35.2%(+41.3)#517 |
| 3. | Wendover | 74.3% | 29.3%(+45.0)#3 | 35.2%(+39.1)#568 |
| 4. | Whiterocks | 73.2% | 29.3%(+43.9)#4 | 35.2%(+38.0)#593 |
| 5. | Alta | 65.7% | 29.3%(+36.4)#5 | 35.2%(+30.5)#913 |
| 6. | Hanksville | 63.0% | 29.3%(+33.8)#6 | 35.2%(+27.9)#1,096 |
| 7. | Teasdale | 62.5% | 29.3%(+33.2)#7 | 35.2%(+27.3)#1,151 |
| 8. | Provo | 60.9% | 29.3%(+31.6)#8 | 35.2%(+25.7)#1,280 |
| 9. | South Salt Lake | 60.7% | 29.3%(+31.5)#9 | 35.2%(+25.6)#1,301 |
| 10. | Logan | 59.7% | 29.3%(+30.4)#10 | 35.2%(+24.5)#1,412 |
| 11. | Hildale | 54.9% | 29.3%(+25.6)#11 | 35.2%(+19.7)#2,048 |
| 12. | Midvale | 54.8% | 29.3%(+25.5)#12 | 35.2%(+19.6)#2,068 |
| 13. | Vineyard | 54.4% | 29.3%(+25.2)#13 | 35.2%(+19.3)#2,117 |
| 14. | Salt Lake City | 53.0% | 29.3%(+23.7)#14 | 35.2%(+17.8)#2,379 |
| 15. | Hideout | 51.4% | 29.3%(+22.1)#15 | 35.2%(+16.2)#2,726 |
| 16. | Scofield | 50.0% | 29.3%(+20.7)#16 | 35.2%(+14.8)#3,129 |
| 17. | Vernal | 48.7% | 29.3%(+19.4)#17 | 35.2%(+13.5)#3,476 |
| 18. | Navajo Mountain | 46.7% | 29.3%(+17.4)#18 | 35.2%(+11.5)#4,125 |
| 19. | Kenilworth | 46.0% | 29.3%(+16.8)#19 | 35.2%(+10.8)#4,335 |
| 20. | Moab | 45.6% | 29.3%(+16.3)#20 | 35.2%(+10.4)#4,482 |
| 21. | Fort Duchesne | 45.3% | 29.3%(+16.0)#21 | 35.2%(+10.1)#4,575 |
| 22. | Hoytsville | 44.6% | 29.3%(+15.3)#22 | 35.2%(+9.43)#4,831 |
| 23. | Ephraim | 44.6% | 29.3%(+15.3)#23 | 35.2%(+9.37)#4,850 |
| 24. | Escalante | 43.3% | 29.3%(+14.0)#24 | 35.2%(+8.11)#5,343 |
| 25. | Cedar City | 43.2% | 29.3%(+13.9)#25 | 35.2%(+7.98)#5,391 |
| 26. | North Logan | 43.1% | 29.3%(+13.9)#26 | 35.2%(+7.96)#5,396 |
| 27. | Rocky Ridge | 43.0% | 29.3%(+13.7)#27 | 35.2%(+7.80)#5,469 |
| 28. | Spring Glen | 42.3% | 29.3%(+13.1)#28 | 35.2%(+7.16)#5,733 |
| 29. | Clearfield | 41.6% | 29.3%(+12.3)#29 | 35.2%(+6.42)#6,050 |
| 30. | Sutherland | 41.5% | 29.3%(+12.2)#30 | 35.2%(+6.33)#6,087 |
| 31. | Orem | 40.1% | 29.3%(+10.8)#31 | 35.2%(+4.92)#6,746 |
| 32. | Price | 39.9% | 29.3%(+10.6)#32 | 35.2%(+4.70)#6,853 |
| 33. | Ogden | 39.8% | 29.3%(+10.5)#33 | 35.2%(+4.60)#6,904 |
| 34. | Wellington | 39.1% | 29.3%(+9.85)#34 | 35.2%(+3.95)#7,203 |
| 35. | Copperton | 37.8% | 29.3%(+8.57)#35 | 35.2%(+2.66)#7,815 |
| 36. | Millcreek | 37.8% | 29.3%(+8.55)#36 | 35.2%(+2.64)#7,834 |
| 37. | Hinckley | 37.3% | 29.3%(+8.06)#37 | 35.2%(+2.15)#8,101 |
| 38. | Parowan | 37.3% | 29.3%(+8.04)#38 | 35.2%(+2.14)#8,110 |
| 39. | Carbonville | 36.7% | 29.3%(+7.42)#39 | 35.2%(+1.51)#8,440 |
| 40. | Brigham City | 36.1% | 29.3%(+6.84)#40 | 35.2%(+0.929)#8,768 |
| 41. | Murray | 35.0% | 29.3%(+5.69)#41 | 35.2%(-0.215)#9,396 |
| 42. | Roosevelt | 34.9% | 29.3%(+5.64)#42 | 35.2%(-0.262)#9,417 |
| 43. | Fayette | 34.0% | 29.3%(+4.77)#43 | 35.2%(-1.14)#9,908 |
| 44. | Green River | 33.7% | 29.3%(+4.38)#44 | 35.2%(-1.53)#10,116 |
| 45. | Randolph | 33.5% | 29.3%(+4.24)#45 | 35.2%(-1.66)#10,187 |
| 46. | Coalville | 33.3% | 29.3%(+3.99)#46 | 35.2%(-1.92)#10,382 |
| 47. | Pleasant Grove | 33.0% | 29.3%(+3.72)#47 | 35.2%(-2.19)#10,541 |
| 48. | Bluebell | 32.9% | 29.3%(+3.65)#48 | 35.2%(-2.26)#10,595 |
| 49. | St George | 32.3% | 29.3%(+3.07)#49 | 35.2%(-2.84)#10,915 |
| 50. | Boulder | 32.2% | 29.3%(+2.89)#50 | 35.2%(-3.02)#11,044 |
| 51. | East Carbon | 32.1% | 29.3%(+2.82)#51 | 35.2%(-3.08)#11,085 |
| 52. | Richfield | 32.0% | 29.3%(+2.71)#52 | 35.2%(-3.20)#11,151 |
| 53. | Cannonville | 31.8% | 29.3%(+2.54)#53 | 35.2%(-3.37)#11,243 |
| 54. | Garland | 31.8% | 29.3%(+2.51)#54 | 35.2%(-3.39)#11,262 |
| 55. | Hatch | 31.4% | 29.3%(+2.15)#55 | 35.2%(-3.76)#11,474 |
| 56. | Sunset | 30.6% | 29.3%(+1.32)#56 | 35.2%(-4.59)#11,984 |
| 57. | Delta | 30.4% | 29.3%(+1.12)#57 | 35.2%(-4.78)#12,107 |
| 58. | Tabiona | 30.4% | 29.3%(+1.08)#58 | 35.2%(-4.83)#12,133 |
| 59. | West Haven | 30.3% | 29.3%(+0.990)#59 | 35.2%(-4.92)#12,191 |
| 60. | Koosharem | 29.9% | 29.3%(+0.573)#60 | 35.2%(-5.33)#12,471 |
| 61. | South Ogden | 29.7% | 29.3%(+0.443)#61 | 35.2%(-5.46)#12,546 |
| 62. | Springville | 29.7% | 29.3%(+0.416)#62 | 35.2%(-5.49)#12,569 |
| 63. | North Salt Lake | 29.7% | 29.3%(+0.410)#63 | 35.2%(-5.50)#12,574 |
| 64. | Taylorsville | 29.6% | 29.3%(+0.288)#64 | 35.2%(-5.62)#12,654 |
| 65. | Myton | 29.4% | 29.3%(+0.106)#65 | 35.2%(-5.80)#12,776 |
| 66. | Washington Terrace | 29.1% | 29.3%(-0.207)#66 | 35.2%(-6.11)#12,982 |
| 67. | Trenton | 28.9% | 29.3%(-0.330)#67 | 35.2%(-6.24)#13,082 |
| 68. | West Valley City | 28.9% | 29.3%(-0.360)#68 | 35.2%(-6.27)#13,121 |
| 69. | Cottonwood Heights | 28.8% | 29.3%(-0.445)#69 | 35.2%(-6.35)#13,166 |
| 70. | Lake Shore | 28.8% | 29.3%(-0.445)#70 | 35.2%(-6.35)#13,167 |
| 71. | American Fork | 28.7% | 29.3%(-0.537)#71 | 35.2%(-6.44)#13,235 |
| 72. | Milford | 28.7% | 29.3%(-0.618)#72 | 35.2%(-6.52)#13,280 |
| 73. | Flaming Gorge | 28.6% | 29.3%(-0.706)#73 | 35.2%(-6.61)#13,358 |
| 74. | Layton | 28.5% | 29.3%(-0.773)#74 | 35.2%(-6.68)#13,402 |
| 75. | Tremonton | 28.4% | 29.3%(-0.835)#75 | 35.2%(-6.74)#13,431 |
| 76. | Riverdale | 28.2% | 29.3%(-1.08)#76 | 35.2%(-6.98)#13,595 |
| 77. | Fielding | 27.9% | 29.3%(-1.37)#77 | 35.2%(-7.28)#13,781 |
| 78. | Ferron | 27.1% | 29.3%(-2.16)#78 | 35.2%(-8.06)#14,310 |
| 79. | Helper | 27.0% | 29.3%(-2.25)#79 | 35.2%(-8.16)#14,384 |
| 80. | Goshen | 27.0% | 29.3%(-2.26)#80 | 35.2%(-8.17)#14,393 |
| 81. | New Harmony | 27.0% | 29.3%(-2.27)#81 | 35.2%(-8.18)#14,406 |
| 82. | Bountiful | 27.0% | 29.3%(-2.29)#82 | 35.2%(-8.19)#14,417 |
| 83. | Draper | 27.0% | 29.3%(-2.32)#83 | 35.2%(-8.23)#14,445 |
| 84. | Hurricane | 26.9% | 29.3%(-2.41)#84 | 35.2%(-8.32)#14,514 |
| 85. | Benson | 26.8% | 29.3%(-2.52)#85 | 35.2%(-8.43)#14,597 |
| 86. | Nephi | 26.6% | 29.3%(-2.71)#86 | 35.2%(-8.61)#14,706 |
| 87. | Kanab | 26.4% | 29.3%(-2.91)#87 | 35.2%(-8.81)#14,822 |
| 88. | Garden | 26.1% | 29.3%(-3.19)#88 | 35.2%(-9.10)#15,032 |
| 89. | Blanding | 25.9% | 29.3%(-3.36)#89 | 35.2%(-9.27)#15,160 |
| 90. | Marriott Slaterville | 25.7% | 29.3%(-3.57)#90 | 35.2%(-9.47)#15,287 |
| 91. | Washington | 25.6% | 29.3%(-3.67)#91 | 35.2%(-9.58)#15,341 |
| 92. | Loa | 25.5% | 29.3%(-3.77)#92 | 35.2%(-9.68)#15,404 |
| 93. | Salina | 25.1% | 29.3%(-4.23)#93 | 35.2%(-10.1)#15,670 |
| 94. | Monticello | 24.9% | 29.3%(-4.35)#94 | 35.2%(-10.3)#15,787 |
| 95. | Park City | 24.8% | 29.3%(-4.49)#95 | 35.2%(-10.4)#15,875 |
| 96. | Duchesne | 24.8% | 29.3%(-4.50)#96 | 35.2%(-10.4)#15,887 |
| 97. | Manti | 24.7% | 29.3%(-4.61)#97 | 35.2%(-10.5)#15,971 |
| 98. | La Verkin | 24.4% | 29.3%(-4.89)#98 | 35.2%(-10.8)#16,139 |
| 99. | Springdale | 24.2% | 29.3%(-5.08)#99 | 35.2%(-11.0)#16,262 |
| 100. | Gunnison | 23.7% | 29.3%(-5.59)#100 | 35.2%(-11.5)#16,623 |
Common Questions
What are the Top 10 Cities with the Highest Percentage of Renter-Occupied Units in Utah?
Top 10 Cities with the Highest Percentage of Renter-Occupied Units in Utah are:
#1
96.2%
#2
76.5%
#3
74.3%
#4
73.2%
#5
65.7%
#6
63.0%
#7
62.5%
#8
60.9%
#9
60.7%
#10
59.7%
What city has the Highest Percentage of Renter-Occupied Units in Utah?
Dugway has the Highest Percentage of Renter-Occupied Units in Utah with 96.2%.
What is the Percentage of Renter-Occupied Units in the State of Utah?
Percentage of Renter-Occupied Units in Utah is 29.3%.
What is the Percentage of Renter-Occupied Units in the United States?
Percentage of Renter-Occupied Units in the United States is 35.2%.