Cities with the Highest Percentage of Renter-Occupied Units in Vermont
RELATED REPORTS & OPTIONS
Highest Renter-Occupied
Vermont
Compare Cities
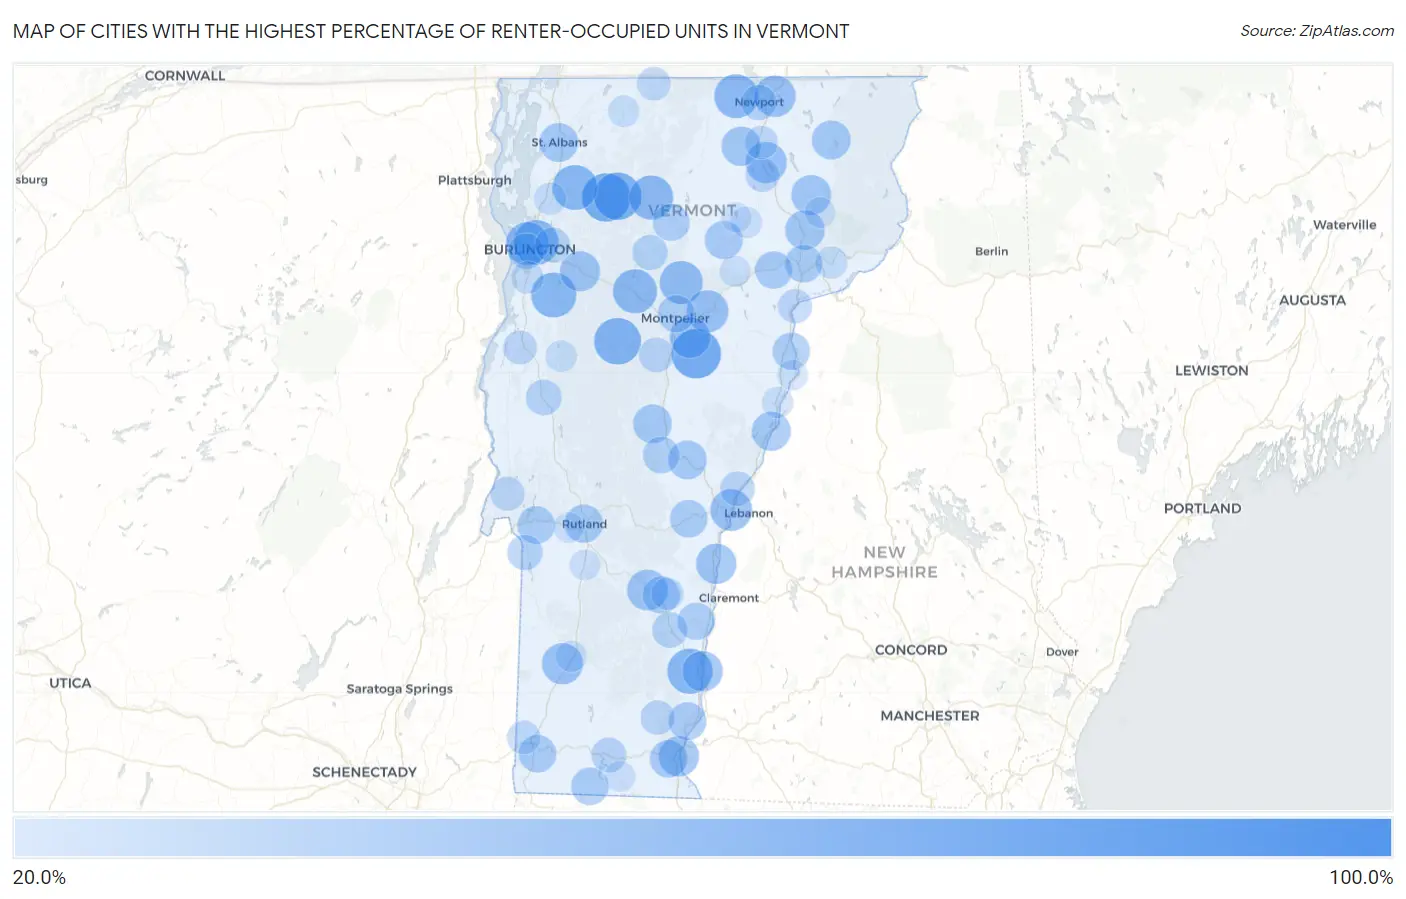
Map of Cities with the Highest Percentage of Renter-Occupied Units in Vermont
0.0%
100.0%
Cities with the Highest Percentage of Renter-Occupied Units in Vermont
| City | % Renter-Occupied | vs State | vs National | |
| 1. | South Woodstock | 100.0% | 27.3%(+72.7)#1 | 35.2%(+64.8)#183 |
| 2. | Algiers | 83.9% | 27.3%(+56.6)#2 | 35.2%(+48.7)#381 |
| 3. | Graniteville | 76.1% | 27.3%(+48.8)#3 | 35.2%(+40.9)#520 |
| 4. | Cambridge | 73.3% | 27.3%(+46.0)#4 | 35.2%(+38.1)#588 |
| 5. | Huntington Center | 73.0% | 27.3%(+45.7)#5 | 35.2%(+37.8)#600 |
| 6. | Jeffersonville | 70.9% | 27.3%(+43.6)#6 | 35.2%(+35.7)#671 |
| 7. | Waitsfield | 68.9% | 27.3%(+41.5)#7 | 35.2%(+33.7)#769 |
| 8. | Lyndon | 68.7% | 27.3%(+41.4)#8 | 35.2%(+33.5)#778 |
| 9. | Saxtons River | 65.2% | 27.3%(+37.9)#9 | 35.2%(+30.0)#935 |
| 10. | Hinesburg | 64.6% | 27.3%(+37.3)#10 | 35.2%(+29.5)#977 |
| 11. | Fairfax | 64.6% | 27.3%(+37.2)#11 | 35.2%(+29.4)#984 |
| 12. | Winooski | 64.3% | 27.3%(+36.9)#12 | 35.2%(+29.1)#1,008 |
| 13. | Waterbury | 62.1% | 27.3%(+34.8)#13 | 35.2%(+27.0)#1,176 |
| 14. | Johnson | 62.1% | 27.3%(+34.8)#14 | 35.2%(+27.0)#1,177 |
| 15. | Newport Center | 61.8% | 27.3%(+34.5)#15 | 35.2%(+26.6)#1,202 |
| 16. | Burlington | 60.1% | 27.3%(+32.7)#16 | 35.2%(+24.9)#1,357 |
| 17. | Worcester | 59.5% | 27.3%(+32.2)#17 | 35.2%(+24.3)#1,425 |
| 18. | East Charlotte | 59.3% | 27.3%(+32.0)#18 | 35.2%(+24.1)#1,451 |
| 19. | Townshend | 57.1% | 27.3%(+29.8)#19 | 35.2%(+22.0)#1,714 |
| 20. | Plainfield | 56.7% | 27.3%(+29.4)#20 | 35.2%(+21.5)#1,767 |
| 21. | White River Junction | 56.2% | 27.3%(+28.9)#21 | 35.2%(+21.0)#1,837 |
| 22. | Derby Center | 55.2% | 27.3%(+27.9)#22 | 35.2%(+20.0)#1,993 |
| 23. | Manchester | 54.9% | 27.3%(+27.5)#23 | 35.2%(+19.7)#2,054 |
| 24. | Barton | 54.3% | 27.3%(+27.0)#24 | 35.2%(+19.2)#2,134 |
| 25. | Barre | 53.7% | 27.3%(+26.4)#25 | 35.2%(+18.5)#2,229 |
| 26. | Ludlow | 53.5% | 27.3%(+26.2)#26 | 35.2%(+18.3)#2,273 |
| 27. | Windsor | 52.4% | 27.3%(+25.1)#27 | 35.2%(+17.3)#2,489 |
| 28. | Brattleboro | 52.4% | 27.3%(+25.1)#28 | 35.2%(+17.2)#2,491 |
| 29. | Bellows Falls | 52.3% | 27.3%(+25.0)#29 | 35.2%(+17.1)#2,526 |
| 30. | Richmond | 51.8% | 27.3%(+24.5)#30 | 35.2%(+16.6)#2,622 |
| 31. | West Burke | 51.5% | 27.3%(+24.2)#31 | 35.2%(+16.4)#2,688 |
| 32. | North Clarendon | 50.5% | 27.3%(+23.2)#32 | 35.2%(+15.4)#2,961 |
| 33. | Lyndonville | 50.3% | 27.3%(+23.0)#33 | 35.2%(+15.1)#3,024 |
| 34. | Irasburg | 50.0% | 27.3%(+22.7)#34 | 35.2%(+14.8)#3,105 |
| 35. | Fairlee | 49.3% | 27.3%(+22.0)#35 | 35.2%(+14.1)#3,290 |
| 36. | Island Pond | 48.9% | 27.3%(+21.6)#36 | 35.2%(+13.7)#3,397 |
| 37. | St Albans | 48.4% | 27.3%(+21.0)#37 | 35.2%(+13.2)#3,569 |
| 38. | Randolph | 48.2% | 27.3%(+20.8)#38 | 35.2%(+13.0)#3,628 |
| 39. | South Royalton | 47.9% | 27.3%(+20.6)#39 | 35.2%(+12.7)#3,706 |
| 40. | Waterbury Center | 47.9% | 27.3%(+20.6)#40 | 35.2%(+12.7)#3,716 |
| 41. | Rutland | 47.2% | 27.3%(+19.9)#41 | 35.2%(+12.1)#3,931 |
| 42. | Hardwick | 46.7% | 27.3%(+19.3)#42 | 35.2%(+11.5)#4,135 |
| 43. | Putney | 45.9% | 27.3%(+18.6)#43 | 35.2%(+10.7)#4,373 |
| 44. | West Woodstock | 45.9% | 27.3%(+18.6)#44 | 35.2%(+10.7)#4,386 |
| 45. | West Brattleboro | 45.8% | 27.3%(+18.5)#45 | 35.2%(+10.6)#4,406 |
| 46. | Castleton | 45.7% | 27.3%(+18.4)#46 | 35.2%(+10.5)#4,445 |
| 47. | Bennington | 45.7% | 27.3%(+18.3)#47 | 35.2%(+10.5)#4,450 |
| 48. | Readsboro | 45.5% | 27.3%(+18.2)#48 | 35.2%(+10.3)#4,493 |
| 49. | St Johnsbury | 45.2% | 27.3%(+17.9)#49 | 35.2%(+10.1)#4,603 |
| 50. | Woodstock | 45.2% | 27.3%(+17.9)#50 | 35.2%(+10.0)#4,622 |
| 51. | Hartford | 45.2% | 27.3%(+17.9)#51 | 35.2%(+9.99)#4,625 |
| 52. | Danville | 45.0% | 27.3%(+17.6)#52 | 35.2%(+9.78)#4,700 |
| 53. | Proctorsville | 44.8% | 27.3%(+17.5)#53 | 35.2%(+9.64)#4,751 |
| 54. | Wells River | 44.7% | 27.3%(+17.3)#54 | 35.2%(+9.48)#4,809 |
| 55. | Montpelier | 44.2% | 27.3%(+16.9)#55 | 35.2%(+9.03)#4,984 |
| 56. | Springfield | 44.2% | 27.3%(+16.8)#56 | 35.2%(+8.98)#5,004 |
| 57. | Morrisville | 43.8% | 27.3%(+16.5)#57 | 35.2%(+8.59)#5,143 |
| 58. | Bethel | 43.2% | 27.3%(+15.9)#58 | 35.2%(+8.00)#5,386 |
| 59. | South Londonderry | 42.2% | 27.3%(+14.8)#59 | 35.2%(+6.99)#5,816 |
| 60. | Middlebury | 40.6% | 27.3%(+13.3)#60 | 35.2%(+5.43)#6,482 |
| 61. | South Burlington | 40.6% | 27.3%(+13.2)#61 | 35.2%(+5.37)#6,522 |
| 62. | Chester | 40.3% | 27.3%(+13.0)#62 | 35.2%(+5.13)#6,641 |
| 63. | Poultney | 39.8% | 27.3%(+12.5)#63 | 35.2%(+4.62)#6,895 |
| 64. | Newport | 39.7% | 27.3%(+12.4)#64 | 35.2%(+4.55)#6,929 |
| 65. | Stowe | 39.6% | 27.3%(+12.3)#65 | 35.2%(+4.42)#6,991 |
| 66. | Essex Junction | 39.5% | 27.3%(+12.2)#66 | 35.2%(+4.33)#7,044 |
| 67. | Wilmington | 38.5% | 27.3%(+11.2)#67 | 35.2%(+3.36)#7,468 |
| 68. | Northfield | 38.3% | 27.3%(+11.0)#68 | 35.2%(+3.10)#7,579 |
| 69. | Norwich | 38.2% | 27.3%(+10.9)#69 | 35.2%(+3.05)#7,615 |
| 70. | Newfane | 37.3% | 27.3%(+9.93)#70 | 35.2%(+2.07)#8,150 |
| 71. | Barnet | 36.7% | 27.3%(+9.35)#71 | 35.2%(+1.48)#8,461 |
| 72. | Benson | 36.6% | 27.3%(+9.31)#72 | 35.2%(+1.45)#8,477 |
| 73. | Glover | 36.1% | 27.3%(+8.79)#73 | 35.2%(+0.927)#8,775 |
| 74. | Castleton Four Corners | 36.0% | 27.3%(+8.69)#74 | 35.2%(+0.827)#8,837 |
| 75. | Vergennes | 36.0% | 27.3%(+8.69)#75 | 35.2%(+0.824)#8,841 |
| 76. | Richford | 35.4% | 27.3%(+8.13)#76 | 35.2%(+0.264)#9,137 |
| 77. | North Bennington | 34.9% | 27.3%(+7.55)#77 | 35.2%(-0.313)#9,451 |
| 78. | Gilman | 34.8% | 27.3%(+7.46)#78 | 35.2%(-0.401)#9,503 |
| 79. | Orleans | 34.5% | 27.3%(+7.19)#79 | 35.2%(-0.675)#9,662 |
| 80. | Whitingham | 34.2% | 27.3%(+6.89)#80 | 35.2%(-0.973)#9,806 |
| 81. | Jamaica | 32.5% | 27.3%(+5.18)#81 | 35.2%(-2.68)#10,844 |
| 82. | Cavendish | 32.3% | 27.3%(+4.99)#82 | 35.2%(-2.88)#10,939 |
| 83. | Shelburne | 32.3% | 27.3%(+4.96)#83 | 35.2%(-2.90)#10,955 |
| 84. | Milton | 32.2% | 27.3%(+4.91)#84 | 35.2%(-2.95)#10,987 |
| 85. | Concord | 32.1% | 27.3%(+4.73)#85 | 35.2%(-3.13)#11,116 |
| 86. | Wolcott | 31.9% | 27.3%(+4.55)#86 | 35.2%(-3.32)#11,210 |
| 87. | Enosburg Falls | 30.4% | 27.3%(+3.12)#87 | 35.2%(-4.74)#12,075 |
| 88. | Bristol | 30.0% | 27.3%(+2.69)#88 | 35.2%(-5.17)#12,342 |
| 89. | Bradford | 29.7% | 27.3%(+2.34)#89 | 35.2%(-5.52)#12,589 |
| 90. | Greensboro Bend | 29.6% | 27.3%(+2.27)#90 | 35.2%(-5.59)#12,633 |
| 91. | Manchester Center | 29.3% | 27.3%(+1.94)#91 | 35.2%(-5.92)#12,867 |
| 92. | Cabot | 28.7% | 27.3%(+1.37)#92 | 35.2%(-6.49)#13,257 |
| 93. | Jacksonville | 28.2% | 27.3%(+0.848)#93 | 35.2%(-7.01)#13,615 |
| 94. | Newbury | 28.1% | 27.3%(+0.757)#94 | 35.2%(-7.10)#13,684 |
| 95. | Bolton Valley | 28.0% | 27.3%(+0.727)#95 | 35.2%(-7.13)#13,699 |
| 96. | West Rutland | 28.0% | 27.3%(+0.666)#96 | 35.2%(-7.20)#13,739 |
| 97. | Wallingford | 27.9% | 27.3%(+0.570)#97 | 35.2%(-7.29)#13,796 |
| 98. | East Burke | 27.5% | 27.3%(+0.215)#98 | 35.2%(-7.65)#14,038 |
| 99. | Lincoln | 27.0% | 27.3%(-0.321)#99 | 35.2%(-8.18)#14,409 |
| 100. | Greensboro | 26.8% | 27.3%(-0.536)#100 | 35.2%(-8.40)#14,577 |
1
2Common Questions
What are the Top 10 Cities with the Highest Percentage of Renter-Occupied Units in Vermont?
Top 10 Cities with the Highest Percentage of Renter-Occupied Units in Vermont are:
#1
76.1%
#2
73.3%
#3
70.9%
#4
68.9%
#5
65.2%
#6
64.6%
#7
64.6%
#8
64.3%
#9
62.1%
#10
62.1%
What city has the Highest Percentage of Renter-Occupied Units in Vermont?
Graniteville has the Highest Percentage of Renter-Occupied Units in Vermont with 76.1%.
What is the Percentage of Renter-Occupied Units in the State of Vermont?
Percentage of Renter-Occupied Units in Vermont is 27.3%.
What is the Percentage of Renter-Occupied Units in the United States?
Percentage of Renter-Occupied Units in the United States is 35.2%.