Cities with the Highest Percentage of Renter-Occupied Units in Nevada
RELATED REPORTS & OPTIONS
Highest Renter-Occupied
Nevada
Compare Cities
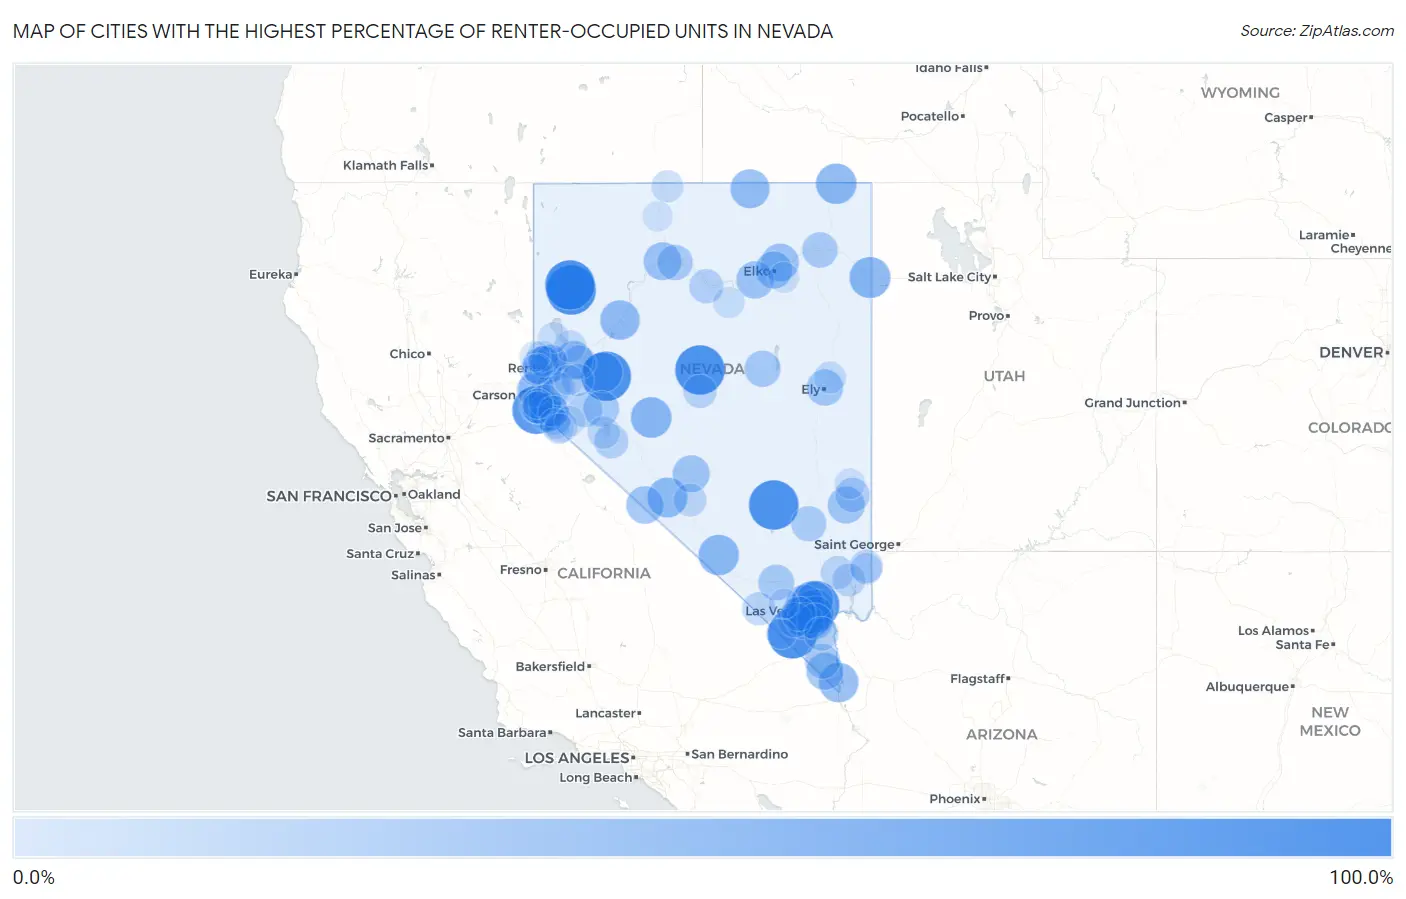
Map of Cities with the Highest Percentage of Renter-Occupied Units in Nevada
0.0%
100.0%
Cities with the Highest Percentage of Renter-Occupied Units in Nevada
| City | % Renter-Occupied | vs State | vs National | |
| 1. | Fallon Station | 100.0% | 41.6%(+58.4)#1 | 35.2%(+64.8)#58 |
| 2. | Empire | 100.0% | 41.6%(+58.4)#2 | 35.2%(+64.8)#94 |
| 3. | Goodsprings | 100.0% | 41.6%(+58.4)#3 | 35.2%(+64.8)#107 |
| 4. | Gerlach | 100.0% | 41.6%(+58.4)#4 | 35.2%(+64.8)#193 |
| 5. | Rachel | 100.0% | 41.6%(+58.4)#5 | 35.2%(+64.8)#194 |
| 6. | Austin | 100.0% | 41.6%(+58.4)#6 | 35.2%(+64.8)#200 |
| 7. | Nellis Afb | 95.4% | 41.6%(+53.9)#7 | 35.2%(+60.3)#289 |
| 8. | Stateline | 91.9% | 41.6%(+50.3)#8 | 35.2%(+56.7)#314 |
| 9. | Winchester | 67.7% | 41.6%(+26.1)#9 | 35.2%(+32.5)#811 |
| 10. | Paradise | 60.3% | 41.6%(+18.7)#10 | 35.2%(+25.1)#1,332 |
| 11. | West Wendover | 58.7% | 41.6%(+17.2)#11 | 35.2%(+23.5)#1,512 |
| 12. | Gabbs | 57.1% | 41.6%(+15.6)#12 | 35.2%(+22.0)#1,716 |
| 13. | Jackpot | 56.3% | 41.6%(+14.8)#13 | 35.2%(+21.1)#1,821 |
| 14. | Beatty | 55.8% | 41.6%(+14.3)#14 | 35.2%(+20.6)#1,889 |
| 15. | Fallon | 54.8% | 41.6%(+13.3)#15 | 35.2%(+19.6)#2,063 |
| 16. | Silver Peak | 53.4% | 41.6%(+11.9)#16 | 35.2%(+18.2)#2,287 |
| 17. | Reno | 51.7% | 41.6%(+10.1)#17 | 35.2%(+16.5)#2,661 |
| 18. | Lovelock | 51.2% | 41.6%(+9.62)#18 | 35.2%(+16.0)#2,781 |
| 19. | Laughlin | 51.1% | 41.6%(+9.52)#19 | 35.2%(+15.9)#2,821 |
| 20. | Spring Valley | 50.9% | 41.6%(+9.34)#20 | 35.2%(+15.7)#2,869 |
| 21. | Owyhee | 49.7% | 41.6%(+8.10)#21 | 35.2%(+14.5)#3,207 |
| 22. | Sunrise Manor | 48.8% | 41.6%(+7.21)#22 | 35.2%(+13.6)#3,450 |
| 23. | Gardnerville | 47.2% | 41.6%(+5.66)#23 | 35.2%(+12.0)#3,935 |
| 24. | Las Vegas | 45.2% | 41.6%(+3.61)#24 | 35.2%(+9.99)#4,627 |
| 25. | Wadsworth | 45.0% | 41.6%(+3.39)#25 | 35.2%(+9.78)#4,699 |
| 26. | Whitney | 44.0% | 41.6%(+2.44)#26 | 35.2%(+8.83)#5,046 |
| 27. | Winnemucca | 43.8% | 41.6%(+2.21)#27 | 35.2%(+8.60)#5,140 |
| 28. | Osino | 43.5% | 41.6%(+1.95)#28 | 35.2%(+8.33)#5,267 |
| 29. | Dyer | 42.0% | 41.6%(+0.390)#29 | 35.2%(+6.77)#5,908 |
| 30. | Carlin | 41.6% | 41.6%(+0.049)#30 | 35.2%(+6.43)#6,049 |
| 31. | Sparks | 40.6% | 41.6%(-0.965)#31 | 35.2%(+5.42)#6,486 |
| 32. | Elko | 40.6% | 41.6%(-0.976)#32 | 35.2%(+5.41)#6,494 |
| 33. | Cal Nev Ari | 40.5% | 41.6%(-1.03)#33 | 35.2%(+5.36)#6,528 |
| 34. | Tonopah | 39.8% | 41.6%(-1.81)#34 | 35.2%(+4.58)#6,919 |
| 35. | Caliente | 39.7% | 41.6%(-1.91)#35 | 35.2%(+4.47)#6,964 |
| 36. | North Las Vegas | 38.8% | 41.6%(-2.79)#36 | 35.2%(+3.59)#7,375 |
| 37. | Carson | 38.1% | 41.6%(-3.44)#37 | 35.2%(+2.95)#7,674 |
| 38. | Enterprise | 37.6% | 41.6%(-3.92)#38 | 35.2%(+2.46)#7,920 |
| 39. | Ely | 37.2% | 41.6%(-4.33)#39 | 35.2%(+2.05)#8,158 |
| 40. | Eureka | 35.8% | 41.6%(-5.81)#40 | 35.2%(+0.578)#8,976 |
| 41. | Henderson | 34.8% | 41.6%(-6.73)#41 | 35.2%(-0.347)#9,466 |
| 42. | Schurz | 34.3% | 41.6%(-7.28)#42 | 35.2%(-0.898)#9,769 |
| 43. | Indian Springs | 34.3% | 41.6%(-7.29)#43 | 35.2%(-0.908)#9,779 |
| 44. | Golconda | 32.8% | 41.6%(-8.81)#44 | 35.2%(-2.42)#10,688 |
| 45. | Wells | 32.3% | 41.6%(-9.22)#45 | 35.2%(-2.84)#10,914 |
| 46. | Alamo | 31.5% | 41.6%(-10.1)#46 | 35.2%(-3.70)#11,444 |
| 47. | Searchlight | 30.8% | 41.6%(-10.8)#47 | 35.2%(-4.38)#11,833 |
| 48. | Incline Village | 29.9% | 41.6%(-11.7)#48 | 35.2%(-5.30)#12,440 |
| 49. | Zephyr Cove | 29.8% | 41.6%(-11.8)#49 | 35.2%(-5.41)#12,514 |
| 50. | Blue Diamond | 28.8% | 41.6%(-12.7)#50 | 35.2%(-6.35)#13,171 |
| 51. | Yerington | 28.5% | 41.6%(-13.1)#51 | 35.2%(-6.67)#13,395 |
| 52. | Sun Valley | 28.4% | 41.6%(-13.2)#52 | 35.2%(-6.82)#13,478 |
| 53. | Silver City | 28.2% | 41.6%(-13.4)#53 | 35.2%(-6.98)#13,592 |
| 54. | Panaca | 27.8% | 41.6%(-13.8)#54 | 35.2%(-7.39)#13,863 |
| 55. | Summerlin South | 27.7% | 41.6%(-13.8)#55 | 35.2%(-7.45)#13,912 |
| 56. | Minden | 27.4% | 41.6%(-14.2)#56 | 35.2%(-7.81)#14,141 |
| 57. | Carter Springs | 27.2% | 41.6%(-14.4)#57 | 35.2%(-8.01)#14,270 |
| 58. | Fernley | 26.9% | 41.6%(-14.7)#58 | 35.2%(-8.30)#14,496 |
| 59. | Hawthorne | 26.9% | 41.6%(-14.7)#59 | 35.2%(-8.31)#14,501 |
| 60. | Battle Mountain | 26.5% | 41.6%(-15.1)#60 | 35.2%(-8.67)#14,737 |
| 61. | Gardnerville Ranchos | 26.0% | 41.6%(-15.6)#61 | 35.2%(-9.22)#15,121 |
| 62. | Boulder City | 25.8% | 41.6%(-15.8)#62 | 35.2%(-9.40)#15,236 |
| 63. | Crystal Bay | 25.8% | 41.6%(-15.8)#63 | 35.2%(-9.41)#15,243 |
| 64. | Kingsbury | 24.3% | 41.6%(-17.3)#64 | 35.2%(-10.9)#16,212 |
| 65. | Kingston | 22.8% | 41.6%(-18.7)#65 | 35.2%(-12.4)#17,236 |
| 66. | Moapa Town | 22.1% | 41.6%(-19.5)#66 | 35.2%(-13.1)#17,709 |
| 67. | Pahrump | 21.8% | 41.6%(-19.8)#67 | 35.2%(-13.4)#17,926 |
| 68. | Indian Hills | 21.5% | 41.6%(-20.0)#68 | 35.2%(-13.7)#18,097 |
| 69. | Mesquite | 21.3% | 41.6%(-20.3)#69 | 35.2%(-13.9)#18,270 |
| 70. | Moapa Valley | 21.2% | 41.6%(-20.4)#70 | 35.2%(-14.0)#18,372 |
| 71. | Dayton | 21.0% | 41.6%(-20.5)#71 | 35.2%(-14.2)#18,442 |
| 72. | Goldfield | 21.0% | 41.6%(-20.6)#72 | 35.2%(-14.2)#18,493 |
| 73. | Silver Springs | 19.7% | 41.6%(-21.9)#73 | 35.2%(-15.5)#19,346 |
| 74. | Walker Lake | 18.6% | 41.6%(-23.0)#74 | 35.2%(-16.6)#20,061 |
| 75. | Topaz Ranch Estates | 17.5% | 41.6%(-24.1)#75 | 35.2%(-17.7)#20,779 |
| 76. | Nixon | 16.3% | 41.6%(-25.2)#76 | 35.2%(-18.9)#21,550 |
| 77. | Fort Mcdermitt | 16.3% | 41.6%(-25.3)#77 | 35.2%(-18.9)#21,591 |
| 78. | Mcgill | 16.1% | 41.6%(-25.4)#78 | 35.2%(-19.0)#21,666 |
| 79. | Round Hill Village | 15.6% | 41.6%(-25.9)#79 | 35.2%(-19.5)#21,975 |
| 80. | Bunkerville | 15.3% | 41.6%(-26.3)#80 | 35.2%(-19.9)#22,194 |
| 81. | Amargosa Valley | 14.9% | 41.6%(-26.7)#81 | 35.2%(-20.3)#22,419 |
| 82. | Crescent Valley | 12.2% | 41.6%(-29.4)#82 | 35.2%(-23.0)#24,129 |
| 83. | Fish Springs | 12.0% | 41.6%(-29.6)#83 | 35.2%(-23.2)#24,236 |
| 84. | Double Spring | 11.8% | 41.6%(-29.8)#84 | 35.2%(-23.4)#24,359 |
| 85. | Spanish Springs | 11.7% | 41.6%(-29.9)#85 | 35.2%(-23.5)#24,411 |
| 86. | Sutcliffe | 11.6% | 41.6%(-30.0)#86 | 35.2%(-23.6)#24,477 |
| 87. | Lemmon Valley | 11.5% | 41.6%(-30.1)#87 | 35.2%(-23.7)#24,514 |
| 88. | Verdi | 11.5% | 41.6%(-30.1)#88 | 35.2%(-23.7)#24,520 |
| 89. | Golden Valley | 10.7% | 41.6%(-30.9)#89 | 35.2%(-24.5)#24,960 |
| 90. | Spring Creek | 10.5% | 41.6%(-31.1)#90 | 35.2%(-24.7)#25,068 |
| 91. | Smith Valley | 10.1% | 41.6%(-31.4)#91 | 35.2%(-25.1)#25,242 |
| 92. | Topaz Lake | 9.9% | 41.6%(-31.7)#92 | 35.2%(-25.3)#25,385 |
| 93. | Cold Springs | 9.7% | 41.6%(-31.9)#93 | 35.2%(-25.5)#25,489 |
| 94. | Pioche | 9.5% | 41.6%(-32.1)#94 | 35.2%(-25.7)#25,610 |
| 95. | Mount Charleston | 9.2% | 41.6%(-32.4)#95 | 35.2%(-26.0)#25,728 |
| 96. | Lakeridge | 8.9% | 41.6%(-32.7)#96 | 35.2%(-26.3)#25,910 |
| 97. | Orovada | 8.6% | 41.6%(-33.0)#97 | 35.2%(-26.6)#26,102 |
| 98. | Mogul | 8.5% | 41.6%(-33.0)#98 | 35.2%(-26.6)#26,114 |
| 99. | Sandy Valley | 8.4% | 41.6%(-33.2)#99 | 35.2%(-26.8)#26,178 |
| 100. | Stagecoach | 8.0% | 41.6%(-33.6)#100 | 35.2%(-27.2)#26,357 |
1
2Common Questions
What are the Top 10 Cities with the Highest Percentage of Renter-Occupied Units in Nevada?
Top 10 Cities with the Highest Percentage of Renter-Occupied Units in Nevada are:
#1
100.0%
#2
100.0%
#3
100.0%
#4
100.0%
#5
100.0%
#6
100.0%
#7
95.4%
#8
91.9%
#9
67.7%
#10
60.3%
What city has the Highest Percentage of Renter-Occupied Units in Nevada?
Fallon Station has the Highest Percentage of Renter-Occupied Units in Nevada with 100.0%.
What is the Percentage of Renter-Occupied Units in the State of Nevada?
Percentage of Renter-Occupied Units in Nevada is 41.6%.
What is the Percentage of Renter-Occupied Units in the United States?
Percentage of Renter-Occupied Units in the United States is 35.2%.