Zip Codes with the Highest Percentage of Population with a Degree in Science and Engineering in Lynnwood, WA
RELATED REPORTS & OPTIONS
Science and Engineering
Lynnwood
Compare Zip Codes
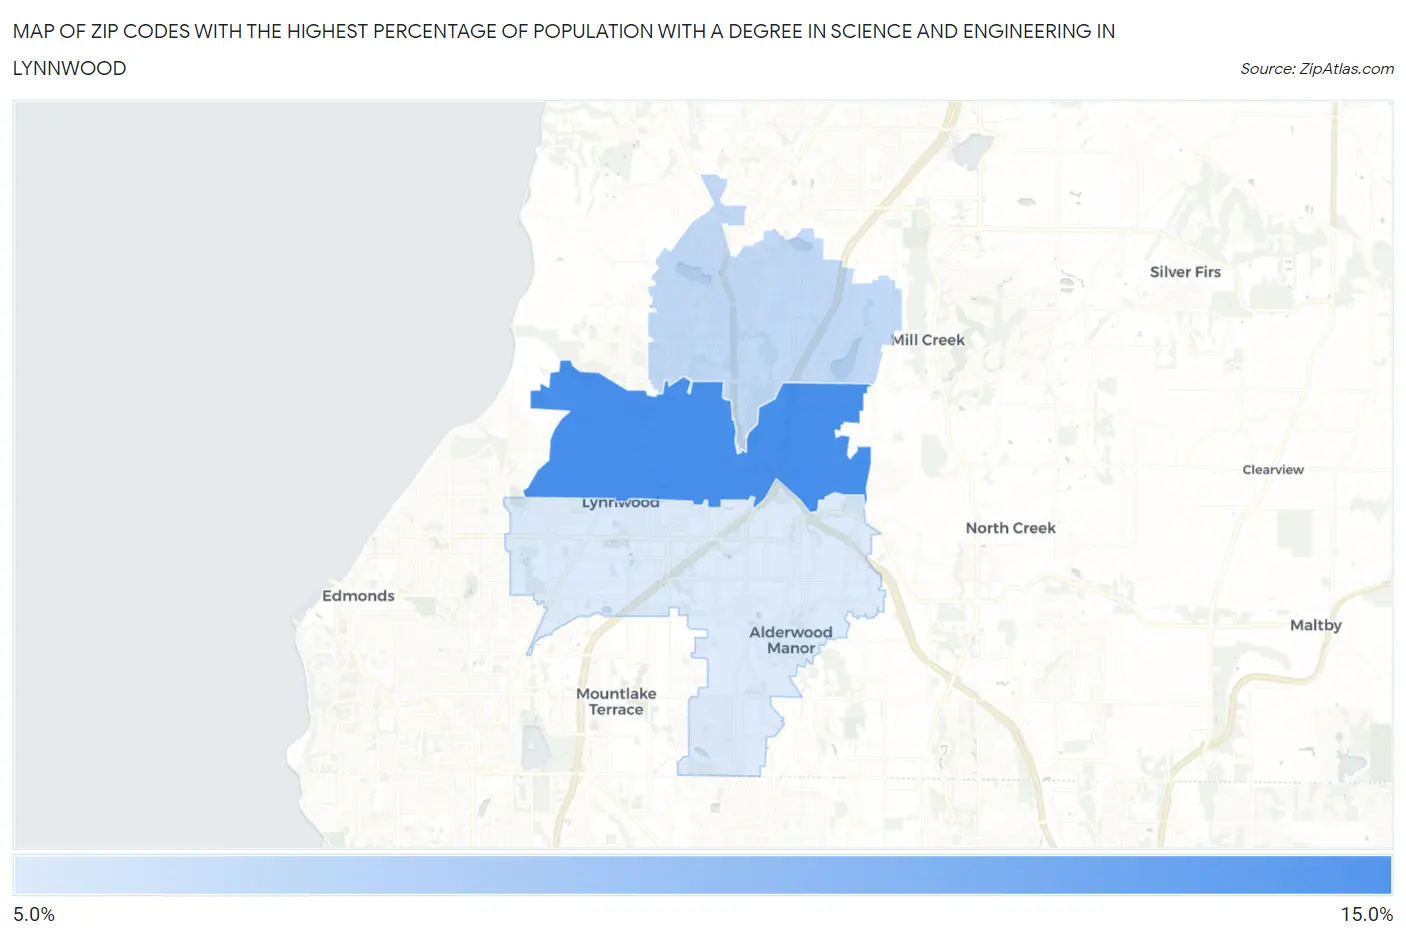
Map of Zip Codes with the Highest Percentage of Population with a Degree in Science and Engineering in Lynnwood
8.3%
10.5%
Zip Codes with the Highest Percentage of Population with a Degree in Science and Engineering in Lynnwood, WA
| Zip Code | % Graduates | vs State | vs National | |
| 1. | 98037 | 10.5% | 8.7%(+1.81)#185 | 9.8%(+0.765)#13,845 |
| 2. | 98087 | 8.7% | 8.7%(+0.000)#271 | 9.8%(-1.04)#17,931 |
| 3. | 98036 | 8.3% | 8.7%(-0.403)#292 | 9.8%(-1.44)#18,839 |
1
Common Questions
What are the Top Zip Codes with the Highest Percentage of Population with a Degree in Science and Engineering in Lynnwood, WA?
Top Zip Codes with the Highest Percentage of Population with a Degree in Science and Engineering in Lynnwood, WA are:
What zip code has the Highest Percentage of Population with a Degree in Science and Engineering in Lynnwood, WA?
98037 has the Highest Percentage of Population with a Degree in Science and Engineering in Lynnwood, WA with 10.5%.
What is the Percentage of Population with a Degree in Science and Engineering in Lynnwood, WA?
Percentage of Population with a Degree in Science and Engineering in Lynnwood is 8.5%.
What is the Percentage of Population with a Degree in Science and Engineering in Washington?
Percentage of Population with a Degree in Science and Engineering in Washington is 8.7%.
What is the Percentage of Population with a Degree in Science and Engineering in the United States?
Percentage of Population with a Degree in Science and Engineering in the United States is 9.8%.