Zip Codes with the Highest Percentage of Population with a Degree in Science and Engineering in Woodinville, WA
RELATED REPORTS & OPTIONS
Science and Engineering
Woodinville
Compare Zip Codes
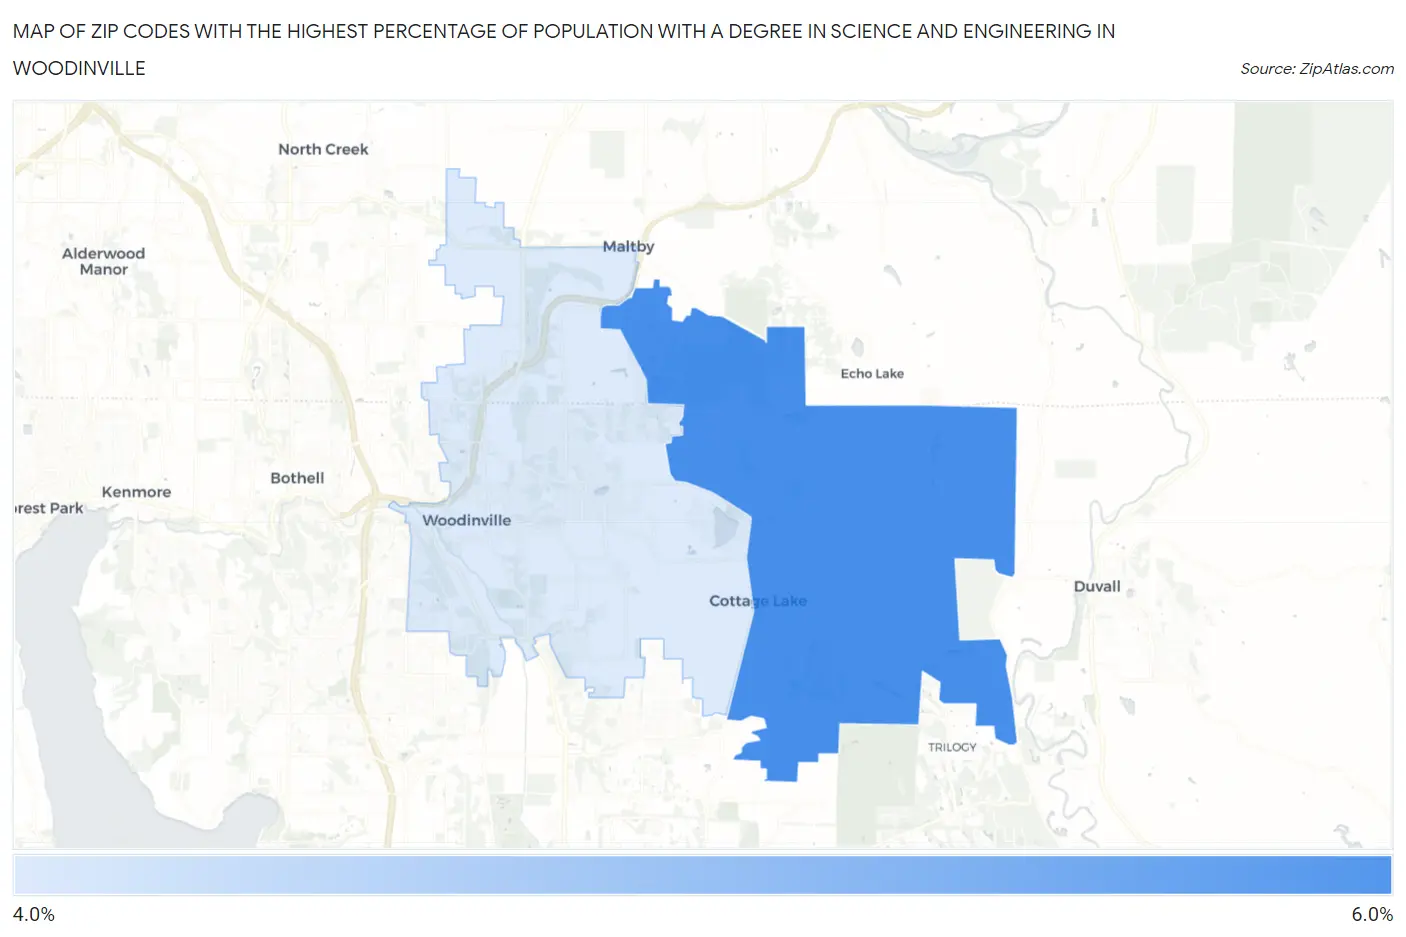
Map of Zip Codes with the Highest Percentage of Population with a Degree in Science and Engineering in Woodinville
4.5%
5.5%
Zip Codes with the Highest Percentage of Population with a Degree in Science and Engineering in Woodinville, WA
| Zip Code | % Graduates | vs State | vs National | |
| 1. | 98077 | 5.5% | 8.7%(-3.20)#435 | 9.8%(-4.24)#24,083 |
| 2. | 98072 | 4.5% | 8.7%(-4.19)#458 | 9.8%(-5.24)#25,230 |
1
Common Questions
What are the Top Zip Codes with the Highest Percentage of Population with a Degree in Science and Engineering in Woodinville, WA?
Top Zip Codes with the Highest Percentage of Population with a Degree in Science and Engineering in Woodinville, WA are:
What zip code has the Highest Percentage of Population with a Degree in Science and Engineering in Woodinville, WA?
98077 has the Highest Percentage of Population with a Degree in Science and Engineering in Woodinville, WA with 5.5%.
What is the Percentage of Population with a Degree in Science and Engineering in Woodinville, WA?
Percentage of Population with a Degree in Science and Engineering in Woodinville is 5.7%.
What is the Percentage of Population with a Degree in Science and Engineering in Washington?
Percentage of Population with a Degree in Science and Engineering in Washington is 8.7%.
What is the Percentage of Population with a Degree in Science and Engineering in the United States?
Percentage of Population with a Degree in Science and Engineering in the United States is 9.8%.