Naches, WA Map & Demographics
Naches Map
Naches Overview
$31,210
PER CAPITA INCOME
$71,696
AVG FAMILY INCOME
$52,270
AVG HOUSEHOLD INCOME
11.2%
WAGE / INCOME GAP [ % ]
88.8¢/ $1
WAGE / INCOME GAP [ $ ]
$6,696
FAMILY INCOME DEFICIT
0.38
INEQUALITY / GINI INDEX
814
TOTAL POPULATION
421
MALE POPULATION
393
FEMALE POPULATION
107.12
MALES / 100 FEMALES
93.35
FEMALES / 100 MALES
38.4
MEDIAN AGE
2.4
AVG FAMILY SIZE
2.1
AVG HOUSEHOLD SIZE
435
LABOR FORCE [ PEOPLE ]
66.4%
PERCENT IN LABOR FORCE
5.7%
UNEMPLOYMENT RATE
Naches Zip Codes
Naches Area Codes
Income in Naches
Income Overview in Naches
Per Capita Income in Naches is $31,210, while median incomes of families and households are $71,696 and $52,270 respectively.
| Characteristic | Number | Measure |
| Per Capita Income | 814 | $31,210 |
| Median Family Income | 241 | $71,696 |
| Mean Family Income | 241 | $78,524 |
| Median Household Income | 361 | $52,270 |
| Mean Household Income | 361 | $68,083 |
| Income Deficit | 241 | $6,696 |
| Wage / Income Gap (%) | 814 | 11.17% |
| Wage / Income Gap ($) | 814 | 88.83¢ per $1 |
| Gini / Inequality Index | 814 | 0.38 |
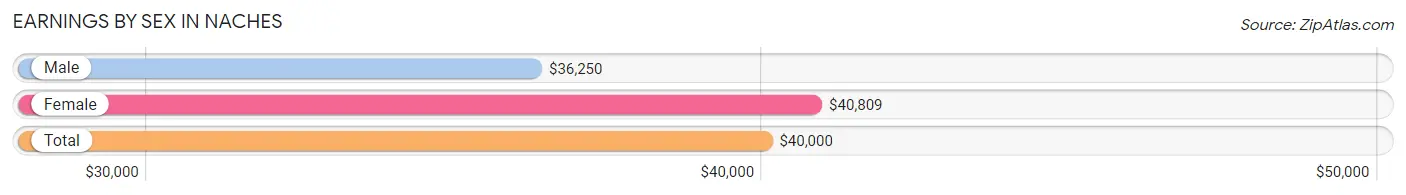
Earnings by Sex in Naches
Average Earnings in Naches are $40,000, $36,250 for men and $40,809 for women, a difference of 11.2%.
| Sex | Number | Average Earnings |
| Male | 255 (54.0%) | $36,250 |
| Female | 217 (46.0%) | $40,809 |
| Total | 472 (100.0%) | $40,000 |
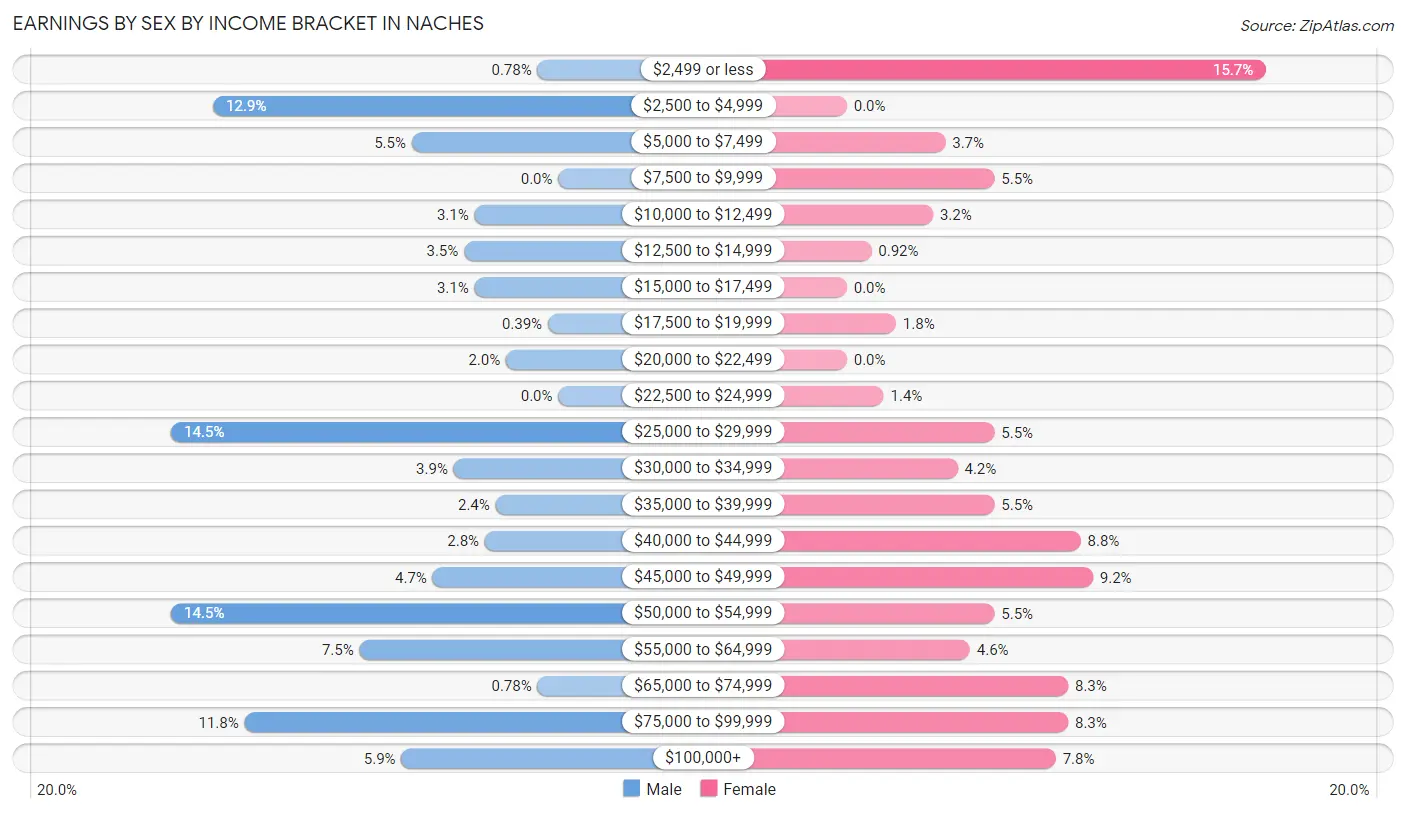
Earnings by Sex by Income Bracket in Naches
The most common earnings brackets in Naches are $25,000 to $29,999 for men (37 | 14.5%) and $2,499 or less for women (34 | 15.7%).
| Income | Male | Female |
| $2,499 or less | 2 (0.8%) | 34 (15.7%) |
| $2,500 to $4,999 | 33 (12.9%) | 0 (0.0%) |
| $5,000 to $7,499 | 14 (5.5%) | 8 (3.7%) |
| $7,500 to $9,999 | 0 (0.0%) | 12 (5.5%) |
| $10,000 to $12,499 | 8 (3.1%) | 7 (3.2%) |
| $12,500 to $14,999 | 9 (3.5%) | 2 (0.9%) |
| $15,000 to $17,499 | 8 (3.1%) | 0 (0.0%) |
| $17,500 to $19,999 | 1 (0.4%) | 4 (1.8%) |
| $20,000 to $22,499 | 5 (2.0%) | 0 (0.0%) |
| $22,500 to $24,999 | 0 (0.0%) | 3 (1.4%) |
| $25,000 to $29,999 | 37 (14.5%) | 12 (5.5%) |
| $30,000 to $34,999 | 10 (3.9%) | 9 (4.2%) |
| $35,000 to $39,999 | 6 (2.4%) | 12 (5.5%) |
| $40,000 to $44,999 | 7 (2.8%) | 19 (8.8%) |
| $45,000 to $49,999 | 12 (4.7%) | 20 (9.2%) |
| $50,000 to $54,999 | 37 (14.5%) | 12 (5.5%) |
| $55,000 to $64,999 | 19 (7.4%) | 10 (4.6%) |
| $65,000 to $74,999 | 2 (0.8%) | 18 (8.3%) |
| $75,000 to $99,999 | 30 (11.8%) | 18 (8.3%) |
| $100,000+ | 15 (5.9%) | 17 (7.8%) |
| Total | 255 (100.0%) | 217 (100.0%) |
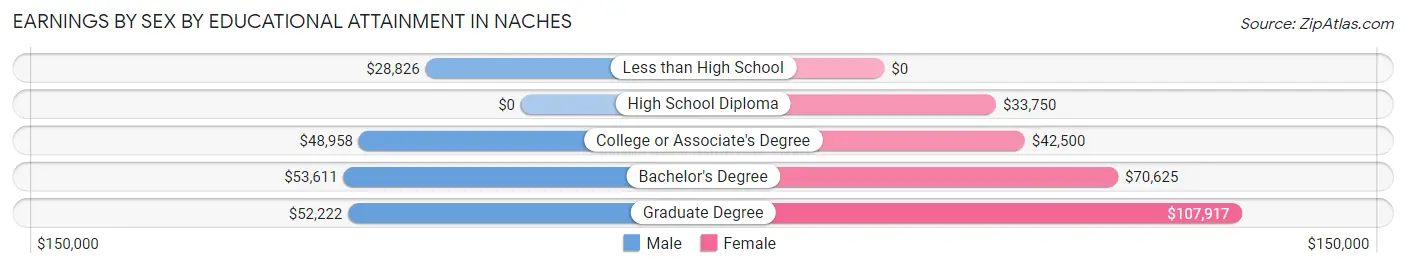
Earnings by Sex by Educational Attainment in Naches
Average earnings in Naches are $40,000 for men and $42,279 for women, a difference of 5.4%. Men with an educational attainment of bachelor's degree enjoy the highest average annual earnings of $53,611, while those with less than high school education earn the least with $28,826. Women with an educational attainment of graduate degree earn the most with the average annual earnings of $107,917, while those with high school diploma education have the smallest earnings of $33,750.
| Educational Attainment | Male Income | Female Income |
| Less than High School | $28,826 | $0 |
| High School Diploma | - | - |
| College or Associate's Degree | $48,958 | $42,500 |
| Bachelor's Degree | $53,611 | $70,625 |
| Graduate Degree | $52,222 | $107,917 |
| Total | $40,000 | $42,279 |
Family Income in Naches
Family Income Brackets in Naches
According to the Naches family income data, there are 57 families falling into the $50,000 to $74,999 income range, which is the most common income bracket and makes up 23.6% of all families.
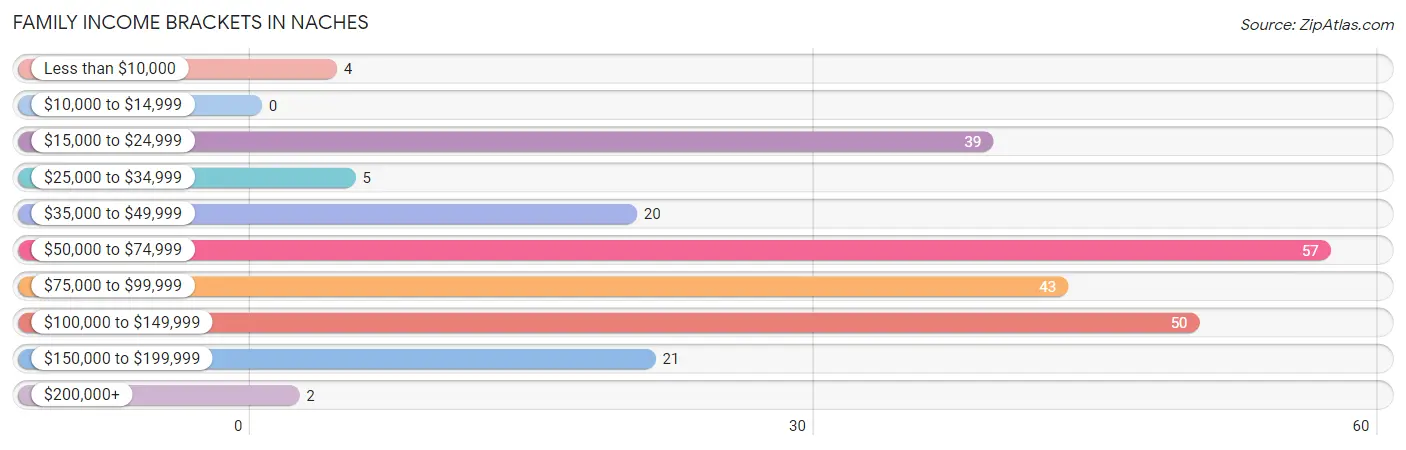
| Income Bracket | # Families | % Families |
| Less than $10,000 | 4 | 1.7% |
| $10,000 to $14,999 | 0 | 0.0% |
| $15,000 to $24,999 | 39 | 16.2% |
| $25,000 to $34,999 | 5 | 2.1% |
| $35,000 to $49,999 | 20 | 8.3% |
| $50,000 to $74,999 | 57 | 23.7% |
| $75,000 to $99,999 | 43 | 17.8% |
| $100,000 to $149,999 | 50 | 20.7% |
| $150,000 to $199,999 | 21 | 8.7% |
| $200,000+ | 2 | 0.8% |
Family Income by Famaliy Size in Naches
4-person families (16 | 6.6%) account for the highest median family income in Naches with $162,778 per family, while 4-person families (16 | 6.6%) have the highest median income of $40,694 per family member.
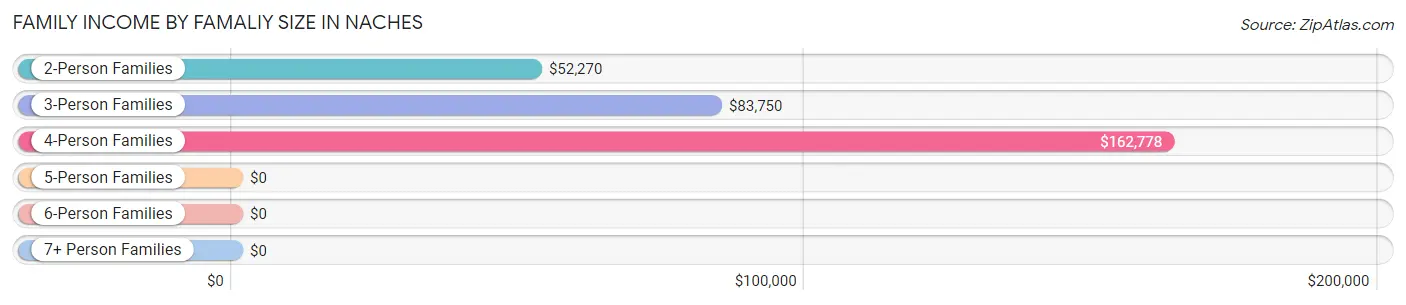
| Income Bracket | # Families | Median Income |
| 2-Person Families | 173 (71.8%) | $52,270 |
| 3-Person Families | 42 (17.4%) | $83,750 |
| 4-Person Families | 16 (6.6%) | $162,778 |
| 5-Person Families | 10 (4.2%) | $0 |
| 6-Person Families | 0 (0.0%) | $0 |
| 7+ Person Families | 0 (0.0%) | $0 |
| Total | 241 (100.0%) | $71,696 |
Family Income by Number of Earners in Naches
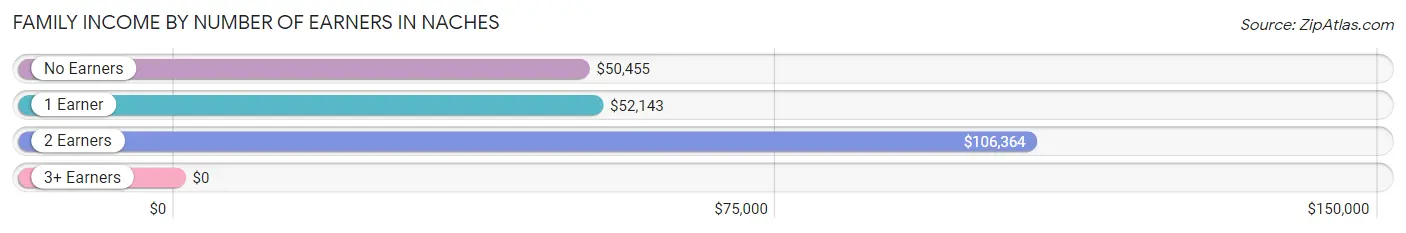
| Number of Earners | # Families | Median Income |
| No Earners | 52 (21.6%) | $50,455 |
| 1 Earner | 80 (33.2%) | $52,143 |
| 2 Earners | 106 (44.0%) | $106,364 |
| 3+ Earners | 3 (1.2%) | $0 |
| Total | 241 (100.0%) | $71,696 |
Household Income in Naches
Household Income Brackets in Naches
With 67 households falling in the category, the $50,000 to $74,999 income range is the most frequent in Naches, accounting for 18.6% of all households. In contrast, only 2 households (0.5%) fall into the $200,000+ income bracket, making it the least populous group.
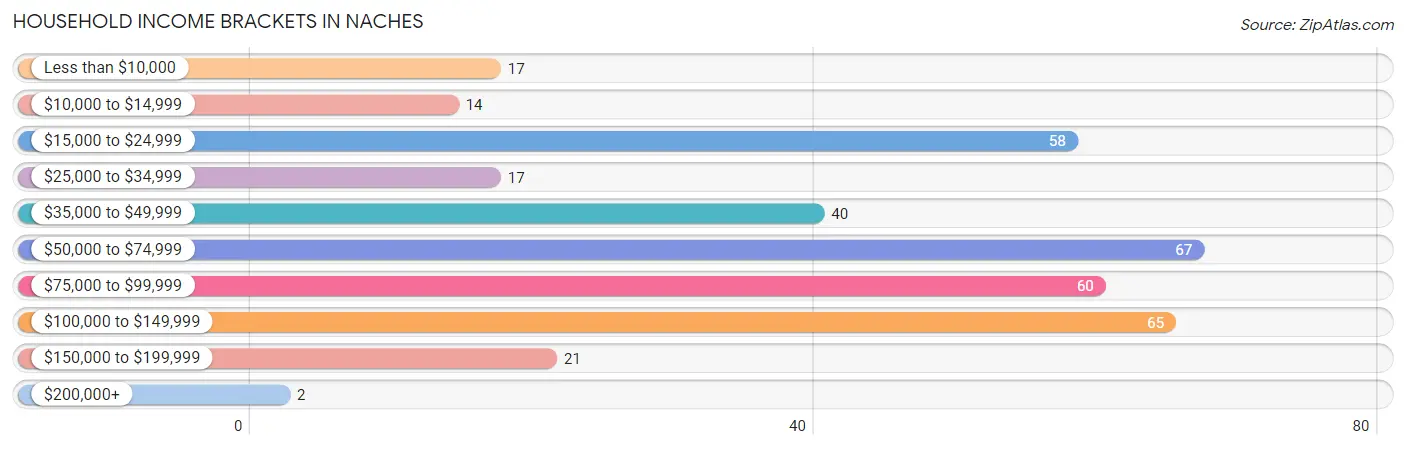
| Income Bracket | # Households | % Households |
| Less than $10,000 | 17 | 4.7% |
| $10,000 to $14,999 | 14 | 3.9% |
| $15,000 to $24,999 | 58 | 16.1% |
| $25,000 to $34,999 | 17 | 4.7% |
| $35,000 to $49,999 | 40 | 11.1% |
| $50,000 to $74,999 | 67 | 18.6% |
| $75,000 to $99,999 | 60 | 16.6% |
| $100,000 to $149,999 | 65 | 18.0% |
| $150,000 to $199,999 | 21 | 5.8% |
| $200,000+ | 2 | 0.6% |
Household Income by Householder Age in Naches
The median household income in Naches is $52,270, with the highest median household income of $87,500 found in the 45 to 64 years age bracket for the primary householder. A total of 94 households (26.0%) fall into this category. Meanwhile, the 15 to 24 years age bracket for the primary householder has the lowest median household income of $0, with 18 households (5.0%) in this group.
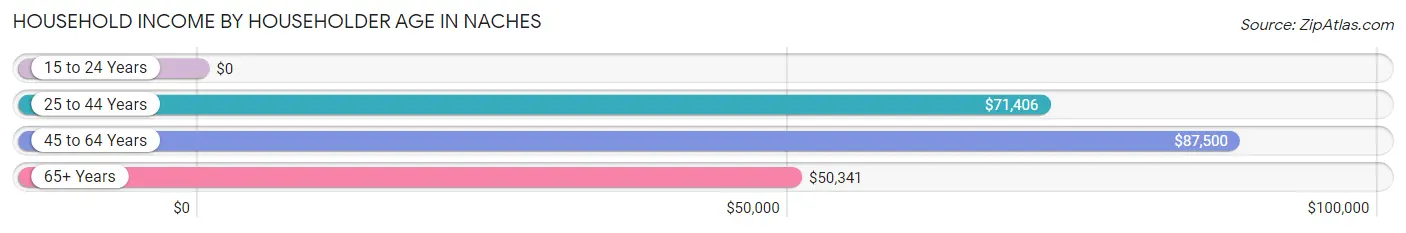
| Income Bracket | # Households | Median Income |
| 15 to 24 Years | 18 (5.0%) | $0 |
| 25 to 44 Years | 135 (37.4%) | $71,406 |
| 45 to 64 Years | 94 (26.0%) | $87,500 |
| 65+ Years | 114 (31.6%) | $50,341 |
| Total | 361 (100.0%) | $52,270 |
Poverty in Naches
Income Below Poverty by Sex and Age in Naches
With 20.5% poverty level for males and 11.5% for females among the residents of Naches, 45 to 54 year old males and 35 to 44 year old females are the most vulnerable to poverty, with 40 males (80.0%) and 6 females (54.5%) in their respective age groups living below the poverty level.
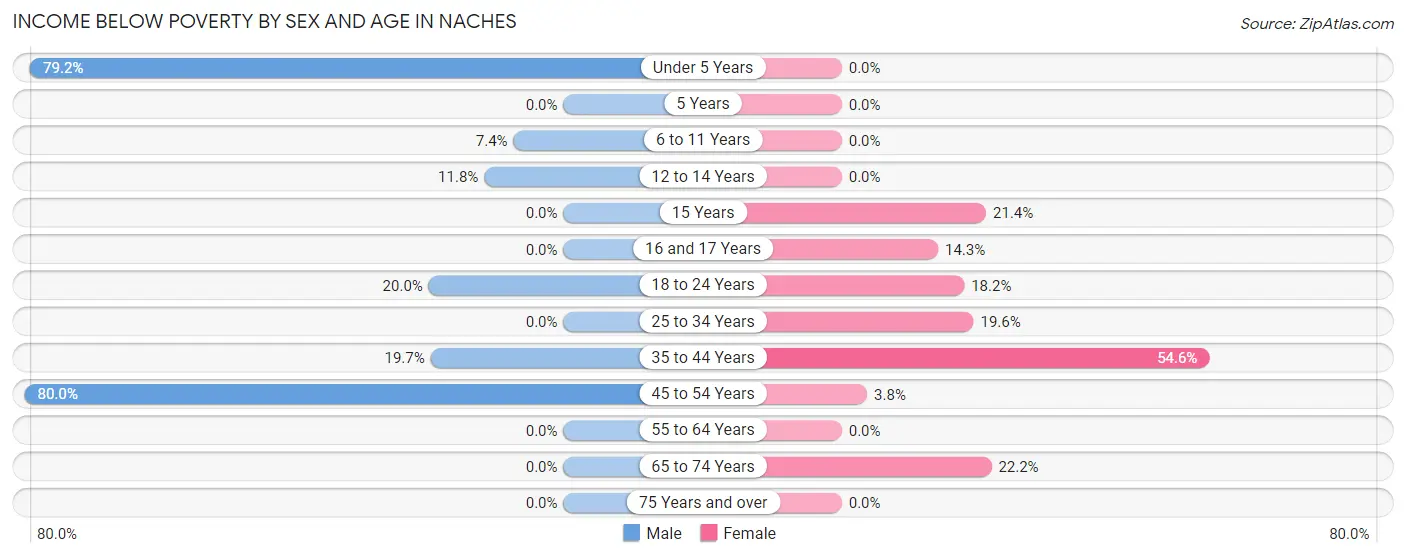
| Age Bracket | Male | Female |
| Under 5 Years | 19 (79.2%) | 0 (0.0%) |
| 5 Years | 0 (0.0%) | 0 (0.0%) |
| 6 to 11 Years | 2 (7.4%) | 0 (0.0%) |
| 12 to 14 Years | 2 (11.8%) | 0 (0.0%) |
| 15 Years | 0 (0.0%) | 3 (21.4%) |
| 16 and 17 Years | 0 (0.0%) | 2 (14.3%) |
| 18 to 24 Years | 4 (20.0%) | 4 (18.2%) |
| 25 to 34 Years | 0 (0.0%) | 18 (19.6%) |
| 35 to 44 Years | 14 (19.7%) | 6 (54.5%) |
| 45 to 54 Years | 40 (80.0%) | 2 (3.8%) |
| 55 to 64 Years | 0 (0.0%) | 0 (0.0%) |
| 65 to 74 Years | 0 (0.0%) | 10 (22.2%) |
| 75 Years and over | 0 (0.0%) | 0 (0.0%) |
| Total | 81 (20.5%) | 45 (11.5%) |
Income Above Poverty by Sex and Age in Naches
According to the poverty statistics in Naches, males aged 5 years and females aged under 5 years are the age groups that are most secure financially, with 100.0% of males and 100.0% of females in these age groups living above the poverty line.
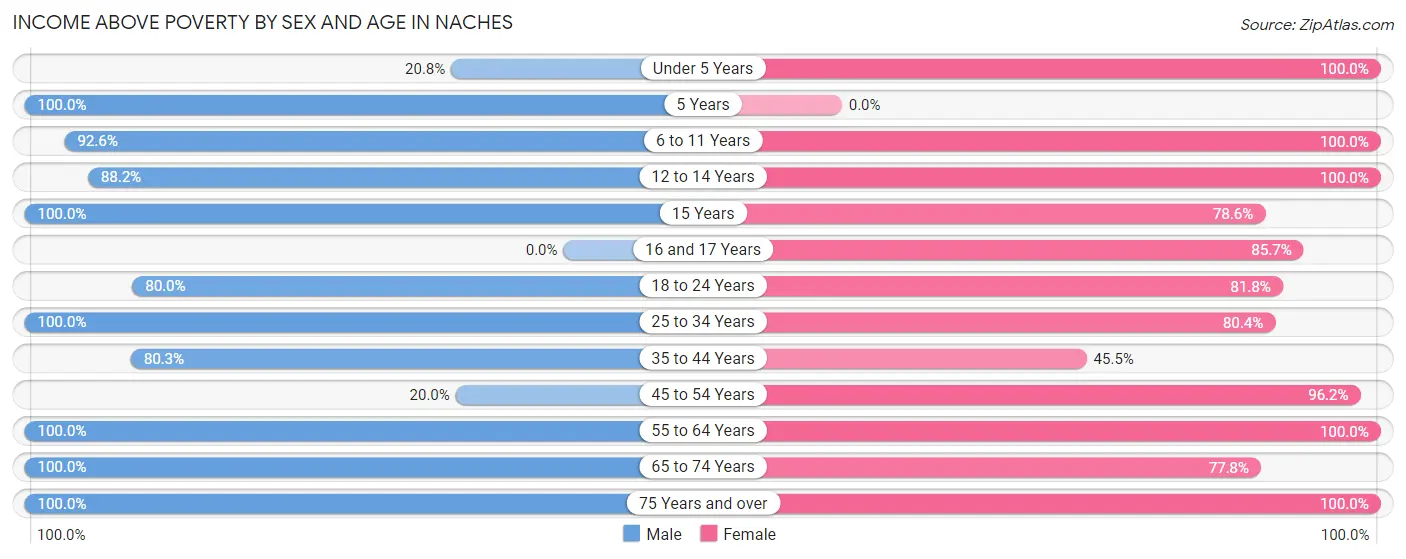
| Age Bracket | Male | Female |
| Under 5 Years | 5 (20.8%) | 25 (100.0%) |
| 5 Years | 3 (100.0%) | 0 (0.0%) |
| 6 to 11 Years | 25 (92.6%) | 12 (100.0%) |
| 12 to 14 Years | 15 (88.2%) | 6 (100.0%) |
| 15 Years | 2 (100.0%) | 11 (78.6%) |
| 16 and 17 Years | 0 (0.0%) | 12 (85.7%) |
| 18 to 24 Years | 16 (80.0%) | 18 (81.8%) |
| 25 to 34 Years | 67 (100.0%) | 74 (80.4%) |
| 35 to 44 Years | 57 (80.3%) | 5 (45.5%) |
| 45 to 54 Years | 10 (20.0%) | 51 (96.2%) |
| 55 to 64 Years | 40 (100.0%) | 53 (100.0%) |
| 65 to 74 Years | 45 (100.0%) | 35 (77.8%) |
| 75 Years and over | 29 (100.0%) | 43 (100.0%) |
| Total | 314 (79.5%) | 345 (88.5%) |
Income Below Poverty Among Married-Couple Families in Naches
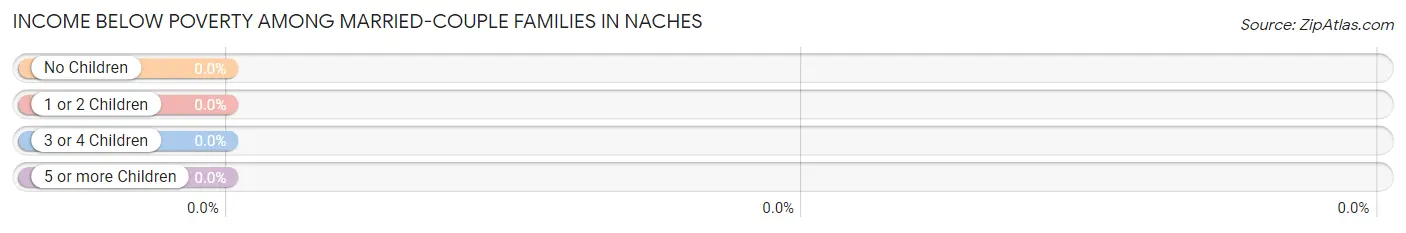
| Children | Above Poverty | Below Poverty |
| No Children | 115 (100.0%) | 0 (0.0%) |
| 1 or 2 Children | 38 (100.0%) | 0 (0.0%) |
| 3 or 4 Children | 0 (0.0%) | 0 (0.0%) |
| 5 or more Children | 0 (0.0%) | 0 (0.0%) |
| Total | 153 (100.0%) | 0 (0.0%) |
Income Below Poverty Among Single-Parent Households in Naches
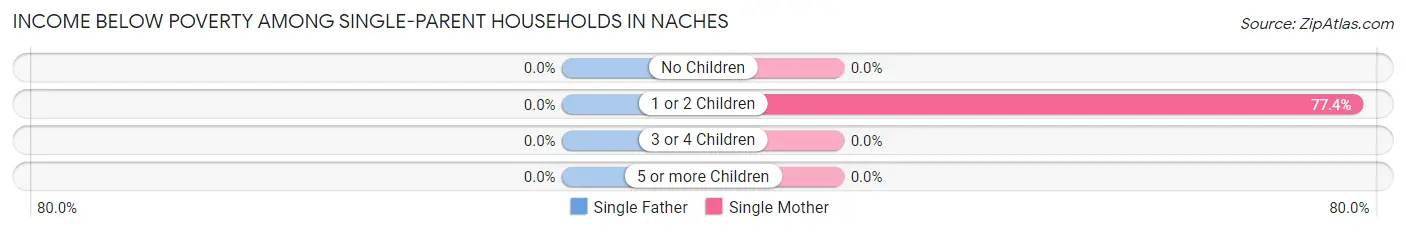
| Children | Single Father | Single Mother |
| No Children | 0 (0.0%) | 0 (0.0%) |
| 1 or 2 Children | 0 (0.0%) | 24 (77.4%) |
| 3 or 4 Children | 0 (0.0%) | 0 (0.0%) |
| 5 or more Children | 0 (0.0%) | 0 (0.0%) |
| Total | 0 (0.0%) | 24 (39.3%) |
Income Below Poverty Among Married-Couple vs Single-Parent Households in Naches
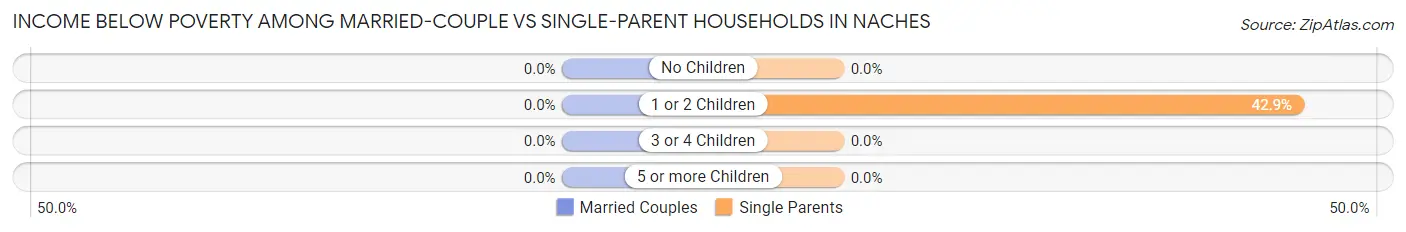
| Children | Married-Couple Families | Single-Parent Households |
| No Children | 0 (0.0%) | 0 (0.0%) |
| 1 or 2 Children | 0 (0.0%) | 24 (42.9%) |
| 3 or 4 Children | 0 (0.0%) | 0 (0.0%) |
| 5 or more Children | 0 (0.0%) | 0 (0.0%) |
| Total | 0 (0.0%) | 24 (27.3%) |
Race in Naches
The most populous races in Naches are White / Caucasian (640 | 78.6%), Hispanic or Latino (138 | 17.0%), and Some other Race (88 | 10.8%).
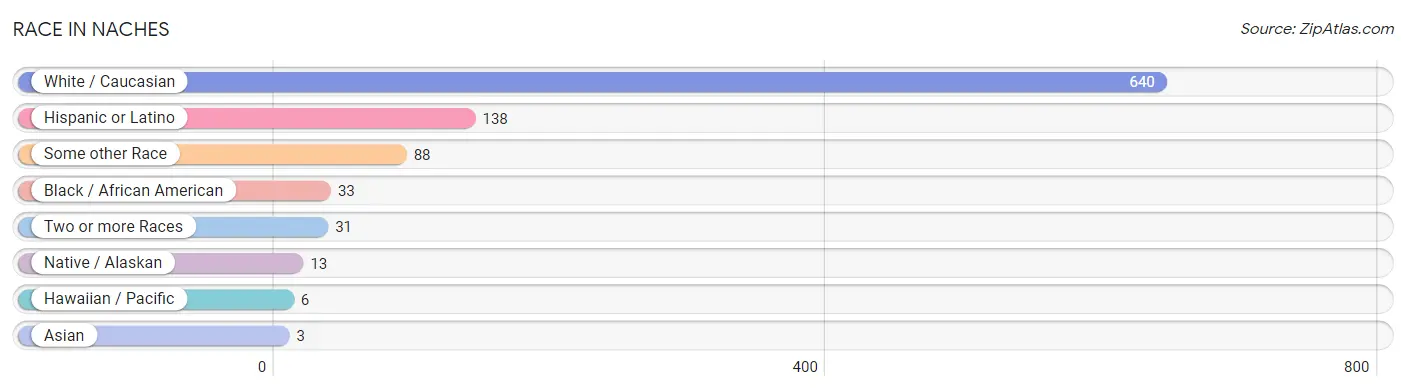
| Race | # Population | % Population |
| Asian | 3 | 0.4% |
| Black / African American | 33 | 4.1% |
| Hawaiian / Pacific | 6 | 0.7% |
| Hispanic or Latino | 138 | 17.0% |
| Native / Alaskan | 13 | 1.6% |
| White / Caucasian | 640 | 78.6% |
| Two or more Races | 31 | 3.8% |
| Some other Race | 88 | 10.8% |
| Total | 814 | 100.0% |
Ancestry in Naches
The most populous ancestries reported in Naches are German (146 | 17.9%), Mexican (138 | 17.0%), European (75 | 9.2%), American (61 | 7.5%), and Irish (38 | 4.7%), together accounting for 56.3% of all Naches residents.
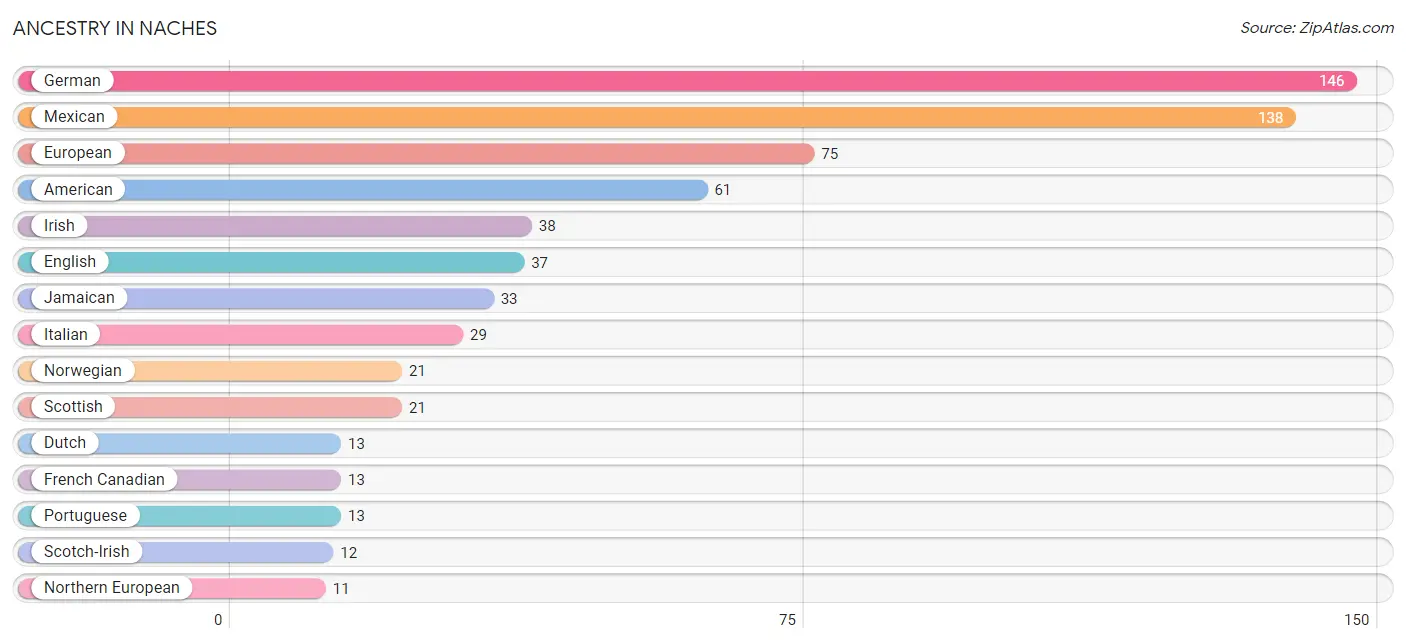
| Ancestry | # Population | % Population |
| American | 61 | 7.5% |
| Bhutanese | 4 | 0.5% |
| British | 6 | 0.7% |
| Burmese | 3 | 0.4% |
| Croatian | 4 | 0.5% |
| Czech | 3 | 0.4% |
| Danish | 5 | 0.6% |
| Dutch | 13 | 1.6% |
| English | 37 | 4.5% |
| European | 75 | 9.2% |
| French | 8 | 1.0% |
| French Canadian | 13 | 1.6% |
| German | 146 | 17.9% |
| Irish | 38 | 4.7% |
| Italian | 29 | 3.6% |
| Jamaican | 33 | 4.1% |
| Mexican | 138 | 17.0% |
| Mexican American Indian | 5 | 0.6% |
| Native Hawaiian | 6 | 0.7% |
| Northern European | 11 | 1.3% |
| Norwegian | 21 | 2.6% |
| Polish | 2 | 0.3% |
| Portuguese | 13 | 1.6% |
| Scandinavian | 6 | 0.7% |
| Scotch-Irish | 12 | 1.5% |
| Scottish | 21 | 2.6% |
| Swedish | 10 | 1.2% |
| Swiss | 7 | 0.9% |
| Ukrainian | 1 | 0.1% |
| Welsh | 3 | 0.4% | View All 30 Rows |
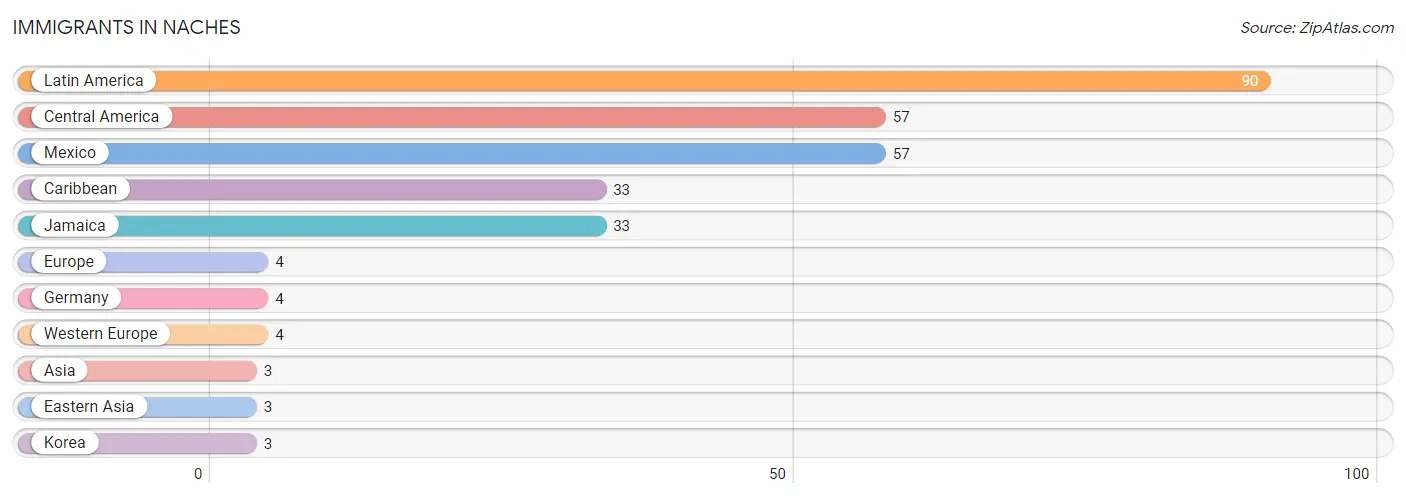
Immigrants in Naches
The most numerous immigrant groups reported in Naches came from Latin America (90 | 11.1%), Central America (57 | 7.0%), Mexico (57 | 7.0%), Caribbean (33 | 4.1%), and Jamaica (33 | 4.1%), together accounting for 33.2% of all Naches residents.
| Immigration Origin | # Population | % Population |
| Asia | 3 | 0.4% |
| Caribbean | 33 | 4.1% |
| Central America | 57 | 7.0% |
| Eastern Asia | 3 | 0.4% |
| Europe | 4 | 0.5% |
| Germany | 4 | 0.5% |
| Jamaica | 33 | 4.1% |
| Korea | 3 | 0.4% |
| Latin America | 90 | 11.1% |
| Mexico | 57 | 7.0% |
| Western Europe | 4 | 0.5% | View All 11 Rows |
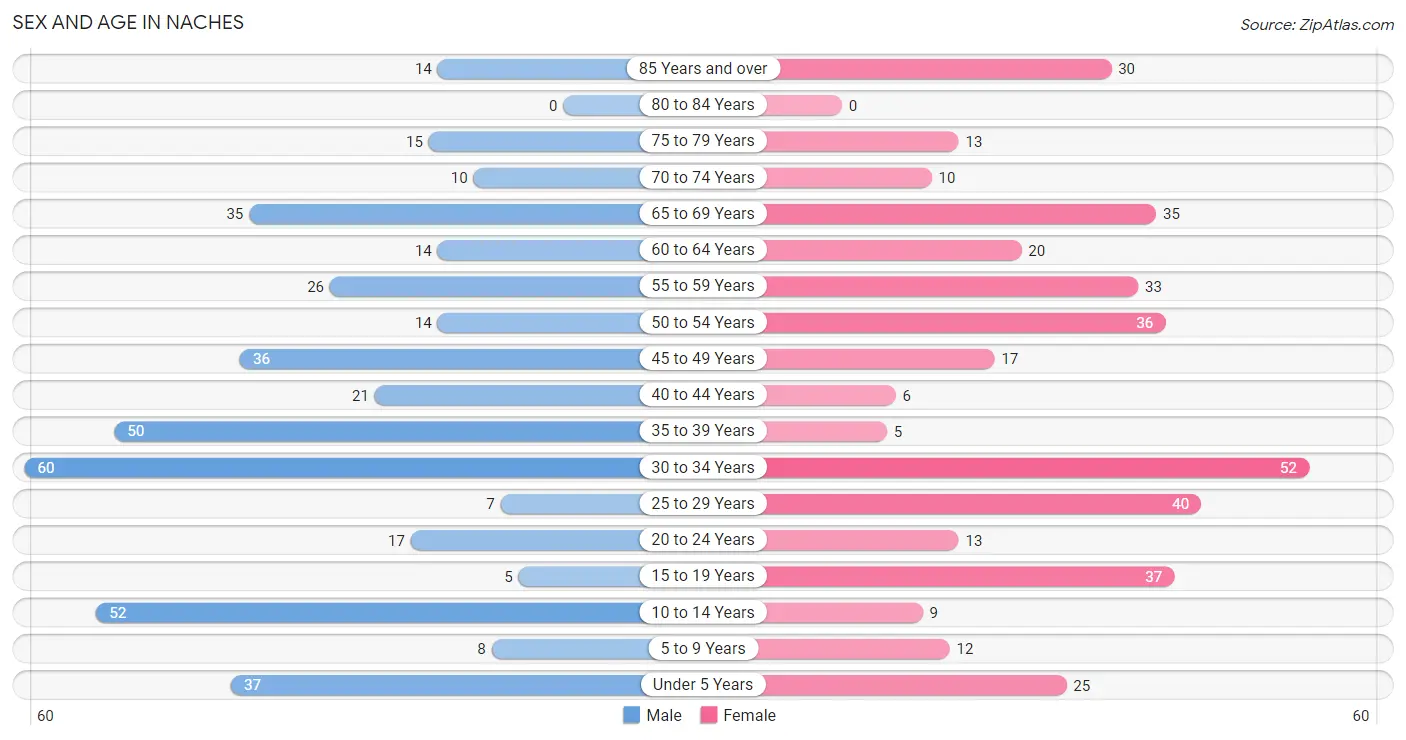
Sex and Age in Naches
Sex and Age in Naches
The most populous age groups in Naches are 30 to 34 Years (60 | 14.2%) for men and 30 to 34 Years (52 | 13.2%) for women.
| Age Bracket | Male | Female |
| Under 5 Years | 37 (8.8%) | 25 (6.4%) |
| 5 to 9 Years | 8 (1.9%) | 12 (3.0%) |
| 10 to 14 Years | 52 (12.3%) | 9 (2.3%) |
| 15 to 19 Years | 5 (1.2%) | 37 (9.4%) |
| 20 to 24 Years | 17 (4.0%) | 13 (3.3%) |
| 25 to 29 Years | 7 (1.7%) | 40 (10.2%) |
| 30 to 34 Years | 60 (14.2%) | 52 (13.2%) |
| 35 to 39 Years | 50 (11.9%) | 5 (1.3%) |
| 40 to 44 Years | 21 (5.0%) | 6 (1.5%) |
| 45 to 49 Years | 36 (8.6%) | 17 (4.3%) |
| 50 to 54 Years | 14 (3.3%) | 36 (9.2%) |
| 55 to 59 Years | 26 (6.2%) | 33 (8.4%) |
| 60 to 64 Years | 14 (3.3%) | 20 (5.1%) |
| 65 to 69 Years | 35 (8.3%) | 35 (8.9%) |
| 70 to 74 Years | 10 (2.4%) | 10 (2.5%) |
| 75 to 79 Years | 15 (3.6%) | 13 (3.3%) |
| 80 to 84 Years | 0 (0.0%) | 0 (0.0%) |
| 85 Years and over | 14 (3.3%) | 30 (7.6%) |
| Total | 421 (100.0%) | 393 (100.0%) |
Families and Households in Naches
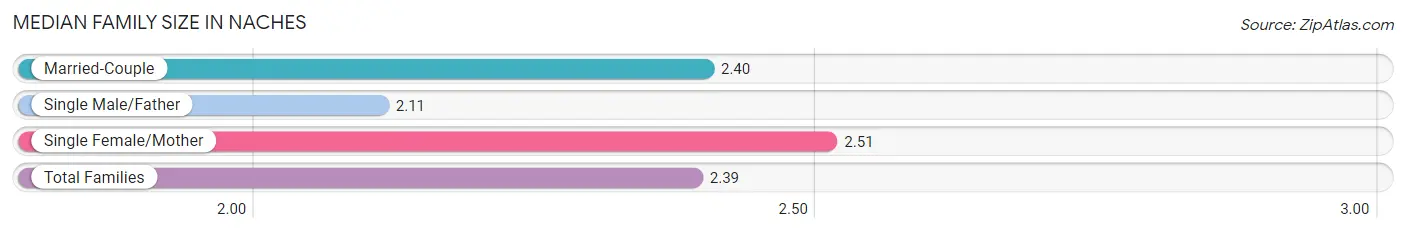
Median Family Size in Naches
The median family size in Naches is 2.39 persons per family, with single female/mother families (61 | 25.3%) accounting for the largest median family size of 2.51 persons per family. On the other hand, single male/father families (27 | 11.2%) represent the smallest median family size with 2.11 persons per family.
| Family Type | # Families | Family Size |
| Married-Couple | 153 (63.5%) | 2.40 |
| Single Male/Father | 27 (11.2%) | 2.11 |
| Single Female/Mother | 61 (25.3%) | 2.51 |
| Total Families | 241 (100.0%) | 2.39 |
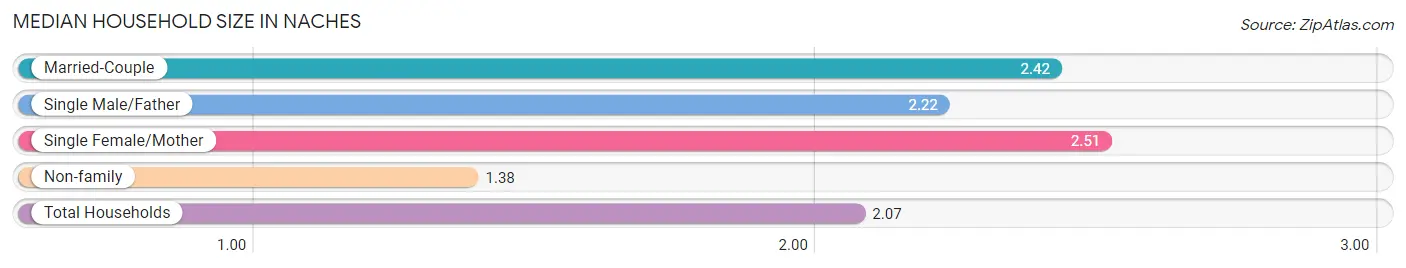
Median Household Size in Naches
The median household size in Naches is 2.07 persons per household, with single female/mother households (61 | 16.9%) accounting for the largest median household size of 2.51 persons per household. non-family households (120 | 33.2%) represent the smallest median household size with 1.38 persons per household.
| Household Type | # Households | Household Size |
| Married-Couple | 153 (42.4%) | 2.42 |
| Single Male/Father | 27 (7.5%) | 2.22 |
| Single Female/Mother | 61 (16.9%) | 2.51 |
| Non-family | 120 (33.2%) | 1.38 |
| Total Households | 361 (100.0%) | 2.07 |
Household Size by Marriage Status in Naches
Out of a total of 361 households in Naches, 241 (66.8%) are family households, while 120 (33.2%) are nonfamily households. The most numerous type of family households are 2-person households, comprising 173, and the most common type of nonfamily households are 1-person households, comprising 104.
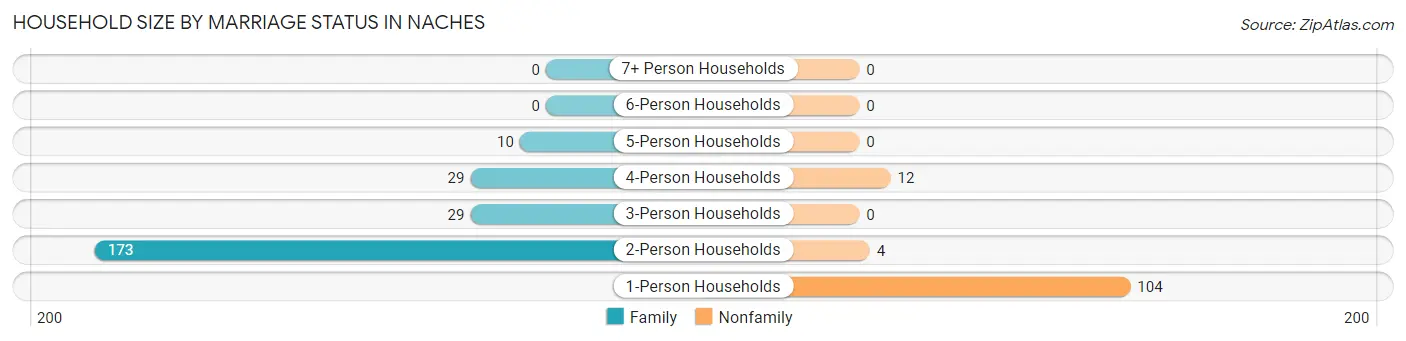
| Household Size | Family Households | Nonfamily Households |
| 1-Person Households | - | 104 (28.8%) |
| 2-Person Households | 173 (47.9%) | 4 (1.1%) |
| 3-Person Households | 29 (8.0%) | 0 (0.0%) |
| 4-Person Households | 29 (8.0%) | 12 (3.3%) |
| 5-Person Households | 10 (2.8%) | 0 (0.0%) |
| 6-Person Households | 0 (0.0%) | 0 (0.0%) |
| 7+ Person Households | 0 (0.0%) | 0 (0.0%) |
| Total | 241 (66.8%) | 120 (33.2%) |
Female Fertility in Naches
Fertility by Age in Naches
Average fertility rate in Naches is 52.0 births per 1,000 women. Women in the age bracket of 20 to 34 years have the highest fertility rate with 86.0 births per 1,000 women. Women in the age bracket of 20 to 34 years acount for 100.0% of all women with births.
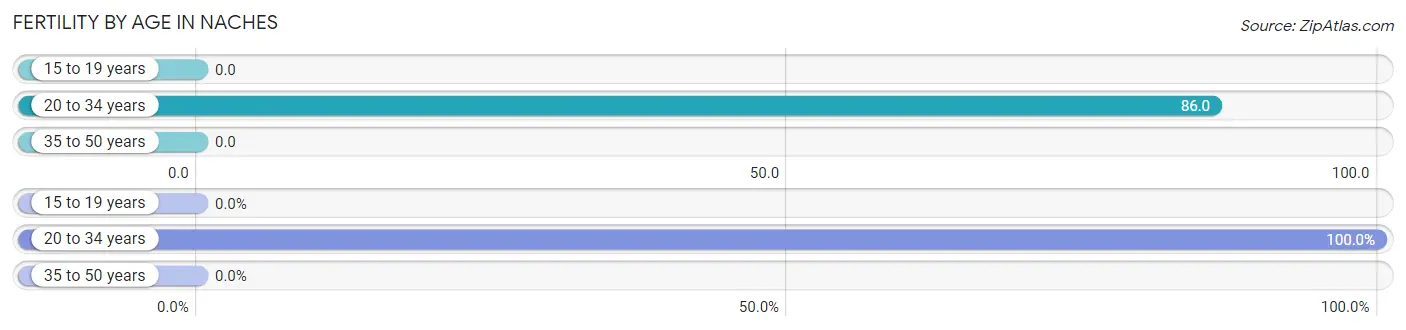
| Age Bracket | Women with Births | Births / 1,000 Women |
| 15 to 19 years | 0 (0.0%) | 0.0 |
| 20 to 34 years | 9 (100.0%) | 86.0 |
| 35 to 50 years | 0 (0.0%) | 0.0 |
| Total | 9 (100.0%) | 52.0 |
Fertility by Age by Marriage Status in Naches
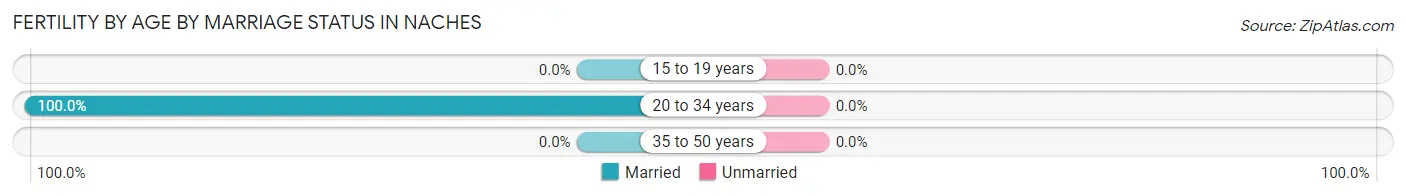
| Age Bracket | Married | Unmarried |
| 15 to 19 years | 0 (0.0%) | 0 (0.0%) |
| 20 to 34 years | 9 (100.0%) | 0 (0.0%) |
| 35 to 50 years | 0 (0.0%) | 0 (0.0%) |
| Total | 9 (100.0%) | 0 (0.0%) |
Fertility by Education in Naches
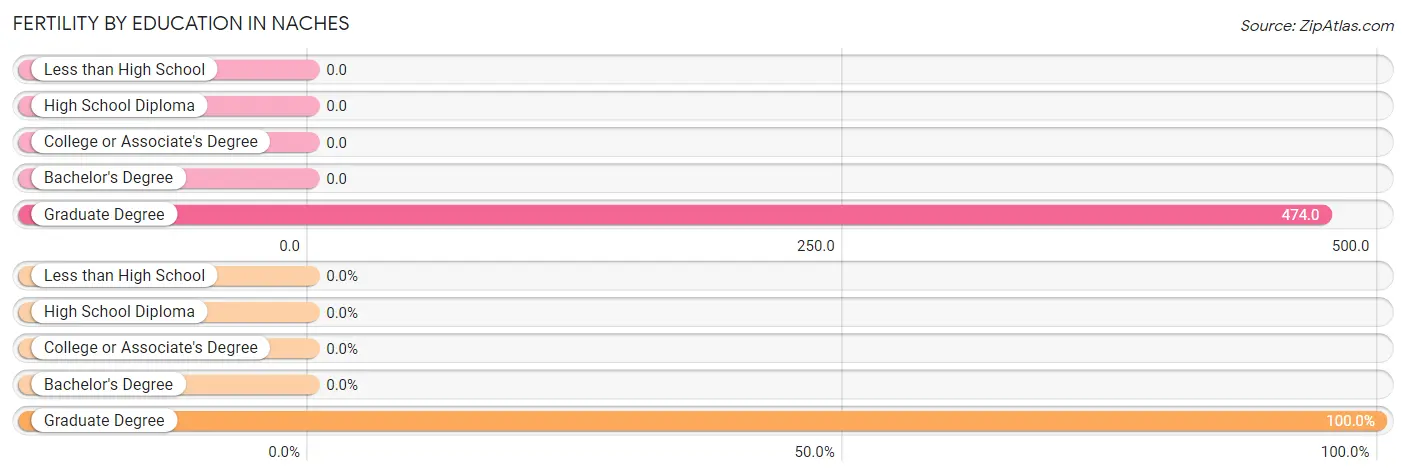
| Educational Attainment | Women with Births | Births / 1,000 Women |
| Less than High School | 0 (0.0%) | 0.0 |
| High School Diploma | 0 (0.0%) | 0.0 |
| College or Associate's Degree | 0 (0.0%) | 0.0 |
| Bachelor's Degree | 0 (0.0%) | 0.0 |
| Graduate Degree | 9 (100.0%) | 474.0 |
| Total | 9 (100.0%) | 52.0 |
Fertility by Education by Marriage Status in Naches
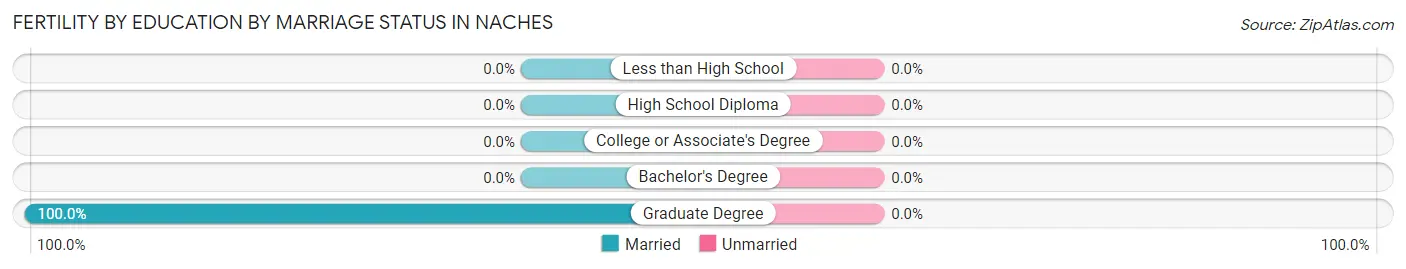
| Educational Attainment | Married | Unmarried |
| Less than High School | 0 (0.0%) | 0 (0.0%) |
| High School Diploma | 0 (0.0%) | 0 (0.0%) |
| College or Associate's Degree | 0 (0.0%) | 0 (0.0%) |
| Bachelor's Degree | 0 (0.0%) | 0 (0.0%) |
| Graduate Degree | 9 (100.0%) | 0 (0.0%) |
| Total | 9 (100.0%) | 0 (0.0%) |
Employment Characteristics in Naches
Employment by Class of Employer in Naches
Among the 396 employed individuals in Naches, private company employees (242 | 61.1%), local government employees (57 | 14.4%), and not-for-profit organizations (37 | 9.3%) make up the most common classes of employment.
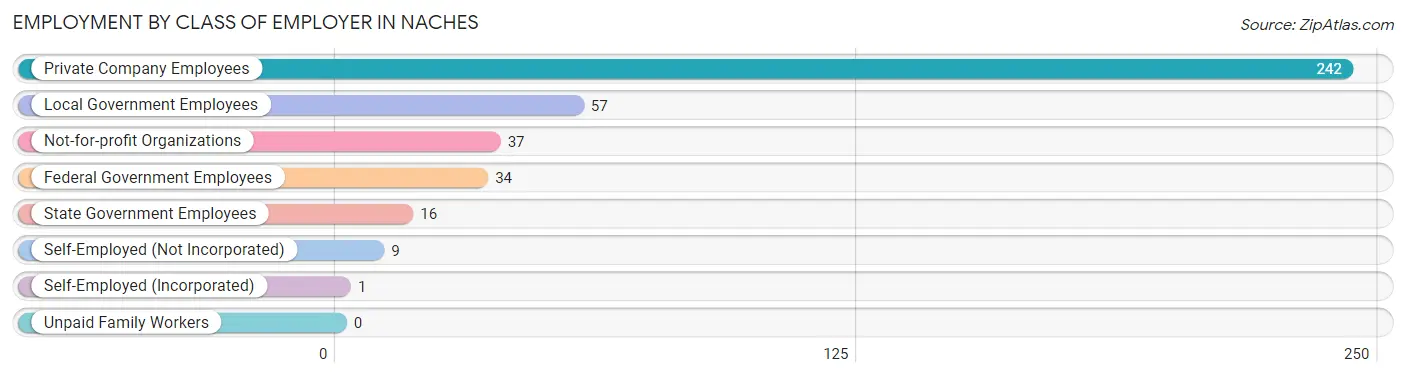
| Employer Class | # Employees | % Employees |
| Private Company Employees | 242 | 61.1% |
| Self-Employed (Incorporated) | 1 | 0.3% |
| Self-Employed (Not Incorporated) | 9 | 2.3% |
| Not-for-profit Organizations | 37 | 9.3% |
| Local Government Employees | 57 | 14.4% |
| State Government Employees | 16 | 4.0% |
| Federal Government Employees | 34 | 8.6% |
| Unpaid Family Workers | 0 | 0.0% |
| Total | 396 | 100.0% |
Employment Status by Age in Naches
According to the labor force statistics for Naches, out of the total population over 16 years of age (655), 66.4% or 435 individuals are in the labor force, with 5.7% or 25 of them unemployed. The age group with the highest labor force participation rate is 30 to 34 years, with 99.1% or 111 individuals in the labor force. Within the labor force, the 16 to 19 years age range has the highest percentage of unemployed individuals, with 100.0% or 2 of them being unemployed.
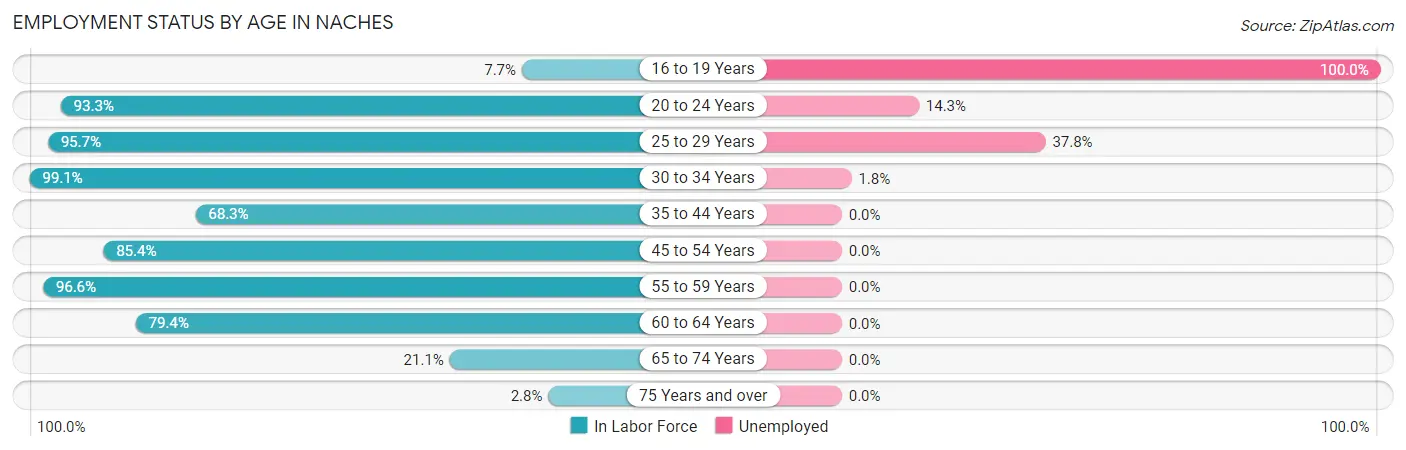
| Age Bracket | In Labor Force | Unemployed |
| 16 to 19 Years | 2 (7.7%) | 2 (100.0%) |
| 20 to 24 Years | 28 (93.3%) | 4 (14.3%) |
| 25 to 29 Years | 45 (95.7%) | 17 (37.8%) |
| 30 to 34 Years | 111 (99.1%) | 2 (1.8%) |
| 35 to 44 Years | 56 (68.3%) | 0 (0.0%) |
| 45 to 54 Years | 88 (85.4%) | 0 (0.0%) |
| 55 to 59 Years | 57 (96.6%) | 0 (0.0%) |
| 60 to 64 Years | 27 (79.4%) | 0 (0.0%) |
| 65 to 74 Years | 19 (21.1%) | 0 (0.0%) |
| 75 Years and over | 2 (2.8%) | 0 (0.0%) |
| Total | 435 (66.4%) | 25 (5.7%) |
Employment Status by Educational Attainment in Naches
According to labor force statistics for Naches, 87.9% of individuals (384) out of the total population between 25 and 64 years of age (437) are in the labor force, with 4.9% or 19 of them being unemployed. The group with the highest labor force participation rate are those with the educational attainment of less than high school, with 100.0% or 46 individuals in the labor force. Within the labor force, individuals with college / associate degree education have the highest percentage of unemployment, with 14.0% or 19 of them being unemployed.
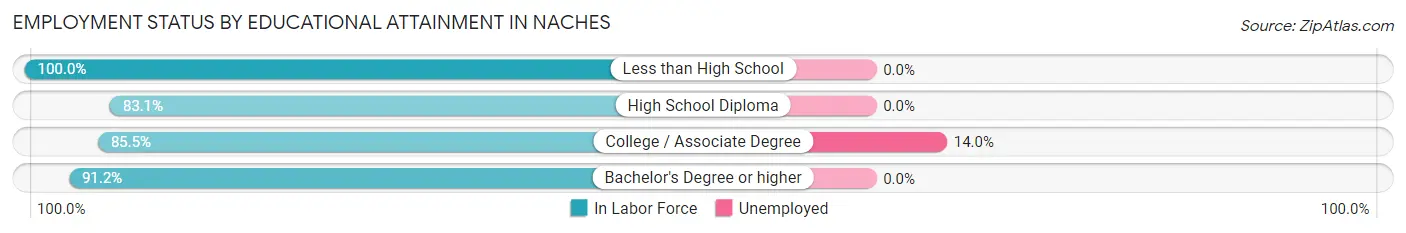
| Educational Attainment | In Labor Force | Unemployed |
| Less than High School | 46 (100.0%) | 0 (0.0%) |
| High School Diploma | 98 (83.1%) | 0 (0.0%) |
| College / Associate Degree | 136 (85.5%) | 22 (14.0%) |
| Bachelor's Degree or higher | 104 (91.2%) | 0 (0.0%) |
| Total | 384 (87.9%) | 21 (4.9%) |
Employment Occupations by Sex in Naches
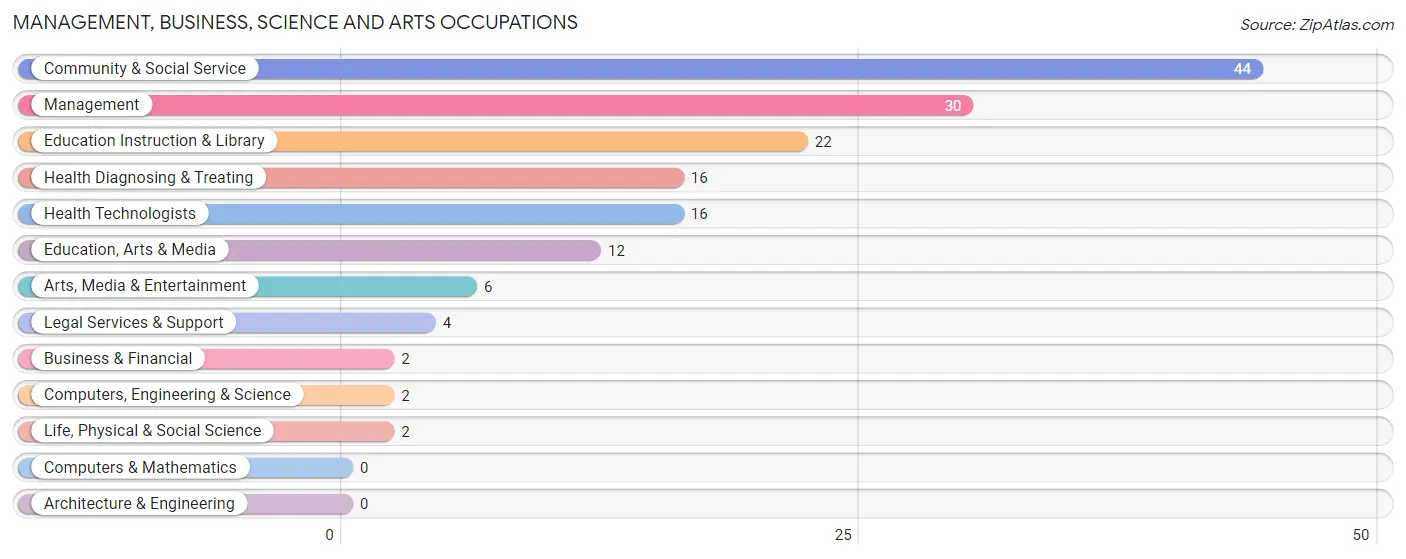
Management, Business, Science and Arts Occupations
The most common Management, Business, Science and Arts occupations in Naches are Community & Social Service (44 | 10.7%), Management (30 | 7.3%), Education Instruction & Library (22 | 5.4%), Health Diagnosing & Treating (16 | 3.9%), and Health Technologists (16 | 3.9%).
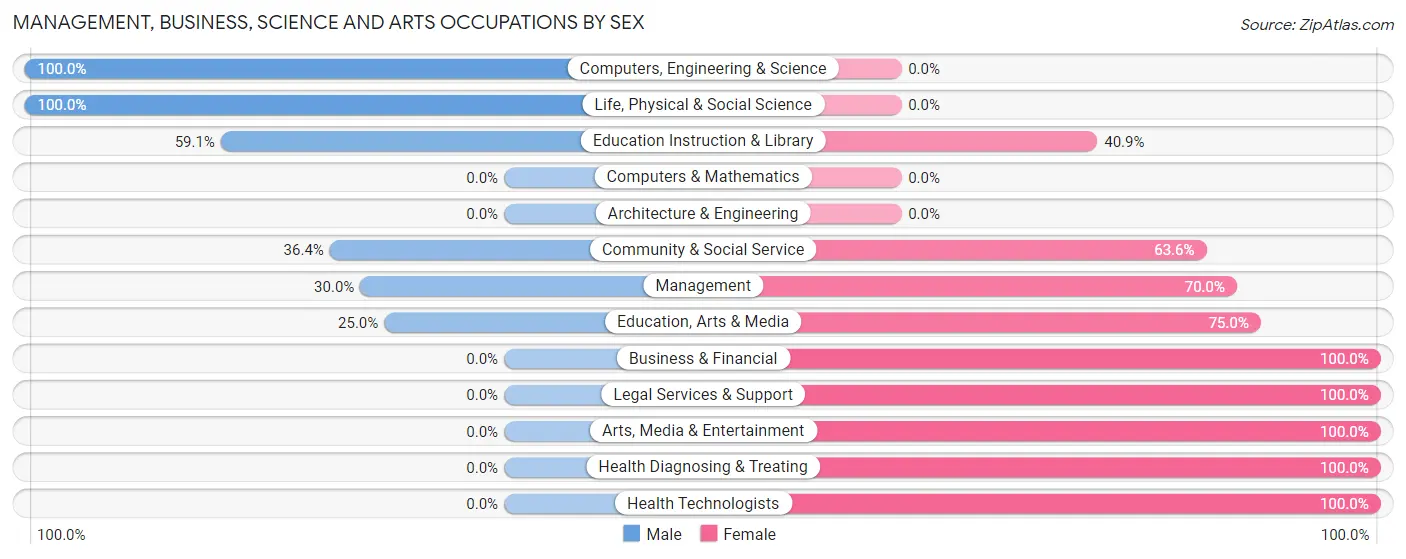
Management, Business, Science and Arts Occupations by Sex
Within the Management, Business, Science and Arts occupations in Naches, the most male-oriented occupations are Computers, Engineering & Science (100.0%), Life, Physical & Social Science (100.0%), and Education Instruction & Library (59.1%), while the most female-oriented occupations are Business & Financial (100.0%), Legal Services & Support (100.0%), and Arts, Media & Entertainment (100.0%).
| Occupation | Male | Female |
| Management | 9 (30.0%) | 21 (70.0%) |
| Business & Financial | 0 (0.0%) | 2 (100.0%) |
| Computers, Engineering & Science | 2 (100.0%) | 0 (0.0%) |
| Computers & Mathematics | 0 (0.0%) | 0 (0.0%) |
| Architecture & Engineering | 0 (0.0%) | 0 (0.0%) |
| Life, Physical & Social Science | 2 (100.0%) | 0 (0.0%) |
| Community & Social Service | 16 (36.4%) | 28 (63.6%) |
| Education, Arts & Media | 3 (25.0%) | 9 (75.0%) |
| Legal Services & Support | 0 (0.0%) | 4 (100.0%) |
| Education Instruction & Library | 13 (59.1%) | 9 (40.9%) |
| Arts, Media & Entertainment | 0 (0.0%) | 6 (100.0%) |
| Health Diagnosing & Treating | 0 (0.0%) | 16 (100.0%) |
| Health Technologists | 0 (0.0%) | 16 (100.0%) |
| Total (Category) | 27 (28.7%) | 67 (71.3%) |
| Total (Overall) | 232 (56.6%) | 178 (43.4%) |
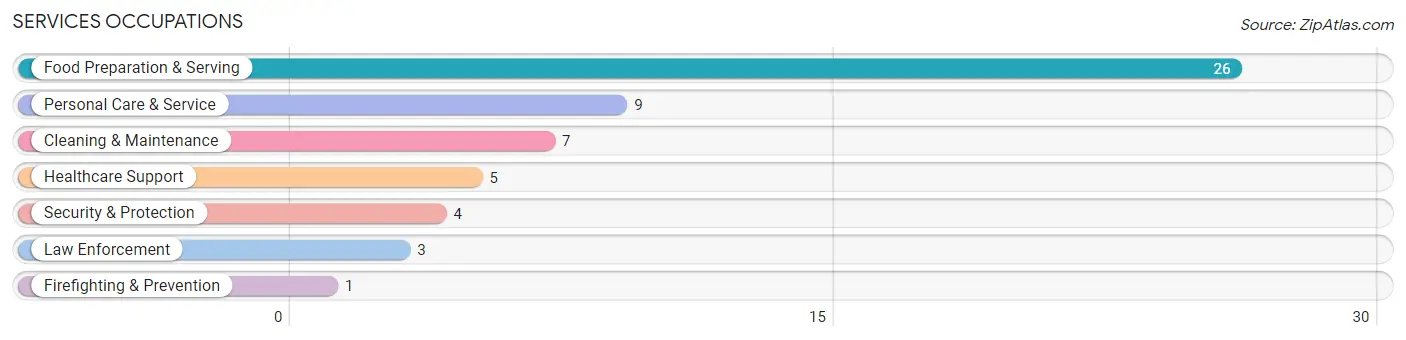
Services Occupations
The most common Services occupations in Naches are Food Preparation & Serving (26 | 6.3%), Personal Care & Service (9 | 2.2%), Cleaning & Maintenance (7 | 1.7%), Healthcare Support (5 | 1.2%), and Security & Protection (4 | 1.0%).
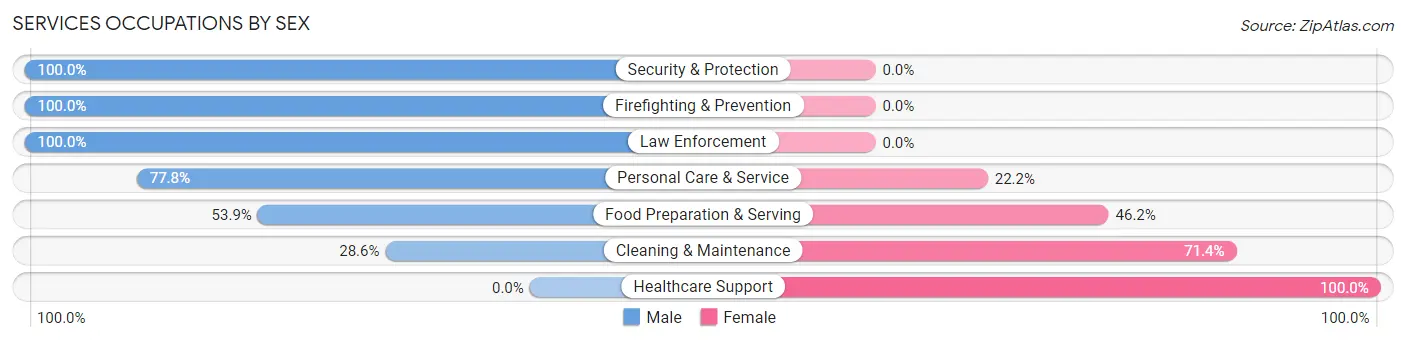
Services Occupations by Sex
Within the Services occupations in Naches, the most male-oriented occupations are Security & Protection (100.0%), Firefighting & Prevention (100.0%), and Law Enforcement (100.0%), while the most female-oriented occupations are Healthcare Support (100.0%), Cleaning & Maintenance (71.4%), and Food Preparation & Serving (46.2%).
| Occupation | Male | Female |
| Healthcare Support | 0 (0.0%) | 5 (100.0%) |
| Security & Protection | 4 (100.0%) | 0 (0.0%) |
| Firefighting & Prevention | 1 (100.0%) | 0 (0.0%) |
| Law Enforcement | 3 (100.0%) | 0 (0.0%) |
| Food Preparation & Serving | 14 (53.8%) | 12 (46.2%) |
| Cleaning & Maintenance | 2 (28.6%) | 5 (71.4%) |
| Personal Care & Service | 7 (77.8%) | 2 (22.2%) |
| Total (Category) | 27 (52.9%) | 24 (47.1%) |
| Total (Overall) | 232 (56.6%) | 178 (43.4%) |
Sales and Office Occupations
The most common Sales and Office occupations in Naches are Office & Administration (52 | 12.7%), and Sales & Related (23 | 5.6%).

Sales and Office Occupations by Sex
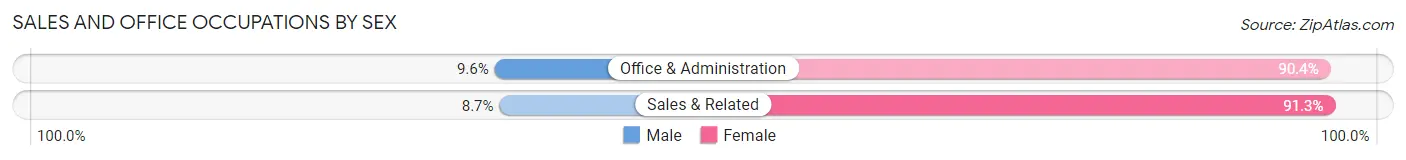
| Occupation | Male | Female |
| Sales & Related | 2 (8.7%) | 21 (91.3%) |
| Office & Administration | 5 (9.6%) | 47 (90.4%) |
| Total (Category) | 7 (9.3%) | 68 (90.7%) |
| Total (Overall) | 232 (56.6%) | 178 (43.4%) |
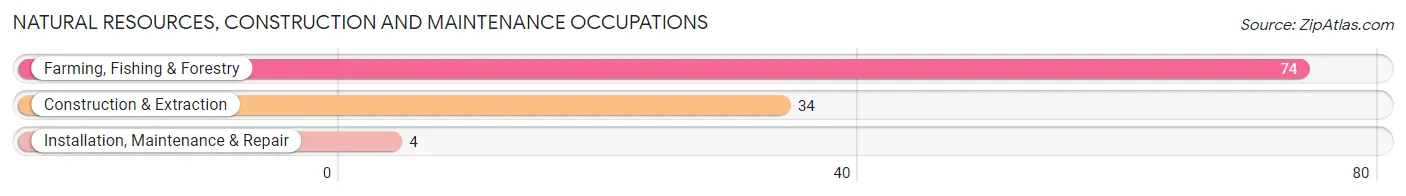
Natural Resources, Construction and Maintenance Occupations
The most common Natural Resources, Construction and Maintenance occupations in Naches are Farming, Fishing & Forestry (74 | 18.0%), Construction & Extraction (34 | 8.3%), and Installation, Maintenance & Repair (4 | 1.0%).
Natural Resources, Construction and Maintenance Occupations by Sex
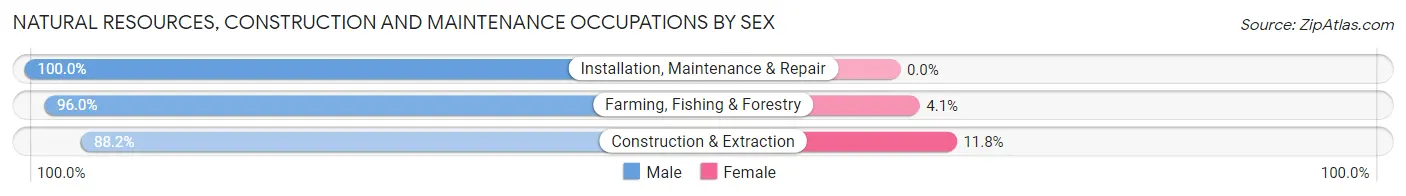
| Occupation | Male | Female |
| Farming, Fishing & Forestry | 71 (96.0%) | 3 (4.1%) |
| Construction & Extraction | 30 (88.2%) | 4 (11.8%) |
| Installation, Maintenance & Repair | 4 (100.0%) | 0 (0.0%) |
| Total (Category) | 105 (93.8%) | 7 (6.2%) |
| Total (Overall) | 232 (56.6%) | 178 (43.4%) |
Production, Transportation and Moving Occupations
The most common Production, Transportation and Moving occupations in Naches are Production (38 | 9.3%), Transportation (31 | 7.6%), and Material Moving (9 | 2.2%).
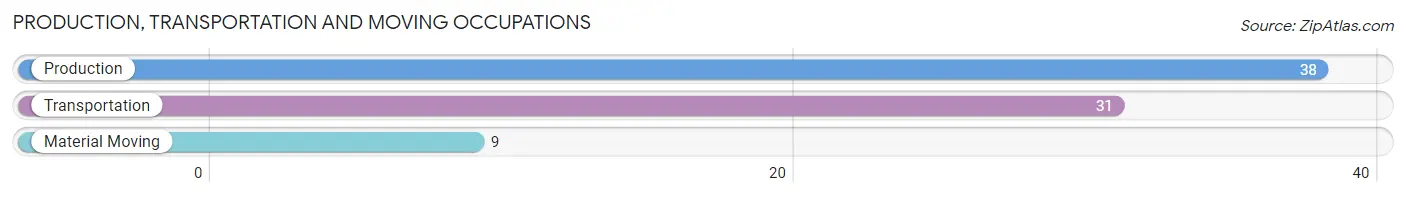
Production, Transportation and Moving Occupations by Sex
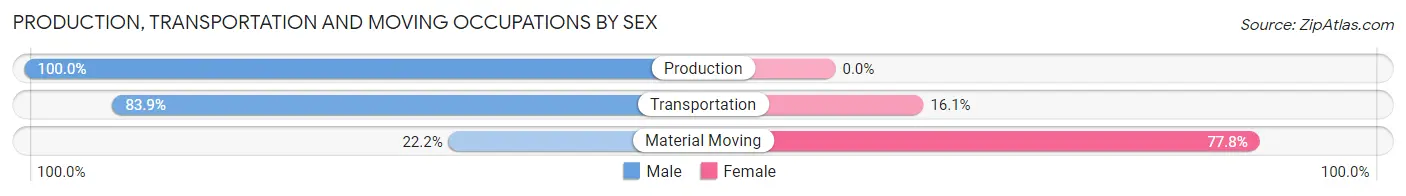
| Occupation | Male | Female |
| Production | 38 (100.0%) | 0 (0.0%) |
| Transportation | 26 (83.9%) | 5 (16.1%) |
| Material Moving | 2 (22.2%) | 7 (77.8%) |
| Total (Category) | 66 (84.6%) | 12 (15.4%) |
| Total (Overall) | 232 (56.6%) | 178 (43.4%) |
Employment Industries by Sex in Naches
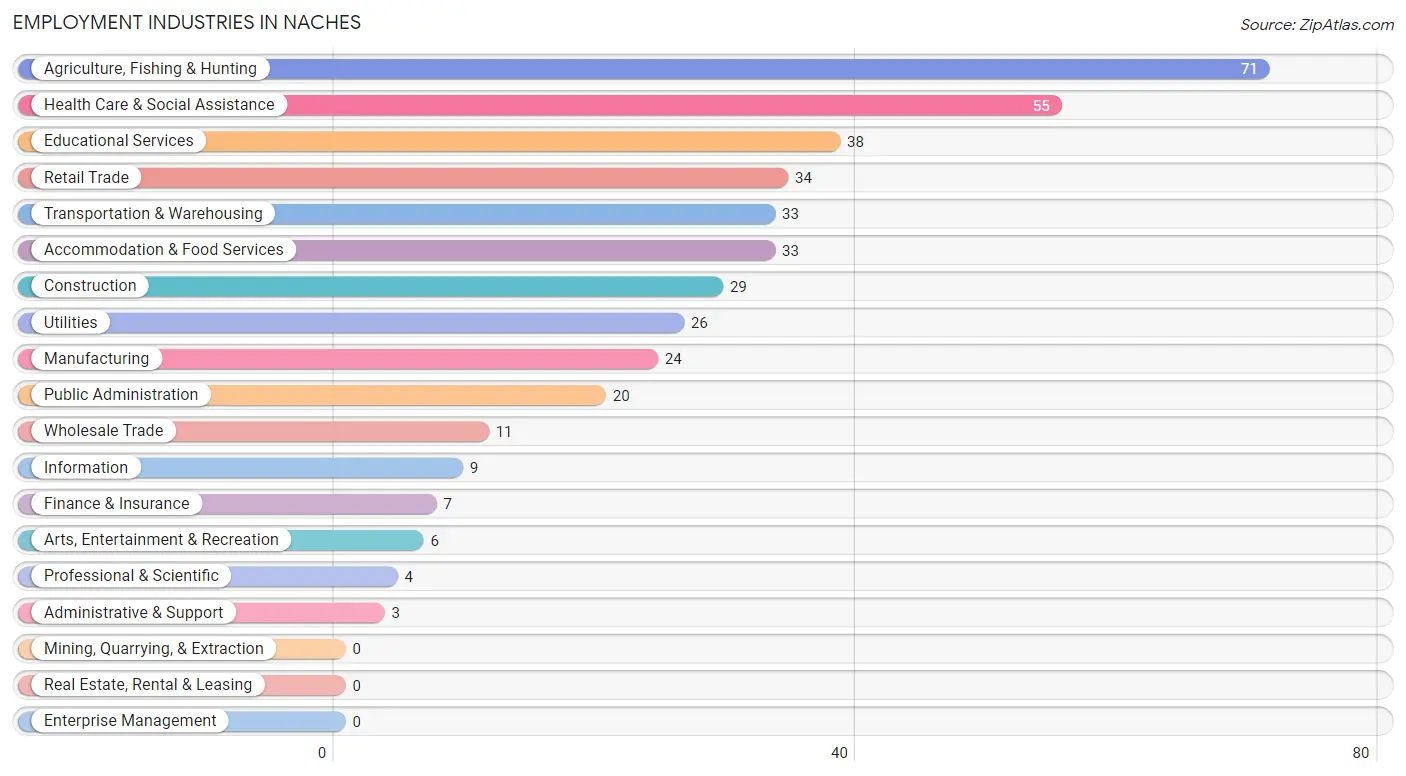
Employment Industries in Naches
The major employment industries in Naches include Agriculture, Fishing & Hunting (71 | 17.3%), Health Care & Social Assistance (55 | 13.4%), Educational Services (38 | 9.3%), Retail Trade (34 | 8.3%), and Transportation & Warehousing (33 | 8.1%).
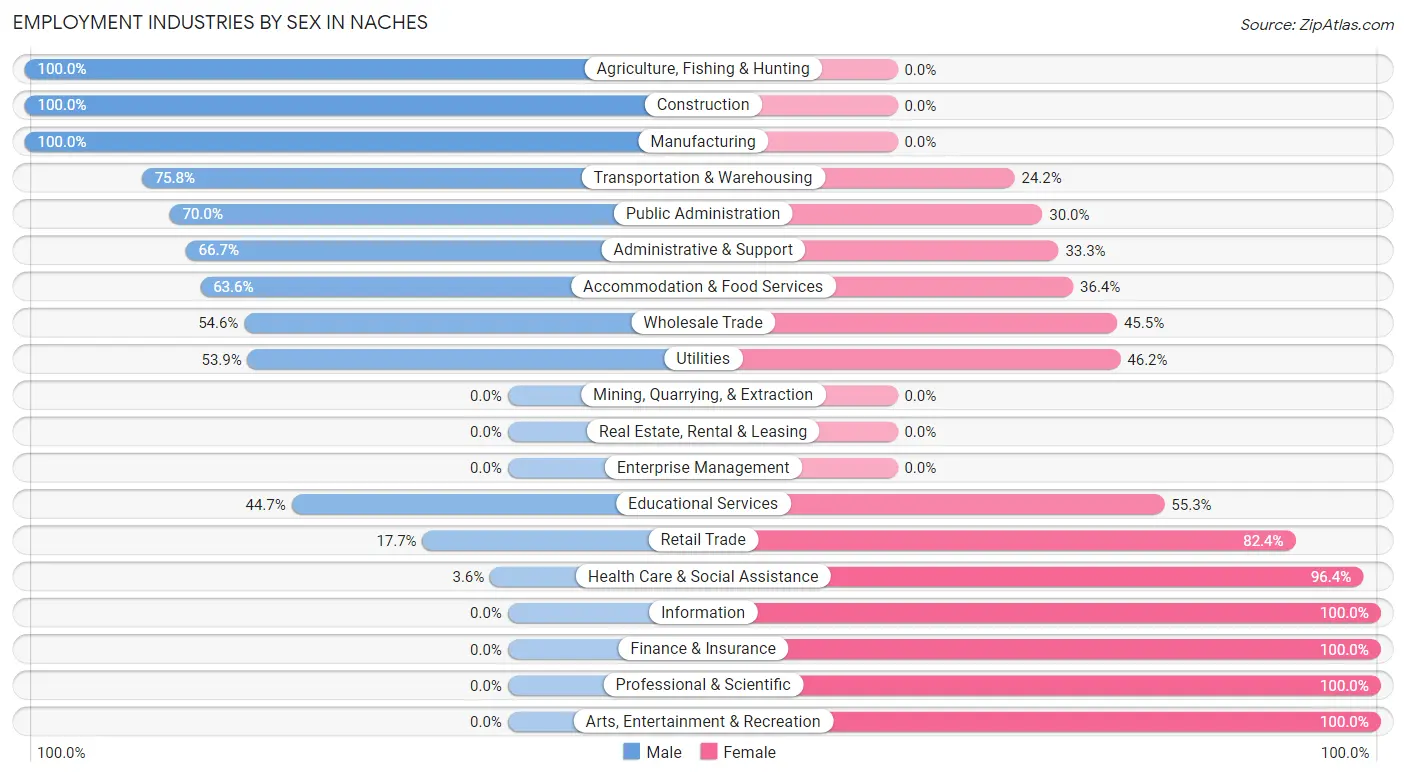
Employment Industries by Sex in Naches
The Naches industries that see more men than women are Agriculture, Fishing & Hunting (100.0%), Construction (100.0%), and Manufacturing (100.0%), whereas the industries that tend to have a higher number of women are Information (100.0%), Finance & Insurance (100.0%), and Professional & Scientific (100.0%).
| Industry | Male | Female |
| Agriculture, Fishing & Hunting | 71 (100.0%) | 0 (0.0%) |
| Mining, Quarrying, & Extraction | 0 (0.0%) | 0 (0.0%) |
| Construction | 29 (100.0%) | 0 (0.0%) |
| Manufacturing | 24 (100.0%) | 0 (0.0%) |
| Wholesale Trade | 6 (54.5%) | 5 (45.5%) |
| Retail Trade | 6 (17.6%) | 28 (82.4%) |
| Transportation & Warehousing | 25 (75.8%) | 8 (24.2%) |
| Utilities | 14 (53.8%) | 12 (46.2%) |
| Information | 0 (0.0%) | 9 (100.0%) |
| Finance & Insurance | 0 (0.0%) | 7 (100.0%) |
| Real Estate, Rental & Leasing | 0 (0.0%) | 0 (0.0%) |
| Professional & Scientific | 0 (0.0%) | 4 (100.0%) |
| Enterprise Management | 0 (0.0%) | 0 (0.0%) |
| Administrative & Support | 2 (66.7%) | 1 (33.3%) |
| Educational Services | 17 (44.7%) | 21 (55.3%) |
| Health Care & Social Assistance | 2 (3.6%) | 53 (96.4%) |
| Arts, Entertainment & Recreation | 0 (0.0%) | 6 (100.0%) |
| Accommodation & Food Services | 21 (63.6%) | 12 (36.4%) |
| Public Administration | 14 (70.0%) | 6 (30.0%) |
| Total | 232 (56.6%) | 178 (43.4%) |
Education in Naches
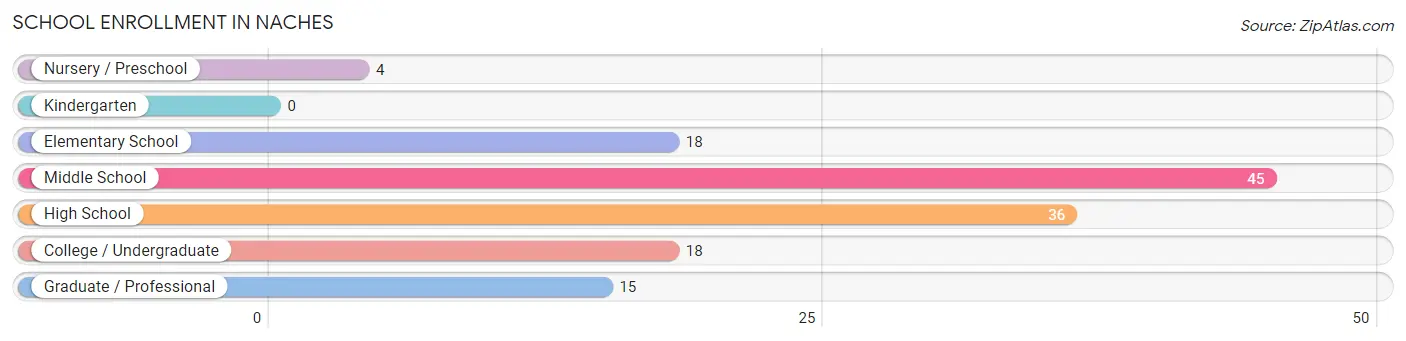
School Enrollment in Naches
The most common levels of schooling among the 136 students in Naches are middle school (45 | 33.1%), high school (36 | 26.5%), and elementary school (18 | 13.2%).
| School Level | # Students | % Students |
| Nursery / Preschool | 4 | 2.9% |
| Kindergarten | 0 | 0.0% |
| Elementary School | 18 | 13.2% |
| Middle School | 45 | 33.1% |
| High School | 36 | 26.5% |
| College / Undergraduate | 18 | 13.2% |
| Graduate / Professional | 15 | 11.0% |
| Total | 136 | 100.0% |
School Enrollment by Age by Funding Source in Naches
Out of a total of 136 students who are enrolled in schools in Naches, 29 (21.3%) attend a private institution, while the remaining 107 (78.7%) are enrolled in public schools. The age group of 3 to 4 year olds has the highest likelihood of being enrolled in private schools, with 4 (100.0% in the age bracket) enrolled. Conversely, the age group of 5 to 9 year old has the lowest likelihood of being enrolled in a private school, with 5 (100.0% in the age bracket) attending a public institution.
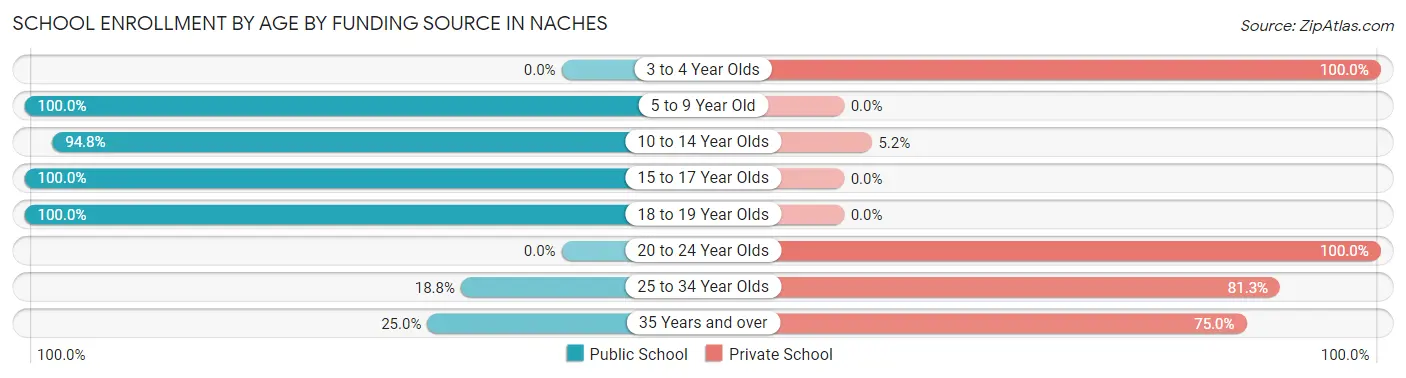
| Age Bracket | Public School | Private School |
| 3 to 4 Year Olds | 0 (0.0%) | 4 (100.0%) |
| 5 to 9 Year Old | 5 (100.0%) | 0 (0.0%) |
| 10 to 14 Year Olds | 55 (94.8%) | 3 (5.2%) |
| 15 to 17 Year Olds | 30 (100.0%) | 0 (0.0%) |
| 18 to 19 Year Olds | 12 (100.0%) | 0 (0.0%) |
| 20 to 24 Year Olds | 0 (0.0%) | 3 (100.0%) |
| 25 to 34 Year Olds | 3 (18.8%) | 13 (81.2%) |
| 35 Years and over | 2 (25.0%) | 6 (75.0%) |
| Total | 107 (78.7%) | 29 (21.3%) |
Educational Attainment by Field of Study in Naches
Science & technology (53 | 32.5%), education (29 | 17.8%), business (17 | 10.4%), psychology (14 | 8.6%), and arts & humanities (13 | 8.0%) are the most common fields of study among 163 individuals in Naches who have obtained a bachelor's degree or higher.
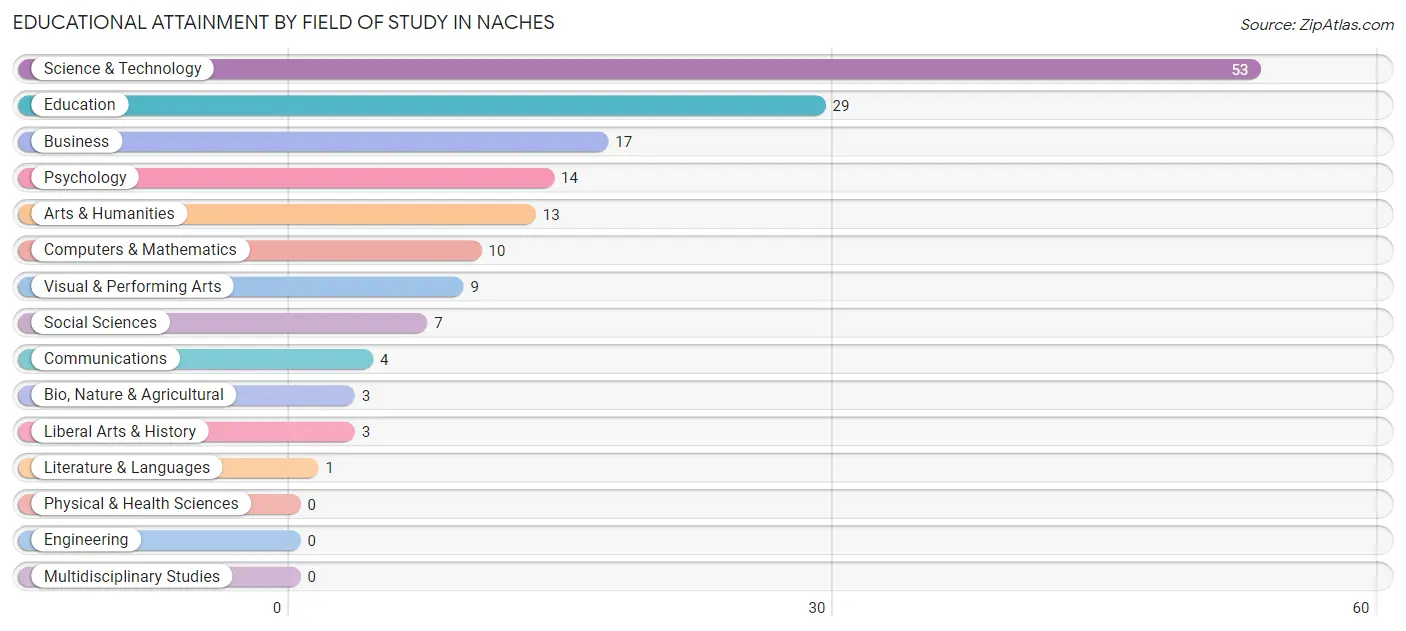
| Field of Study | # Graduates | % Graduates |
| Computers & Mathematics | 10 | 6.1% |
| Bio, Nature & Agricultural | 3 | 1.8% |
| Physical & Health Sciences | 0 | 0.0% |
| Psychology | 14 | 8.6% |
| Social Sciences | 7 | 4.3% |
| Engineering | 0 | 0.0% |
| Multidisciplinary Studies | 0 | 0.0% |
| Science & Technology | 53 | 32.5% |
| Business | 17 | 10.4% |
| Education | 29 | 17.8% |
| Literature & Languages | 1 | 0.6% |
| Liberal Arts & History | 3 | 1.8% |
| Visual & Performing Arts | 9 | 5.5% |
| Communications | 4 | 2.5% |
| Arts & Humanities | 13 | 8.0% |
| Total | 163 | 100.0% |
Transportation & Commute in Naches
Vehicle Availability by Sex in Naches
The most prevalent vehicle ownership categories in Naches are males with 2 vehicles (81, accounting for 49.4%) and females with 2 vehicles (75, making up 48.8%).
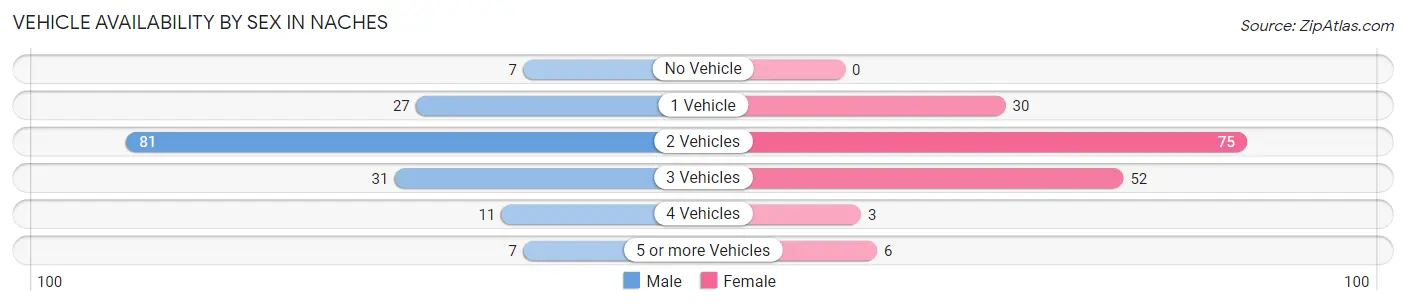
| Vehicles Available | Male | Female |
| No Vehicle | 7 (4.3%) | 0 (0.0%) |
| 1 Vehicle | 27 (16.5%) | 30 (18.1%) |
| 2 Vehicles | 81 (49.4%) | 75 (45.2%) |
| 3 Vehicles | 31 (18.9%) | 52 (31.3%) |
| 4 Vehicles | 11 (6.7%) | 3 (1.8%) |
| 5 or more Vehicles | 7 (4.3%) | 6 (3.6%) |
| Total | 164 (100.0%) | 166 (100.0%) |
Commute Time in Naches
The most frequently occuring commute durations in Naches are 20 to 24 minutes (132 commuters, 35.8%), less than 5 minutes (77 commuters, 20.9%), and 15 to 19 minutes (45 commuters, 12.2%).
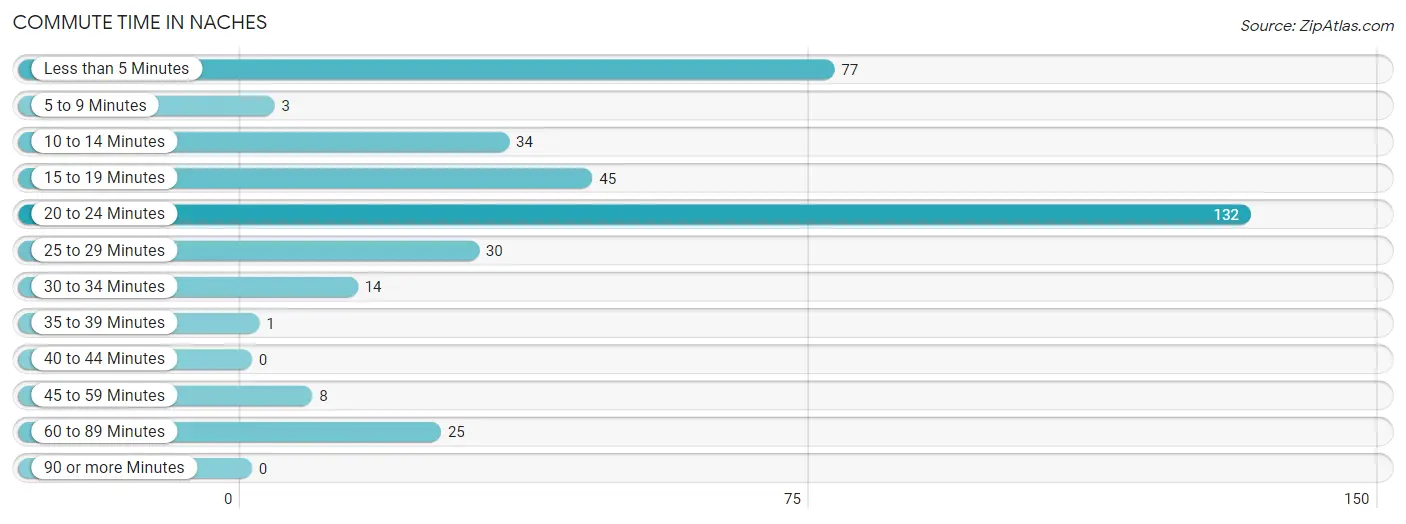
| Commute Time | # Commuters | % Commuters |
| Less than 5 Minutes | 77 | 20.9% |
| 5 to 9 Minutes | 3 | 0.8% |
| 10 to 14 Minutes | 34 | 9.2% |
| 15 to 19 Minutes | 45 | 12.2% |
| 20 to 24 Minutes | 132 | 35.8% |
| 25 to 29 Minutes | 30 | 8.1% |
| 30 to 34 Minutes | 14 | 3.8% |
| 35 to 39 Minutes | 1 | 0.3% |
| 40 to 44 Minutes | 0 | 0.0% |
| 45 to 59 Minutes | 8 | 2.2% |
| 60 to 89 Minutes | 25 | 6.8% |
| 90 or more Minutes | 0 | 0.0% |
Commute Time by Sex in Naches
The most common commute times in Naches are 20 to 24 minutes (81 commuters, 37.3%) for males and 20 to 24 minutes (51 commuters, 33.6%) for females.
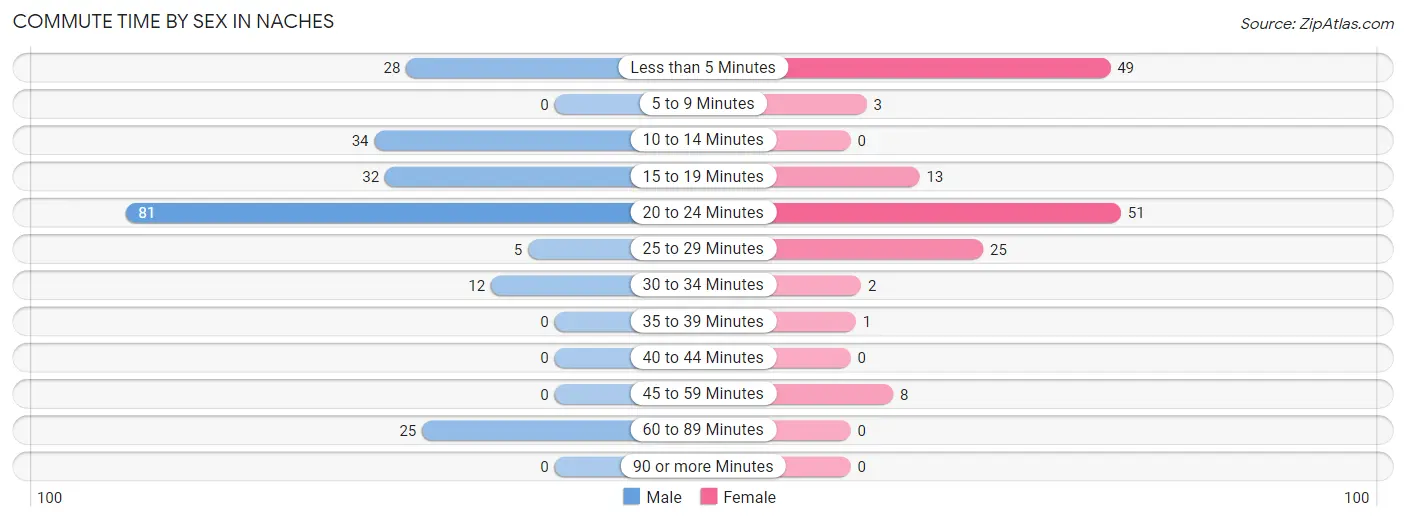
| Commute Time | Male | Female |
| Less than 5 Minutes | 28 (12.9%) | 49 (32.2%) |
| 5 to 9 Minutes | 0 (0.0%) | 3 (2.0%) |
| 10 to 14 Minutes | 34 (15.7%) | 0 (0.0%) |
| 15 to 19 Minutes | 32 (14.7%) | 13 (8.6%) |
| 20 to 24 Minutes | 81 (37.3%) | 51 (33.6%) |
| 25 to 29 Minutes | 5 (2.3%) | 25 (16.5%) |
| 30 to 34 Minutes | 12 (5.5%) | 2 (1.3%) |
| 35 to 39 Minutes | 0 (0.0%) | 1 (0.7%) |
| 40 to 44 Minutes | 0 (0.0%) | 0 (0.0%) |
| 45 to 59 Minutes | 0 (0.0%) | 8 (5.3%) |
| 60 to 89 Minutes | 25 (11.5%) | 0 (0.0%) |
| 90 or more Minutes | 0 (0.0%) | 0 (0.0%) |
Time of Departure to Work by Sex in Naches
The most frequent times of departure to work in Naches are 7:00 AM to 7:29 AM (54, 24.9%) for males and 7:00 AM to 7:29 AM (44, 28.9%) for females.
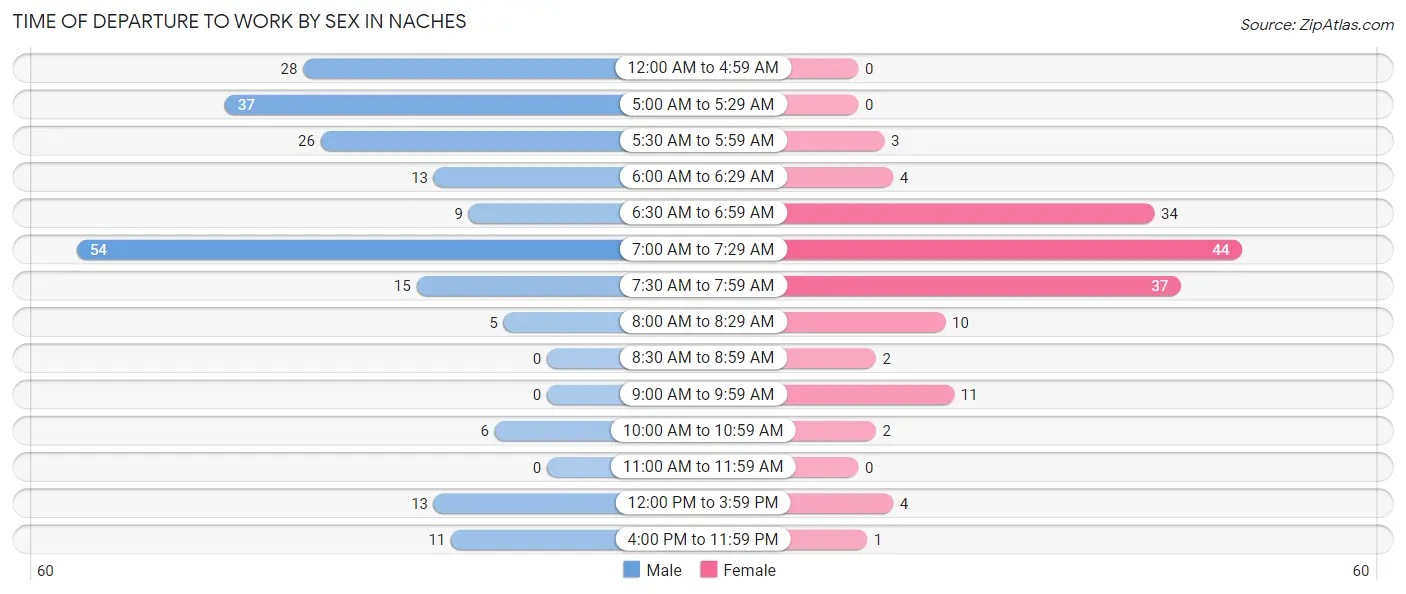
| Time of Departure | Male | Female |
| 12:00 AM to 4:59 AM | 28 (12.9%) | 0 (0.0%) |
| 5:00 AM to 5:29 AM | 37 (17.1%) | 0 (0.0%) |
| 5:30 AM to 5:59 AM | 26 (12.0%) | 3 (2.0%) |
| 6:00 AM to 6:29 AM | 13 (6.0%) | 4 (2.6%) |
| 6:30 AM to 6:59 AM | 9 (4.2%) | 34 (22.4%) |
| 7:00 AM to 7:29 AM | 54 (24.9%) | 44 (28.9%) |
| 7:30 AM to 7:59 AM | 15 (6.9%) | 37 (24.3%) |
| 8:00 AM to 8:29 AM | 5 (2.3%) | 10 (6.6%) |
| 8:30 AM to 8:59 AM | 0 (0.0%) | 2 (1.3%) |
| 9:00 AM to 9:59 AM | 0 (0.0%) | 11 (7.2%) |
| 10:00 AM to 10:59 AM | 6 (2.8%) | 2 (1.3%) |
| 11:00 AM to 11:59 AM | 0 (0.0%) | 0 (0.0%) |
| 12:00 PM to 3:59 PM | 13 (6.0%) | 4 (2.6%) |
| 4:00 PM to 11:59 PM | 11 (5.1%) | 1 (0.7%) |
| Total | 217 (100.0%) | 152 (100.0%) |
Housing Occupancy in Naches
Occupancy by Ownership in Naches
Of the total 361 dwellings in Naches, owner-occupied units account for 220 (60.9%), while renter-occupied units make up 141 (39.1%).
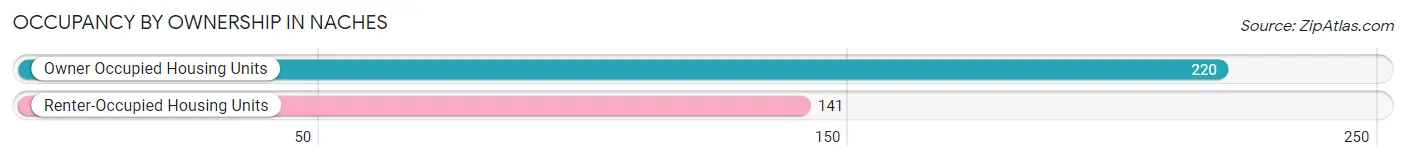
| Occupancy | # Housing Units | % Housing Units |
| Owner Occupied Housing Units | 220 | 60.9% |
| Renter-Occupied Housing Units | 141 | 39.1% |
| Total Occupied Housing Units | 361 | 100.0% |
Occupancy by Household Size in Naches
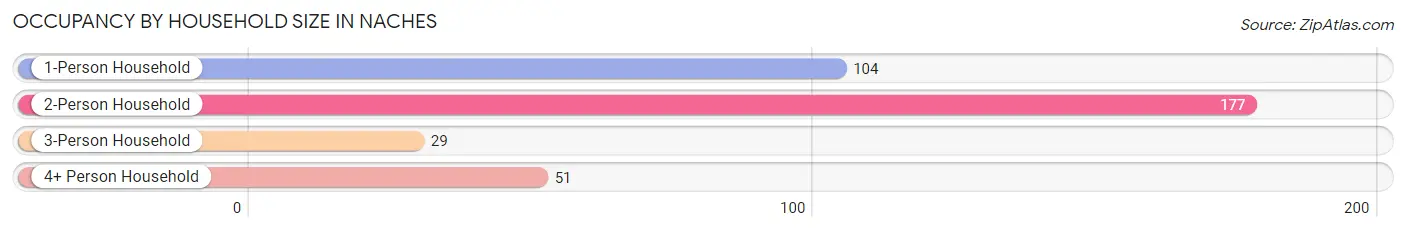
| Household Size | # Housing Units | % Housing Units |
| 1-Person Household | 104 | 28.8% |
| 2-Person Household | 177 | 49.0% |
| 3-Person Household | 29 | 8.0% |
| 4+ Person Household | 51 | 14.1% |
| Total Housing Units | 361 | 100.0% |
Occupancy by Ownership by Household Size in Naches
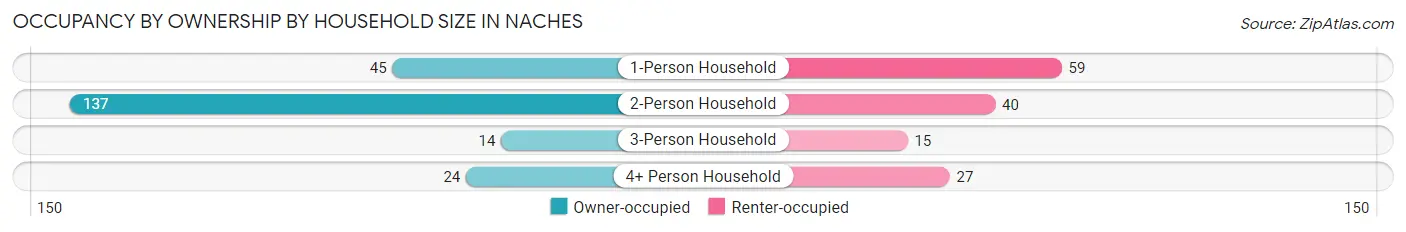
| Household Size | Owner-occupied | Renter-occupied |
| 1-Person Household | 45 (43.3%) | 59 (56.7%) |
| 2-Person Household | 137 (77.4%) | 40 (22.6%) |
| 3-Person Household | 14 (48.3%) | 15 (51.7%) |
| 4+ Person Household | 24 (47.1%) | 27 (52.9%) |
| Total Housing Units | 220 (60.9%) | 141 (39.1%) |
Occupancy by Educational Attainment in Naches
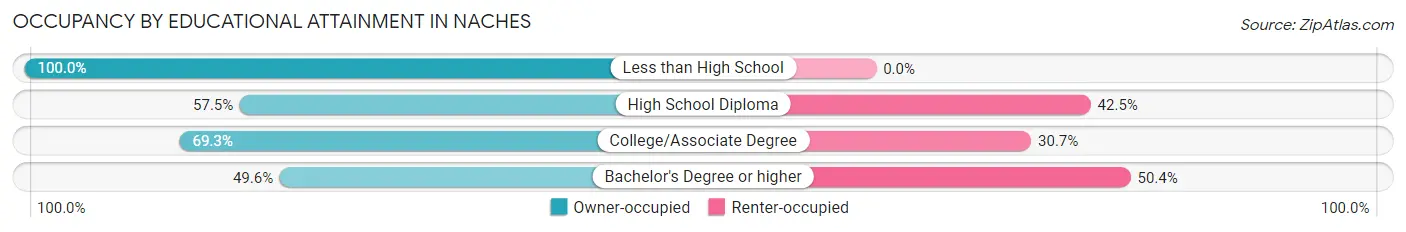
| Household Size | Owner-occupied | Renter-occupied |
| Less than High School | 8 (100.0%) | 0 (0.0%) |
| High School Diploma | 50 (57.5%) | 37 (42.5%) |
| College/Associate Degree | 106 (69.3%) | 47 (30.7%) |
| Bachelor's Degree or higher | 56 (49.6%) | 57 (50.4%) |
Occupancy by Age of Householder in Naches
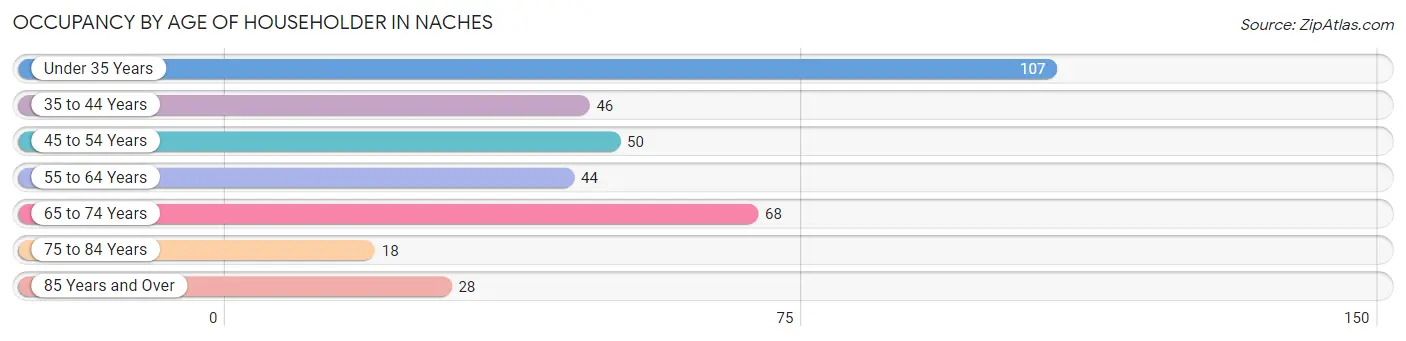
| Age Bracket | # Households | % Households |
| Under 35 Years | 107 | 29.6% |
| 35 to 44 Years | 46 | 12.7% |
| 45 to 54 Years | 50 | 13.9% |
| 55 to 64 Years | 44 | 12.2% |
| 65 to 74 Years | 68 | 18.8% |
| 75 to 84 Years | 18 | 5.0% |
| 85 Years and Over | 28 | 7.8% |
| Total | 361 | 100.0% |
Housing Finances in Naches
Median Income by Occupancy in Naches
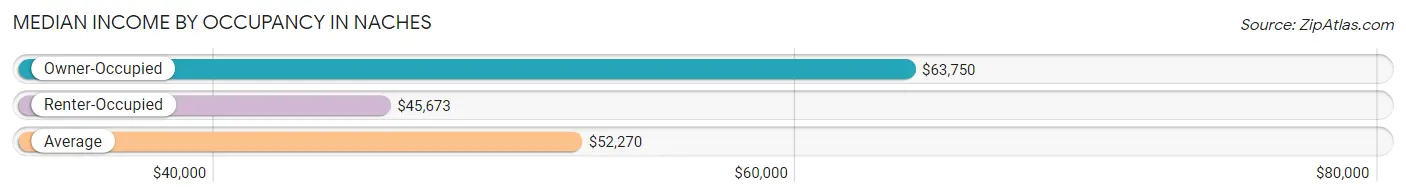
| Occupancy Type | # Households | Median Income |
| Owner-Occupied | 220 (60.9%) | $63,750 |
| Renter-Occupied | 141 (39.1%) | $45,673 |
| Average | 361 (100.0%) | $52,270 |
Occupancy by Householder Income Bracket in Naches
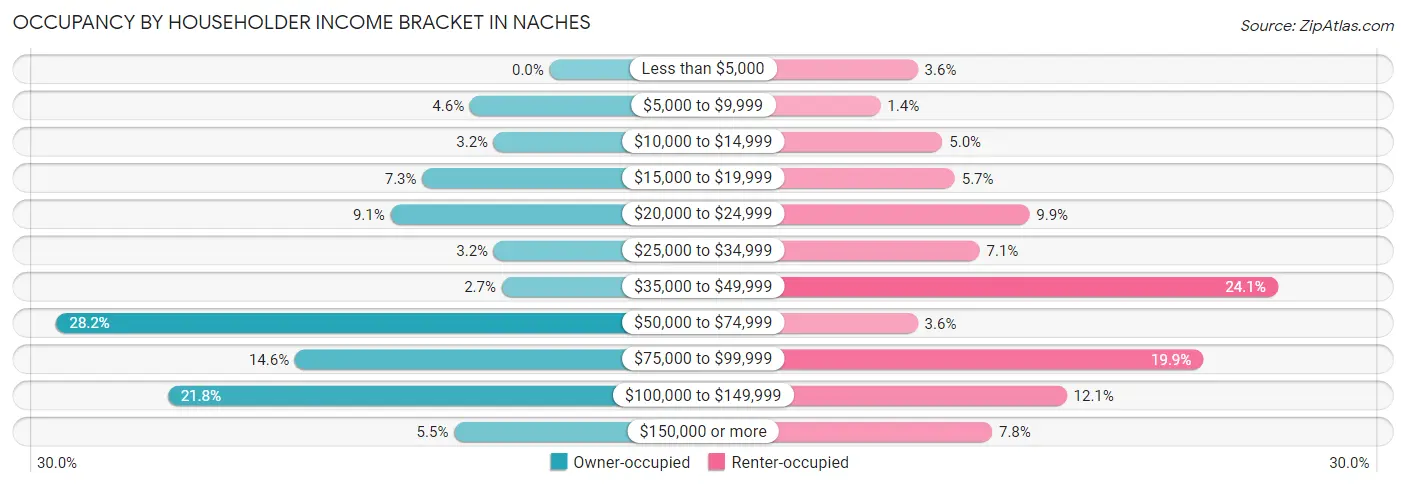
| Income Bracket | Owner-occupied | Renter-occupied |
| Less than $5,000 | 0 (0.0%) | 5 (3.5%) |
| $5,000 to $9,999 | 10 (4.5%) | 2 (1.4%) |
| $10,000 to $14,999 | 7 (3.2%) | 7 (5.0%) |
| $15,000 to $19,999 | 16 (7.3%) | 8 (5.7%) |
| $20,000 to $24,999 | 20 (9.1%) | 14 (9.9%) |
| $25,000 to $34,999 | 7 (3.2%) | 10 (7.1%) |
| $35,000 to $49,999 | 6 (2.7%) | 34 (24.1%) |
| $50,000 to $74,999 | 62 (28.2%) | 5 (3.5%) |
| $75,000 to $99,999 | 32 (14.5%) | 28 (19.9%) |
| $100,000 to $149,999 | 48 (21.8%) | 17 (12.1%) |
| $150,000 or more | 12 (5.4%) | 11 (7.8%) |
| Total | 220 (100.0%) | 141 (100.0%) |
Monthly Housing Cost Tiers in Naches
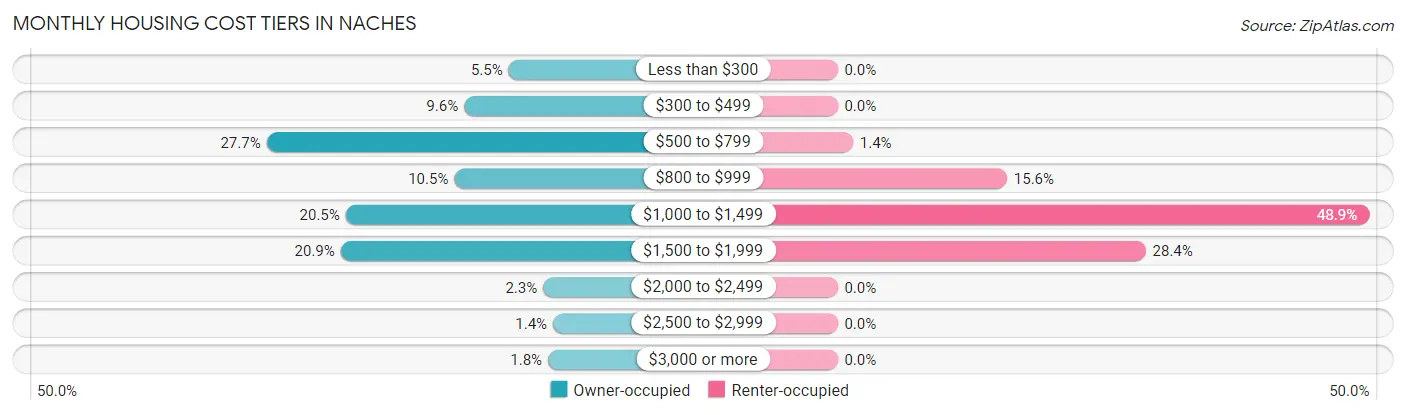
| Monthly Cost | Owner-occupied | Renter-occupied |
| Less than $300 | 12 (5.4%) | 0 (0.0%) |
| $300 to $499 | 21 (9.6%) | 0 (0.0%) |
| $500 to $799 | 61 (27.7%) | 2 (1.4%) |
| $800 to $999 | 23 (10.4%) | 22 (15.6%) |
| $1,000 to $1,499 | 45 (20.4%) | 69 (48.9%) |
| $1,500 to $1,999 | 46 (20.9%) | 40 (28.4%) |
| $2,000 to $2,499 | 5 (2.3%) | 0 (0.0%) |
| $2,500 to $2,999 | 3 (1.4%) | 0 (0.0%) |
| $3,000 or more | 4 (1.8%) | 0 (0.0%) |
| Total | 220 (100.0%) | 141 (100.0%) |
Physical Housing Characteristics in Naches
Housing Structures in Naches
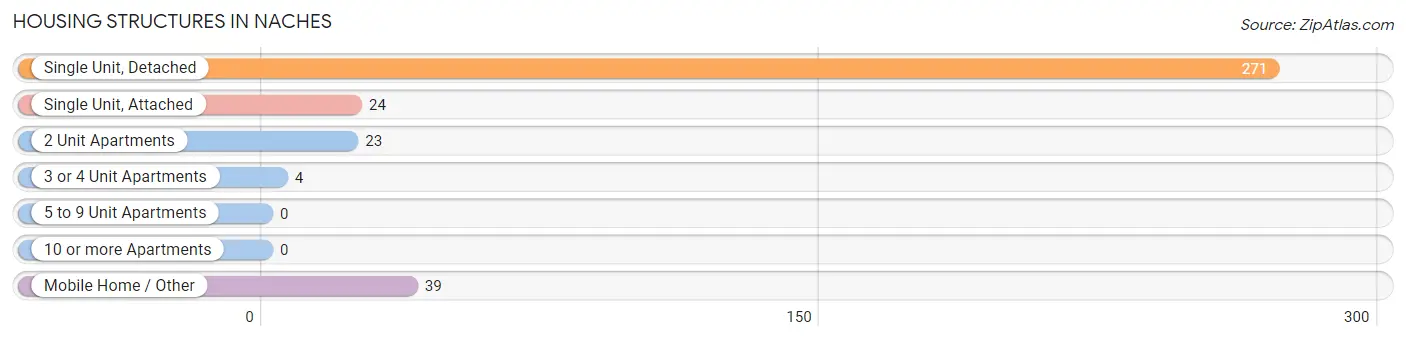
| Structure Type | # Housing Units | % Housing Units |
| Single Unit, Detached | 271 | 75.1% |
| Single Unit, Attached | 24 | 6.7% |
| 2 Unit Apartments | 23 | 6.4% |
| 3 or 4 Unit Apartments | 4 | 1.1% |
| 5 to 9 Unit Apartments | 0 | 0.0% |
| 10 or more Apartments | 0 | 0.0% |
| Mobile Home / Other | 39 | 10.8% |
| Total | 361 | 100.0% |
Housing Structures by Occupancy in Naches
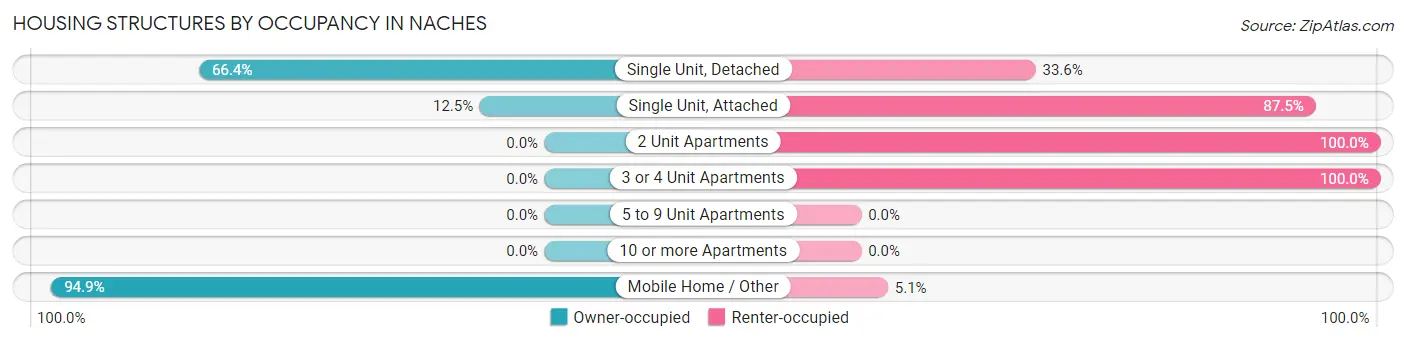
| Structure Type | Owner-occupied | Renter-occupied |
| Single Unit, Detached | 180 (66.4%) | 91 (33.6%) |
| Single Unit, Attached | 3 (12.5%) | 21 (87.5%) |
| 2 Unit Apartments | 0 (0.0%) | 23 (100.0%) |
| 3 or 4 Unit Apartments | 0 (0.0%) | 4 (100.0%) |
| 5 to 9 Unit Apartments | 0 (0.0%) | 0 (0.0%) |
| 10 or more Apartments | 0 (0.0%) | 0 (0.0%) |
| Mobile Home / Other | 37 (94.9%) | 2 (5.1%) |
| Total | 220 (60.9%) | 141 (39.1%) |
Housing Structures by Number of Rooms in Naches
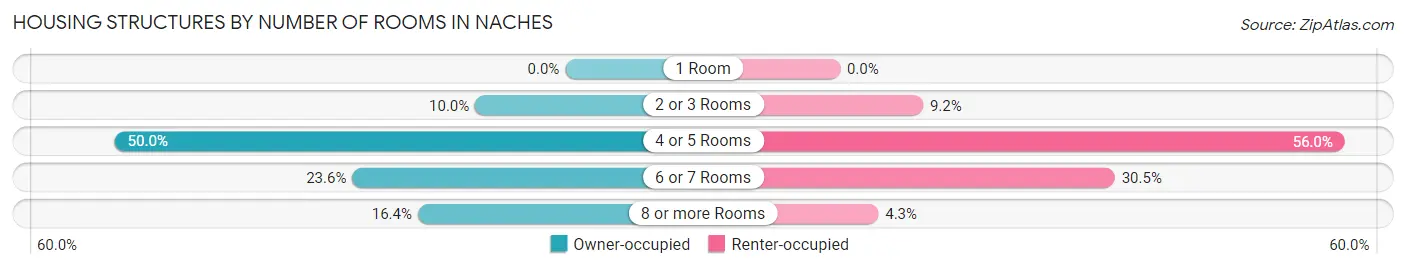
| Number of Rooms | Owner-occupied | Renter-occupied |
| 1 Room | 0 (0.0%) | 0 (0.0%) |
| 2 or 3 Rooms | 22 (10.0%) | 13 (9.2%) |
| 4 or 5 Rooms | 110 (50.0%) | 79 (56.0%) |
| 6 or 7 Rooms | 52 (23.6%) | 43 (30.5%) |
| 8 or more Rooms | 36 (16.4%) | 6 (4.3%) |
| Total | 220 (100.0%) | 141 (100.0%) |
Housing Structure by Heating Type in Naches
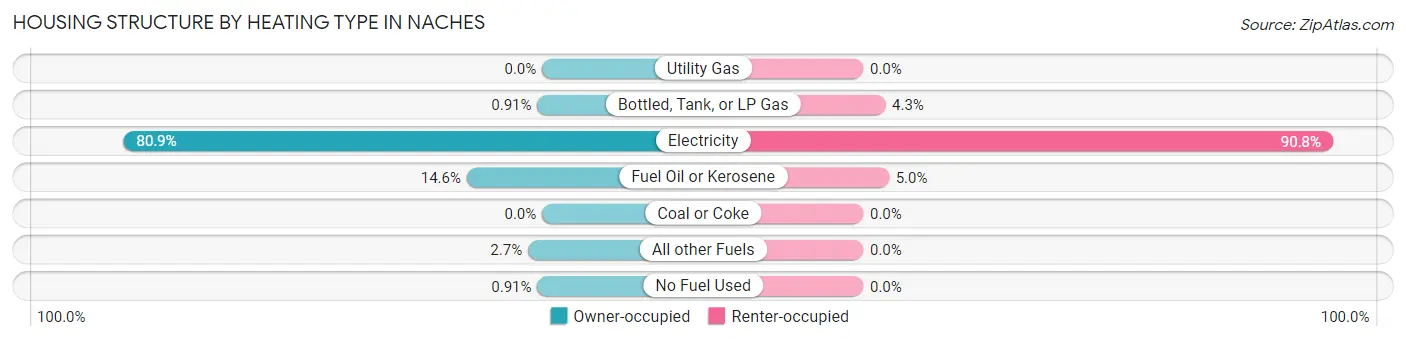
| Heating Type | Owner-occupied | Renter-occupied |
| Utility Gas | 0 (0.0%) | 0 (0.0%) |
| Bottled, Tank, or LP Gas | 2 (0.9%) | 6 (4.3%) |
| Electricity | 178 (80.9%) | 128 (90.8%) |
| Fuel Oil or Kerosene | 32 (14.5%) | 7 (5.0%) |
| Coal or Coke | 0 (0.0%) | 0 (0.0%) |
| All other Fuels | 6 (2.7%) | 0 (0.0%) |
| No Fuel Used | 2 (0.9%) | 0 (0.0%) |
| Total | 220 (100.0%) | 141 (100.0%) |
Household Vehicle Usage in Naches
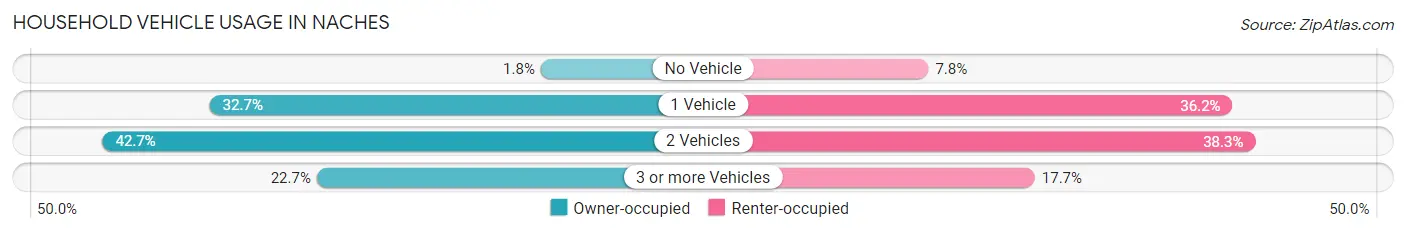
| Vehicles per Household | Owner-occupied | Renter-occupied |
| No Vehicle | 4 (1.8%) | 11 (7.8%) |
| 1 Vehicle | 72 (32.7%) | 51 (36.2%) |
| 2 Vehicles | 94 (42.7%) | 54 (38.3%) |
| 3 or more Vehicles | 50 (22.7%) | 25 (17.7%) |
| Total | 220 (100.0%) | 141 (100.0%) |
Real Estate & Mortgages in Naches
Real Estate and Mortgage Overview in Naches
| Characteristic | Without Mortgage | With Mortgage |
| Housing Units | 77 | 143 |
| Median Property Value | $143,800 | $220,500 |
| Median Household Income | $51,420 | $10 |
| Monthly Housing Costs | $569 | $1 |
| Real Estate Taxes | $2,083 | $18 |
Property Value by Mortgage Status in Naches
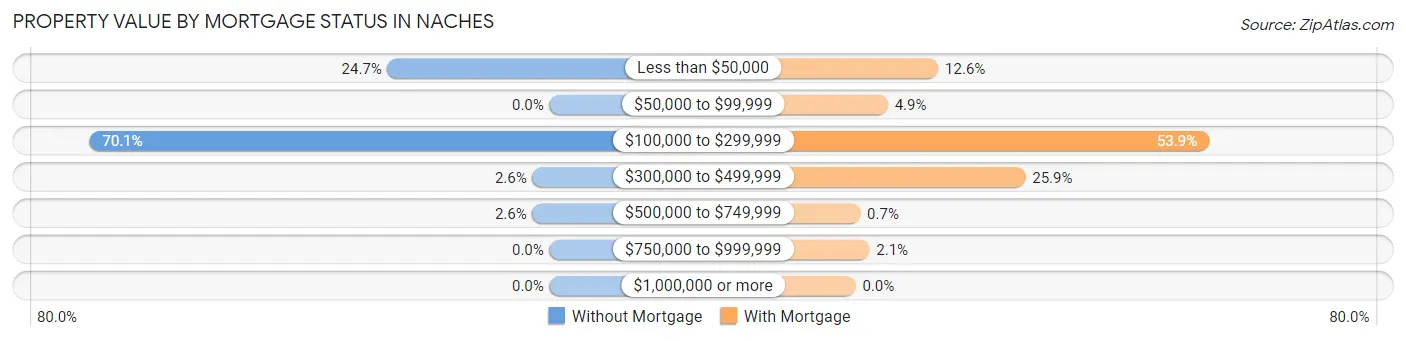
| Property Value | Without Mortgage | With Mortgage |
| Less than $50,000 | 19 (24.7%) | 18 (12.6%) |
| $50,000 to $99,999 | 0 (0.0%) | 7 (4.9%) |
| $100,000 to $299,999 | 54 (70.1%) | 77 (53.8%) |
| $300,000 to $499,999 | 2 (2.6%) | 37 (25.9%) |
| $500,000 to $749,999 | 2 (2.6%) | 1 (0.7%) |
| $750,000 to $999,999 | 0 (0.0%) | 3 (2.1%) |
| $1,000,000 or more | 0 (0.0%) | 0 (0.0%) |
| Total | 77 (100.0%) | 143 (100.0%) |
Household Income by Mortgage Status in Naches
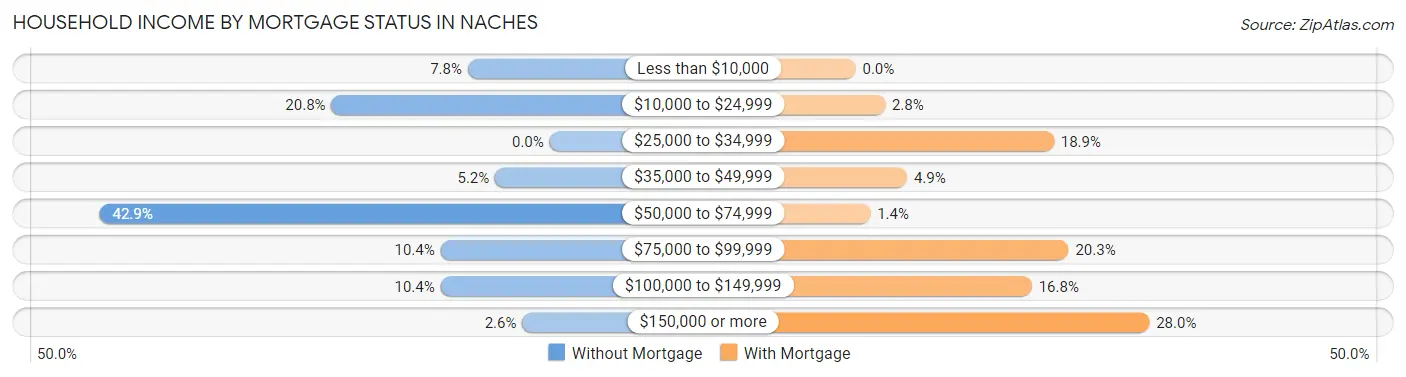
| Household Income | Without Mortgage | With Mortgage |
| Less than $10,000 | 6 (7.8%) | 0 (0.0%) |
| $10,000 to $24,999 | 16 (20.8%) | 4 (2.8%) |
| $25,000 to $34,999 | 0 (0.0%) | 27 (18.9%) |
| $35,000 to $49,999 | 4 (5.2%) | 7 (4.9%) |
| $50,000 to $74,999 | 33 (42.9%) | 2 (1.4%) |
| $75,000 to $99,999 | 8 (10.4%) | 29 (20.3%) |
| $100,000 to $149,999 | 8 (10.4%) | 24 (16.8%) |
| $150,000 or more | 2 (2.6%) | 40 (28.0%) |
| Total | 77 (100.0%) | 143 (100.0%) |
Property Value to Household Income Ratio in Naches
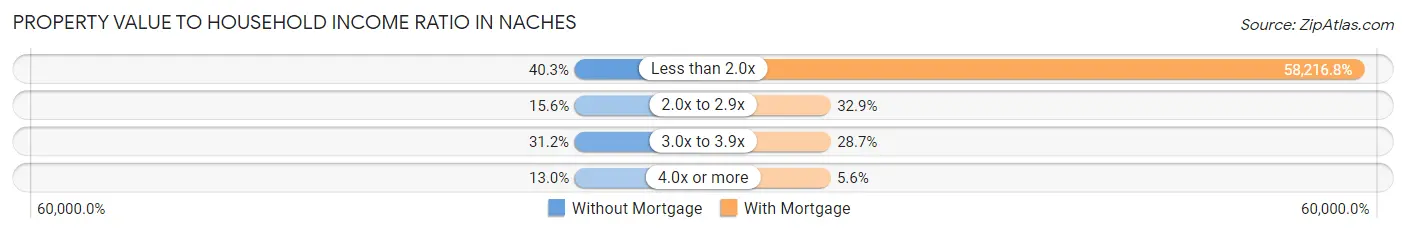
| Value-to-Income Ratio | Without Mortgage | With Mortgage |
| Less than 2.0x | 31 (40.3%) | 83,250 (58,216.8%) |
| 2.0x to 2.9x | 12 (15.6%) | 47 (32.9%) |
| 3.0x to 3.9x | 24 (31.2%) | 41 (28.7%) |
| 4.0x or more | 10 (13.0%) | 8 (5.6%) |
| Total | 77 (100.0%) | 143 (100.0%) |
Real Estate Taxes by Mortgage Status in Naches
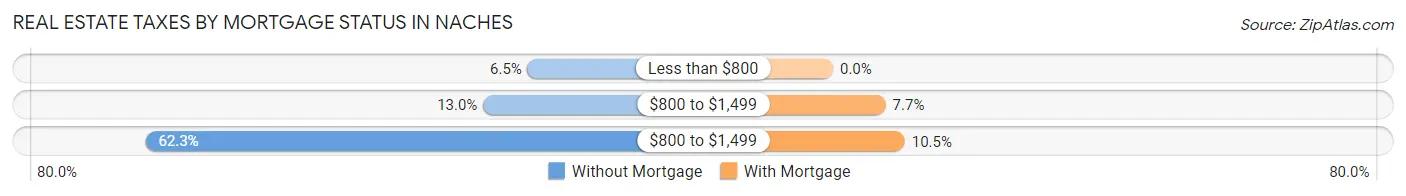
| Property Taxes | Without Mortgage | With Mortgage |
| Less than $800 | 5 (6.5%) | 0 (0.0%) |
| $800 to $1,499 | 10 (13.0%) | 11 (7.7%) |
| $800 to $1,499 | 48 (62.3%) | 15 (10.5%) |
| Total | 77 (100.0%) | 143 (100.0%) |
Health & Disability in Naches
Health Insurance Coverage by Age in Naches
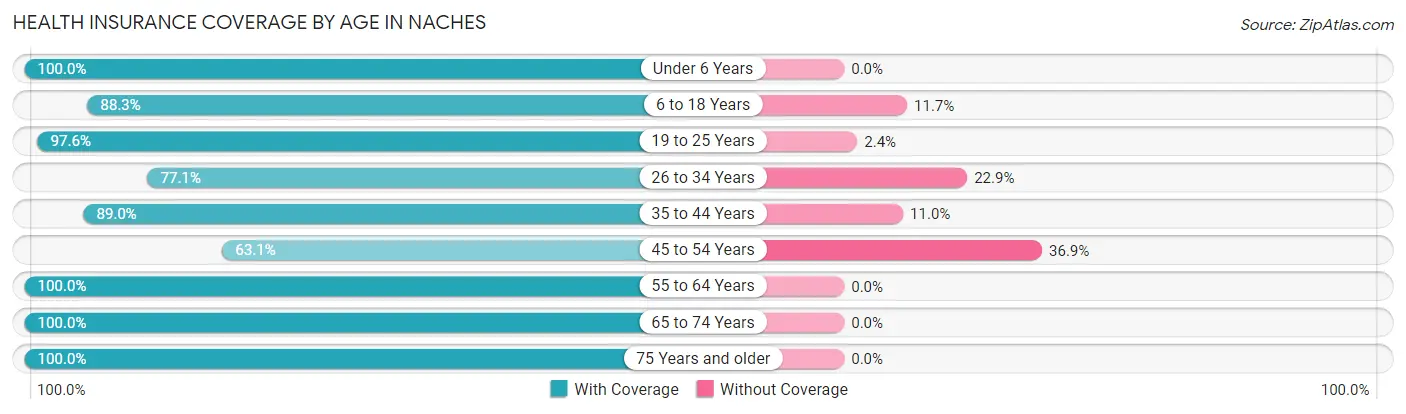
| Age Bracket | With Coverage | Without Coverage |
| Under 6 Years | 65 (100.0%) | 0 (0.0%) |
| 6 to 18 Years | 98 (88.3%) | 13 (11.7%) |
| 19 to 25 Years | 40 (97.6%) | 1 (2.4%) |
| 26 to 34 Years | 121 (77.1%) | 36 (22.9%) |
| 35 to 44 Years | 73 (89.0%) | 9 (11.0%) |
| 45 to 54 Years | 65 (63.1%) | 38 (36.9%) |
| 55 to 64 Years | 93 (100.0%) | 0 (0.0%) |
| 65 to 74 Years | 90 (100.0%) | 0 (0.0%) |
| 75 Years and older | 72 (100.0%) | 0 (0.0%) |
| Total | 717 (88.1%) | 97 (11.9%) |
Health Insurance Coverage by Citizenship Status in Naches
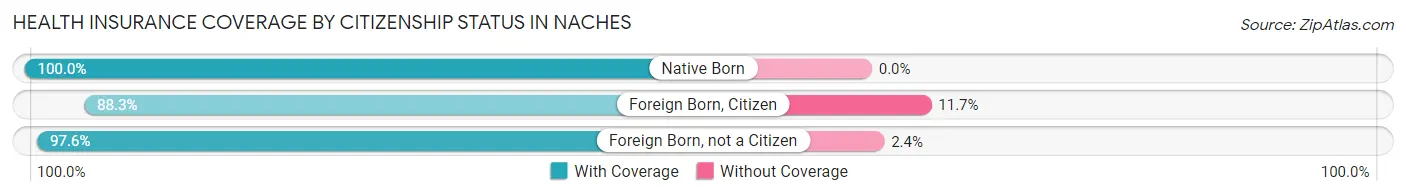
| Citizenship Status | With Coverage | Without Coverage |
| Native Born | 65 (100.0%) | 0 (0.0%) |
| Foreign Born, Citizen | 98 (88.3%) | 13 (11.7%) |
| Foreign Born, not a Citizen | 40 (97.6%) | 1 (2.4%) |
Health Insurance Coverage by Household Income in Naches
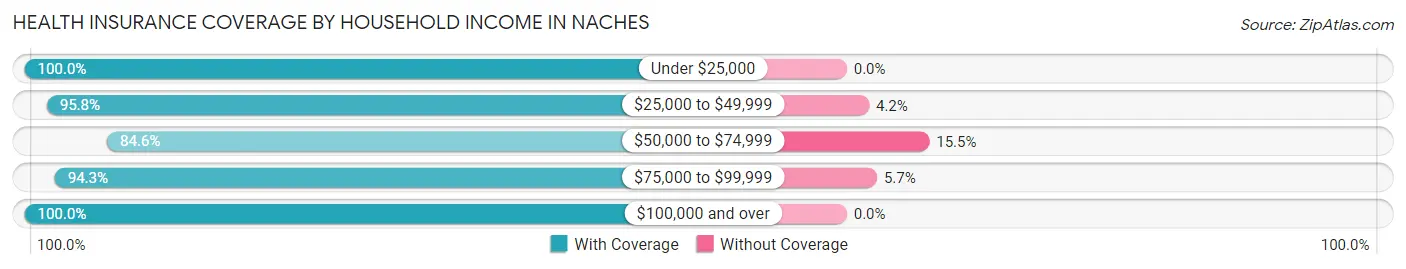
| Household Income | With Coverage | Without Coverage |
| Under $25,000 | 145 (100.0%) | 0 (0.0%) |
| $25,000 to $49,999 | 138 (95.8%) | 6 (4.2%) |
| $50,000 to $74,999 | 104 (84.6%) | 19 (15.4%) |
| $75,000 to $99,999 | 100 (94.3%) | 6 (5.7%) |
| $100,000 and over | 230 (100.0%) | 0 (0.0%) |
Public vs Private Health Insurance Coverage by Age in Naches
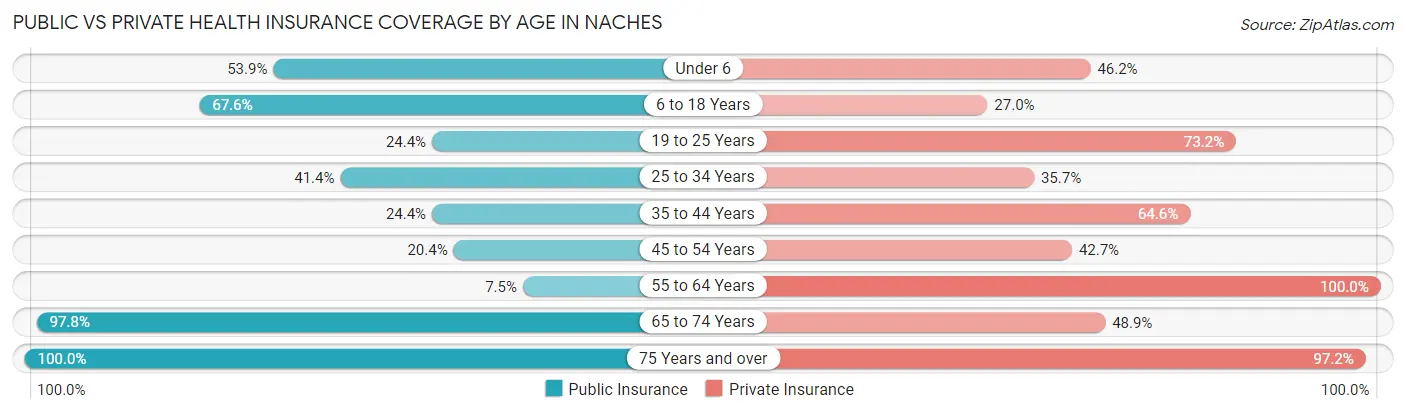
| Age Bracket | Public Insurance | Private Insurance |
| Under 6 | 35 (53.8%) | 30 (46.2%) |
| 6 to 18 Years | 75 (67.6%) | 30 (27.0%) |
| 19 to 25 Years | 10 (24.4%) | 30 (73.2%) |
| 25 to 34 Years | 65 (41.4%) | 56 (35.7%) |
| 35 to 44 Years | 20 (24.4%) | 53 (64.6%) |
| 45 to 54 Years | 21 (20.4%) | 44 (42.7%) |
| 55 to 64 Years | 7 (7.5%) | 93 (100.0%) |
| 65 to 74 Years | 88 (97.8%) | 44 (48.9%) |
| 75 Years and over | 72 (100.0%) | 70 (97.2%) |
| Total | 393 (48.3%) | 450 (55.3%) |
Disability Status by Sex by Age in Naches
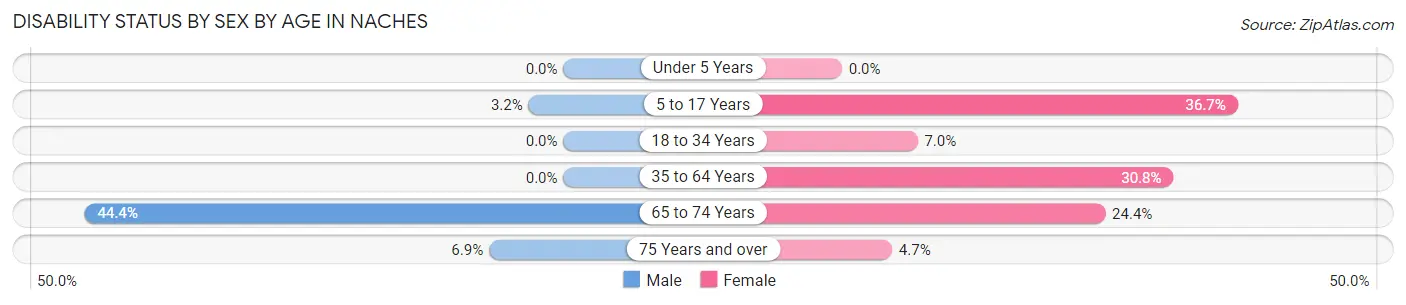
| Age Bracket | Male | Female |
| Under 5 Years | 0 (0.0%) | 0 (0.0%) |
| 5 to 17 Years | 2 (3.2%) | 18 (36.7%) |
| 18 to 34 Years | 0 (0.0%) | 8 (7.0%) |
| 35 to 64 Years | 0 (0.0%) | 36 (30.8%) |
| 65 to 74 Years | 20 (44.4%) | 11 (24.4%) |
| 75 Years and over | 2 (6.9%) | 2 (4.6%) |
Disability Class by Sex by Age in Naches
Disability Class: Hearing Difficulty
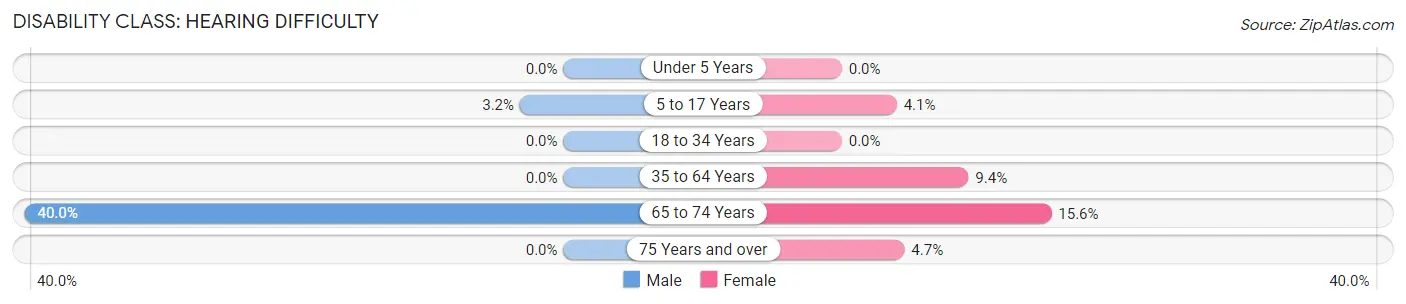
| Age Bracket | Male | Female |
| Under 5 Years | 0 (0.0%) | 0 (0.0%) |
| 5 to 17 Years | 2 (3.2%) | 2 (4.1%) |
| 18 to 34 Years | 0 (0.0%) | 0 (0.0%) |
| 35 to 64 Years | 0 (0.0%) | 11 (9.4%) |
| 65 to 74 Years | 18 (40.0%) | 7 (15.6%) |
| 75 Years and over | 0 (0.0%) | 2 (4.6%) |
Disability Class: Vision Difficulty
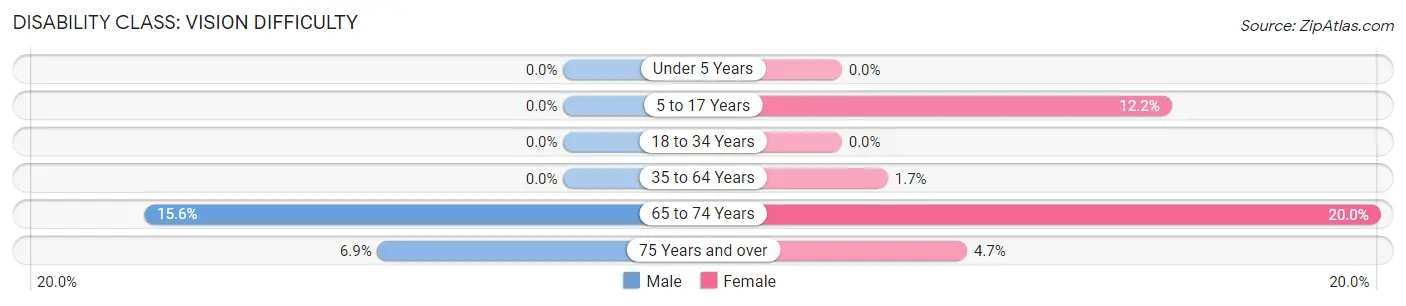
| Age Bracket | Male | Female |
| Under 5 Years | 0 (0.0%) | 0 (0.0%) |
| 5 to 17 Years | 0 (0.0%) | 6 (12.2%) |
| 18 to 34 Years | 0 (0.0%) | 0 (0.0%) |
| 35 to 64 Years | 0 (0.0%) | 2 (1.7%) |
| 65 to 74 Years | 7 (15.6%) | 9 (20.0%) |
| 75 Years and over | 2 (6.9%) | 2 (4.6%) |
Disability Class: Cognitive Difficulty
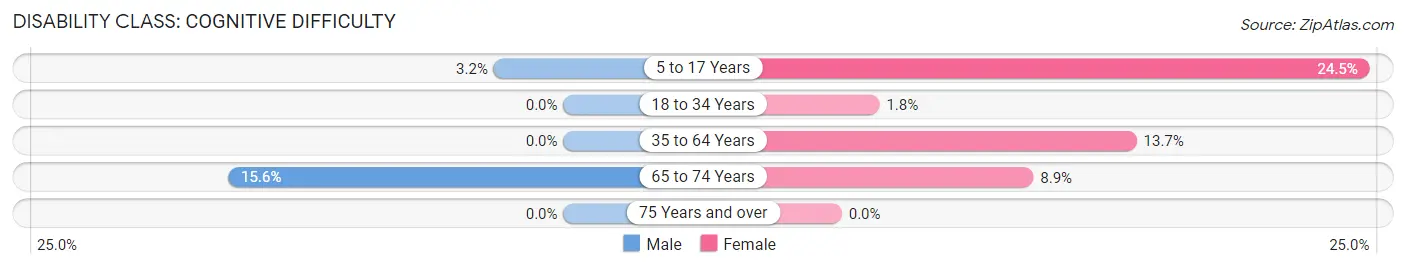
| Age Bracket | Male | Female |
| 5 to 17 Years | 2 (3.2%) | 12 (24.5%) |
| 18 to 34 Years | 0 (0.0%) | 2 (1.8%) |
| 35 to 64 Years | 0 (0.0%) | 16 (13.7%) |
| 65 to 74 Years | 7 (15.6%) | 4 (8.9%) |
| 75 Years and over | 0 (0.0%) | 0 (0.0%) |
Disability Class: Ambulatory Difficulty
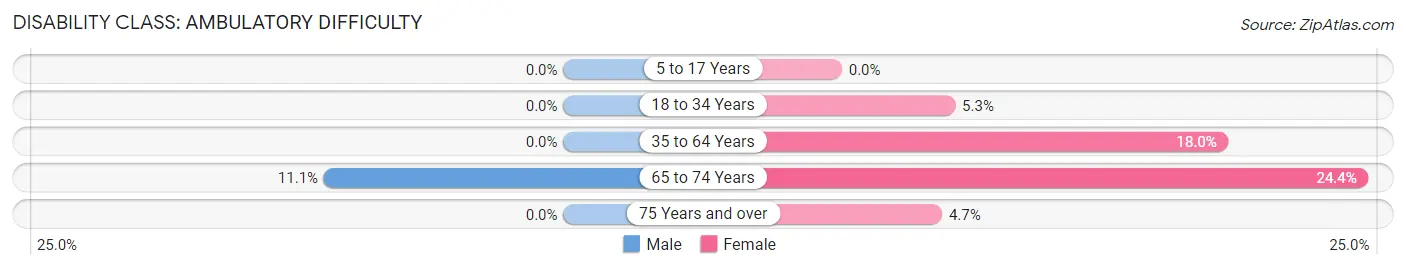
| Age Bracket | Male | Female |
| 5 to 17 Years | 0 (0.0%) | 0 (0.0%) |
| 18 to 34 Years | 0 (0.0%) | 6 (5.3%) |
| 35 to 64 Years | 0 (0.0%) | 21 (17.9%) |
| 65 to 74 Years | 5 (11.1%) | 11 (24.4%) |
| 75 Years and over | 0 (0.0%) | 2 (4.6%) |
Disability Class: Self-Care Difficulty
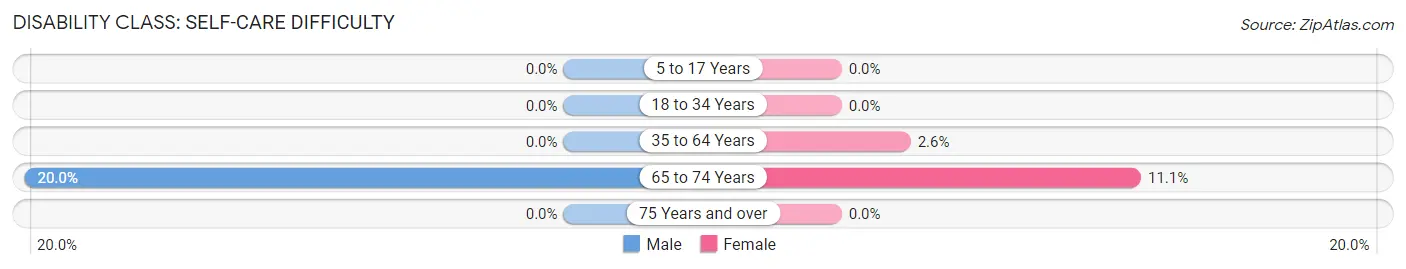
| Age Bracket | Male | Female |
| 5 to 17 Years | 0 (0.0%) | 0 (0.0%) |
| 18 to 34 Years | 0 (0.0%) | 0 (0.0%) |
| 35 to 64 Years | 0 (0.0%) | 3 (2.6%) |
| 65 to 74 Years | 9 (20.0%) | 5 (11.1%) |
| 75 Years and over | 0 (0.0%) | 0 (0.0%) |
Technology Access in Naches
Computing Device Access in Naches
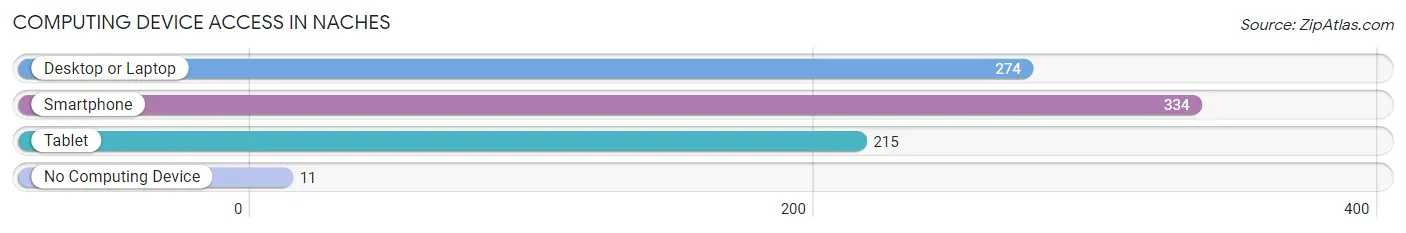
| Device Type | # Households | % Households |
| Desktop or Laptop | 274 | 75.9% |
| Smartphone | 334 | 92.5% |
| Tablet | 215 | 59.6% |
| No Computing Device | 11 | 3.0% |
| Total | 361 | 100.0% |
Internet Access in Naches
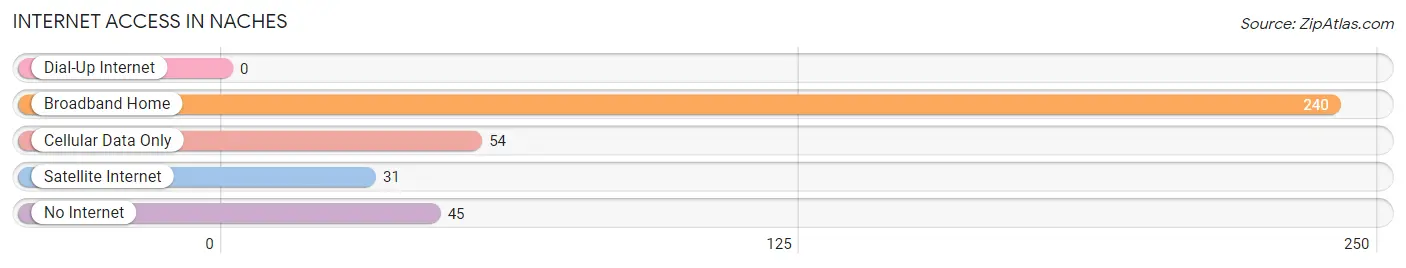
| Internet Type | # Households | % Households |
| Dial-Up Internet | 0 | 0.0% |
| Broadband Home | 240 | 66.5% |
| Cellular Data Only | 54 | 15.0% |
| Satellite Internet | 31 | 8.6% |
| No Internet | 45 | 12.5% |
| Total | 361 | 100.0% |
Naches Summary
Naches is a small town located in Yakima County, Washington, United States. It is situated in the foothills of the Cascade Mountains, about 25 miles east of Yakima. The population was 1,541 at the 2010 census.
History
The area around Naches was first inhabited by the Yakama Native American tribe. The first white settlers arrived in the area in the late 1800s, and the town was officially founded in 1891. The town was named after the nearby Naches River, which was named by the Yakama tribe.
The town was originally a logging and farming community, and the first sawmill was built in 1892. The town grew rapidly in the early 1900s, and by 1910 the population had grown to over 1,000.
In the 1920s, the town was connected to the rest of the state by the Yakima Valley Highway, which was later replaced by US Highway 12. The town also had a railroad line, which was used to transport goods and passengers.
Geography
Naches is located at 46°45'25"N 120°37'45"W (46.7569, -120.6294). According to the United States Census Bureau, the town has a total area of 1.2 square miles (3.1 km2), all of it land.
The town is situated in the foothills of the Cascade Mountains, and is surrounded by rolling hills and forests. The Naches River runs through the town, and is a popular spot for fishing and rafting.
Economy
The economy of Naches is largely based on agriculture and tourism. The town is home to several wineries, and is a popular destination for wine tasting. The town also has several restaurants, cafes, and shops.
The town is also home to several manufacturing companies, including a wood products company and a metal fabrication company.
Demographics
As of the 2010 census, there were 1,541 people, 645 households, and 431 families residing in the town. The population density was 1,269.2 people per square mile (490.2/km2). There were 717 housing units at an average density of 597.5 per square mile (231.2/km2). The racial makeup of the town was 87.2% White, 0.3% African American, 1.2% Native American, 0.4% Asian, 0.1% Pacific Islander, 8.2% from other races, and 2.7% from two or more races. Hispanic or Latino of any race were 16.2% of the population.
There were 645 households, out of which 28.2% had children under the age of 18 living with them, 48.2% were married couples living together, 11.7% had a female householder with no husband present, and 34.2% were non-families. 28.2% of all households were made up of individuals, and 12.2% had someone living alone who was 65 years of age or older. The average household size was 2.39 and the average family size was 2.90.
In the town, the population was spread out, with 24.2% under the age of 18, 8.2% from 18 to 24, 24.2% from 25 to 44, 27.2% from 45 to 64, and 16.2% who were 65 years of age or older. The median age was 40 years. For every 100 females, there were 97.2 males. For every 100 females age 18 and over, there were 94.2 males.
The median income for a household in the town was $31,250, and the median income for a family was $37,500. Males had a median income of $30,000 versus $21,250 for females. The per capita income for the town was $17,845. About 11.2% of families and 14.2% of the population were below the poverty line, including 19.2% of those under age 18 and 8.2% of those age 65 or over.
Common Questions
What is Per Capita Income in Naches?
Per Capita income in Naches is $31,210.
What is the Median Family Income in Naches?
Median Family Income in Naches is $71,696.
What is the Median Household income in Naches?
Median Household Income in Naches is $52,270.
What is Income or Wage Gap in Naches?
Income or Wage Gap in Naches is 11.2%.
Women in Naches earn 88.8 cents for every dollar earned by a man.
What is Family Income Deficit in Naches?
Family Income Deficit in Naches is $6,696.
Families that are below poverty line in Naches earn $6,696 less on average than the poverty threshold level.
What is Inequality or Gini Index in Naches?
Inequality or Gini Index in Naches is 0.38.
What is the Total Population of Naches?
Total Population of Naches is 814.
What is the Total Male Population of Naches?
Total Male Population of Naches is 421.
What is the Total Female Population of Naches?
Total Female Population of Naches is 393.
What is the Ratio of Males per 100 Females in Naches?
There are 107.12 Males per 100 Females in Naches.
What is the Ratio of Females per 100 Males in Naches?
There are 93.35 Females per 100 Males in Naches.
What is the Median Population Age in Naches?
Median Population Age in Naches is 38.4 Years.
What is the Average Family Size in Naches
Average Family Size in Naches is 2.4 People.
What is the Average Household Size in Naches
Average Household Size in Naches is 2.1 People.
How Large is the Labor Force in Naches?
There are 435 People in the Labor Forcein in Naches.
What is the Percentage of People in the Labor Force in Naches?
66.4% of People are in the Labor Force in Naches.
What is the Unemployment Rate in Naches?
Unemployment Rate in Naches is 5.7%.