Fords Prairie, WA Map & Demographics
Fords Prairie Map
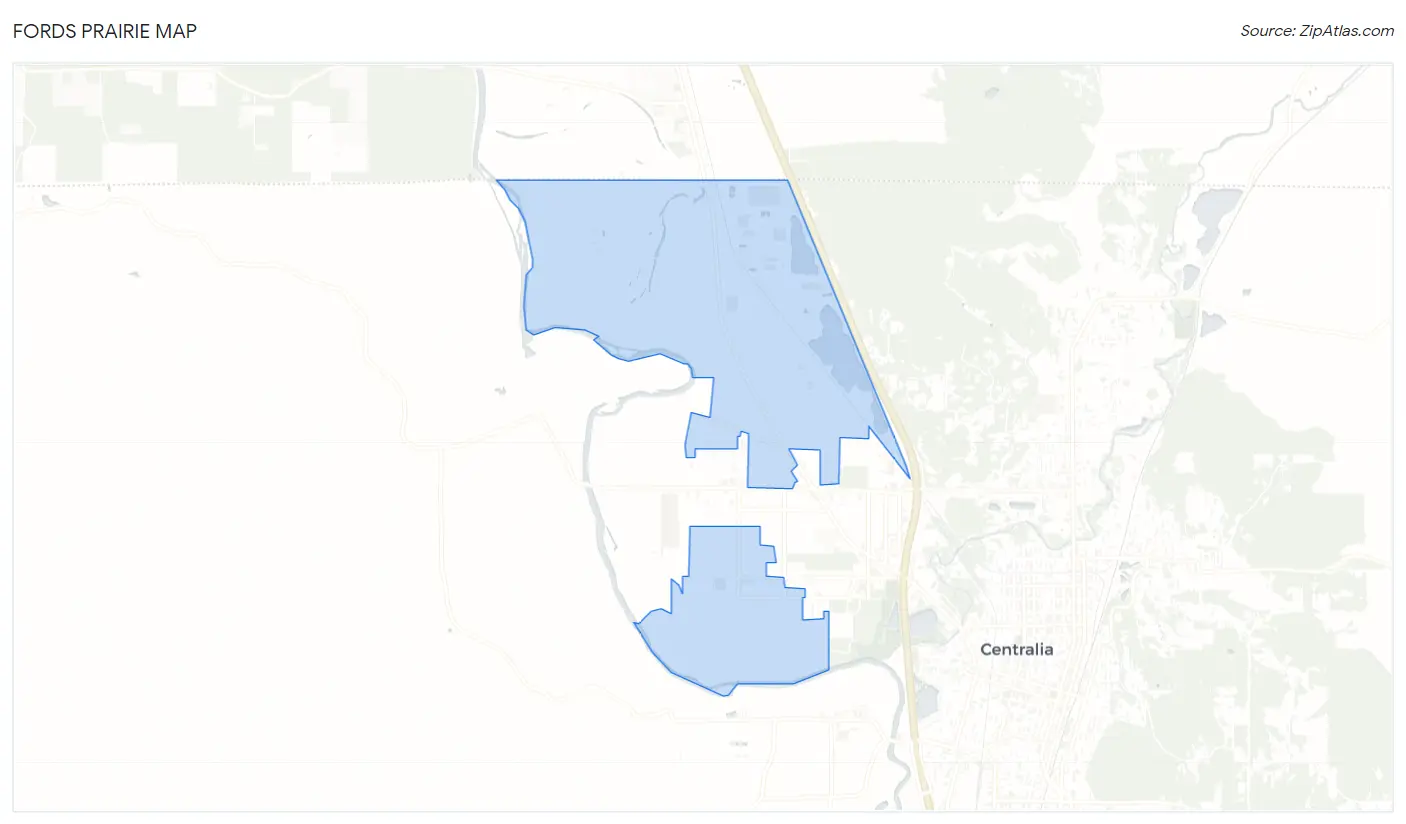
Fords Prairie Overview
$31,968
PER CAPITA INCOME
$88,250
AVG FAMILY INCOME
$82,741
AVG HOUSEHOLD INCOME
31.7%
WAGE / INCOME GAP [ % ]
68.3¢/ $1
WAGE / INCOME GAP [ $ ]
$8,176
FAMILY INCOME DEFICIT
0.40
INEQUALITY / GINI INDEX
2,842
TOTAL POPULATION
1,373
MALE POPULATION
1,469
FEMALE POPULATION
93.46
MALES / 100 FEMALES
106.99
FEMALES / 100 MALES
45.0
MEDIAN AGE
3.2
AVG FAMILY SIZE
2.6
AVG HOUSEHOLD SIZE
1,376
LABOR FORCE [ PEOPLE ]
59.2%
PERCENT IN LABOR FORCE
4.1%
UNEMPLOYMENT RATE
Income in Fords Prairie
Income Overview in Fords Prairie
Per Capita Income in Fords Prairie is $31,968, while median incomes of families and households are $88,250 and $82,741 respectively.
| Characteristic | Number | Measure |
| Per Capita Income | 2,842 | $31,968 |
| Median Family Income | 621 | $88,250 |
| Mean Family Income | 621 | $94,650 |
| Median Household Income | 1,095 | $82,741 |
| Mean Household Income | 1,095 | $83,745 |
| Income Deficit | 621 | $8,176 |
| Wage / Income Gap (%) | 2,842 | 31.67% |
| Wage / Income Gap ($) | 2,842 | 68.33¢ per $1 |
| Gini / Inequality Index | 2,842 | 0.40 |
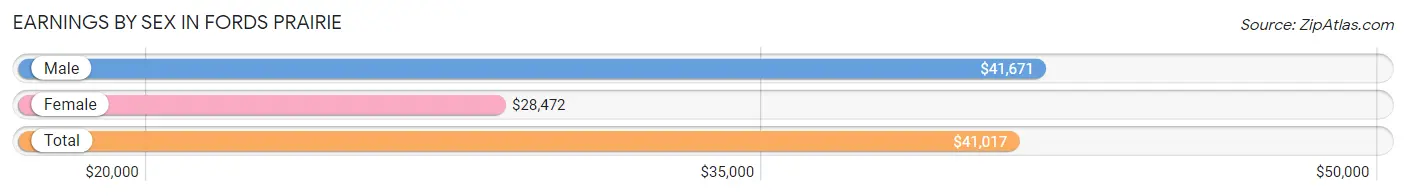
Earnings by Sex in Fords Prairie
Average Earnings in Fords Prairie are $41,017, $41,671 for men and $28,472 for women, a difference of 31.7%.
| Sex | Number | Average Earnings |
| Male | 752 (55.8%) | $41,671 |
| Female | 596 (44.2%) | $28,472 |
| Total | 1,348 (100.0%) | $41,017 |
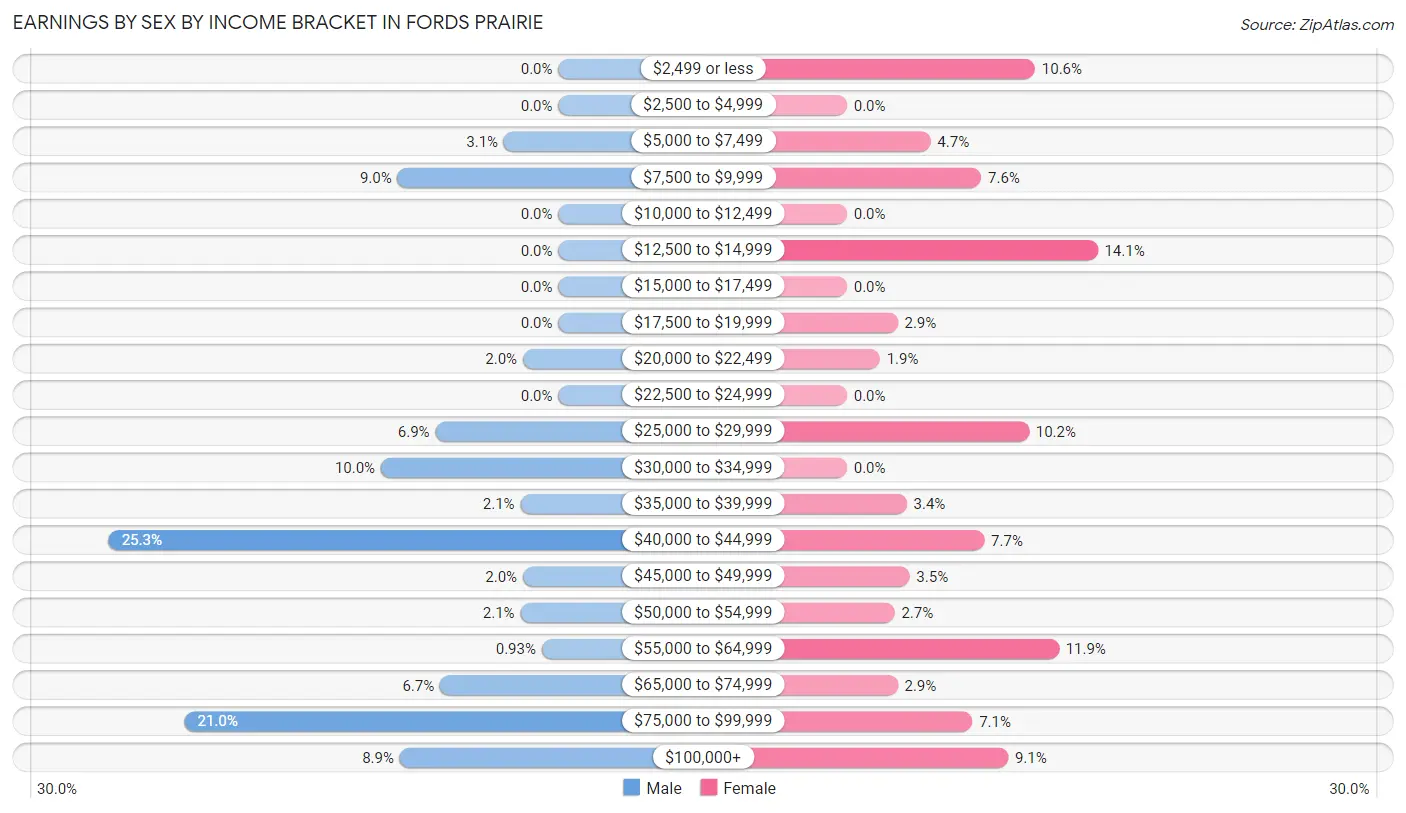
Earnings by Sex by Income Bracket in Fords Prairie
The most common earnings brackets in Fords Prairie are $40,000 to $44,999 for men (190 | 25.3%) and $12,500 to $14,999 for women (84 | 14.1%).
| Income | Male | Female |
| $2,499 or less | 0 (0.0%) | 63 (10.6%) |
| $2,500 to $4,999 | 0 (0.0%) | 0 (0.0%) |
| $5,000 to $7,499 | 23 (3.1%) | 28 (4.7%) |
| $7,500 to $9,999 | 68 (9.0%) | 45 (7.5%) |
| $10,000 to $12,499 | 0 (0.0%) | 0 (0.0%) |
| $12,500 to $14,999 | 0 (0.0%) | 84 (14.1%) |
| $15,000 to $17,499 | 0 (0.0%) | 0 (0.0%) |
| $17,500 to $19,999 | 0 (0.0%) | 17 (2.9%) |
| $20,000 to $22,499 | 15 (2.0%) | 11 (1.8%) |
| $22,500 to $24,999 | 0 (0.0%) | 0 (0.0%) |
| $25,000 to $29,999 | 52 (6.9%) | 61 (10.2%) |
| $30,000 to $34,999 | 75 (10.0%) | 0 (0.0%) |
| $35,000 to $39,999 | 16 (2.1%) | 20 (3.4%) |
| $40,000 to $44,999 | 190 (25.3%) | 46 (7.7%) |
| $45,000 to $49,999 | 15 (2.0%) | 21 (3.5%) |
| $50,000 to $54,999 | 16 (2.1%) | 16 (2.7%) |
| $55,000 to $64,999 | 7 (0.9%) | 71 (11.9%) |
| $65,000 to $74,999 | 50 (6.7%) | 17 (2.9%) |
| $75,000 to $99,999 | 158 (21.0%) | 42 (7.0%) |
| $100,000+ | 67 (8.9%) | 54 (9.1%) |
| Total | 752 (100.0%) | 596 (100.0%) |
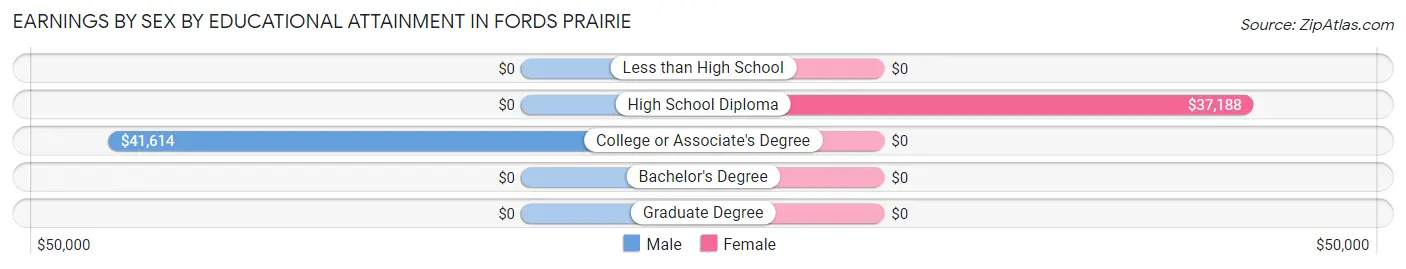
Earnings by Sex by Educational Attainment in Fords Prairie
Average earnings in Fords Prairie are $41,847 for men and $47,679 for women, a difference of 12.2%. Men with an educational attainment of college or associate's degree enjoy the highest average annual earnings of $41,614, while those with college or associate's degree education earn the least with $41,614. Women with an educational attainment of high school diploma earn the most with the average annual earnings of $37,188, while those with high school diploma education have the smallest earnings of $37,188.
| Educational Attainment | Male Income | Female Income |
| Less than High School | - | - |
| High School Diploma | - | - |
| College or Associate's Degree | $41,614 | $0 |
| Bachelor's Degree | - | - |
| Graduate Degree | - | - |
| Total | $41,847 | $47,679 |
Family Income in Fords Prairie
Family Income Brackets in Fords Prairie
According to the Fords Prairie family income data, there are 161 families falling into the $50,000 to $74,999 income range, which is the most common income bracket and makes up 25.9% of all families.
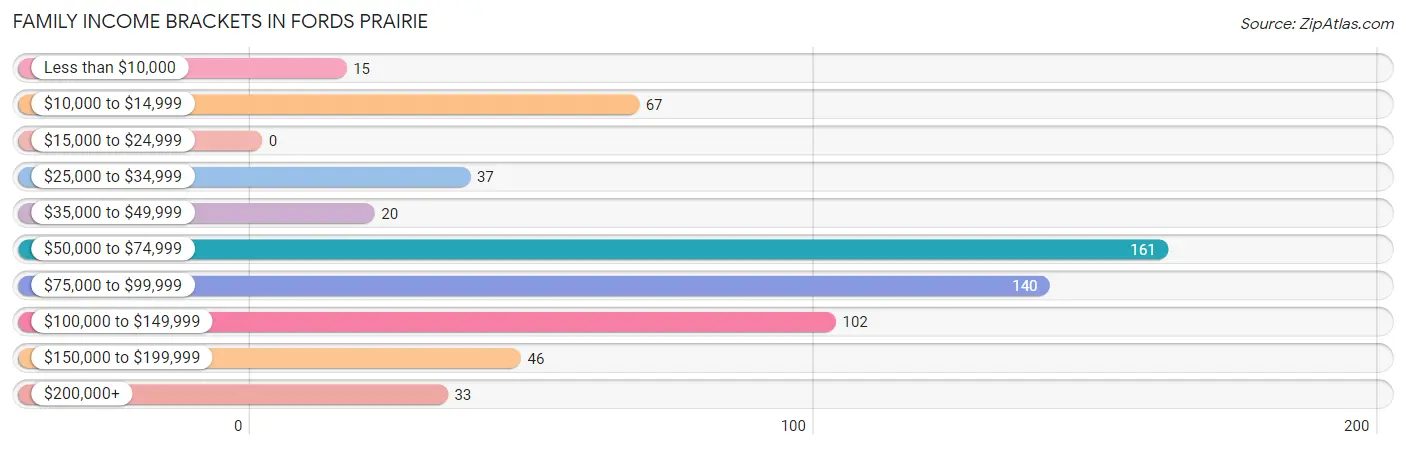
| Income Bracket | # Families | % Families |
| Less than $10,000 | 15 | 2.4% |
| $10,000 to $14,999 | 67 | 10.8% |
| $15,000 to $24,999 | 0 | 0.0% |
| $25,000 to $34,999 | 37 | 6.0% |
| $35,000 to $49,999 | 20 | 3.2% |
| $50,000 to $74,999 | 161 | 25.9% |
| $75,000 to $99,999 | 140 | 22.5% |
| $100,000 to $149,999 | 102 | 16.4% |
| $150,000 to $199,999 | 46 | 7.4% |
| $200,000+ | 33 | 5.3% |
Family Income by Famaliy Size in Fords Prairie
4-person families (137 | 22.1%) account for the highest median family income in Fords Prairie with $164,688 per family, while 4-person families (137 | 22.1%) have the highest median income of $41,172 per family member.
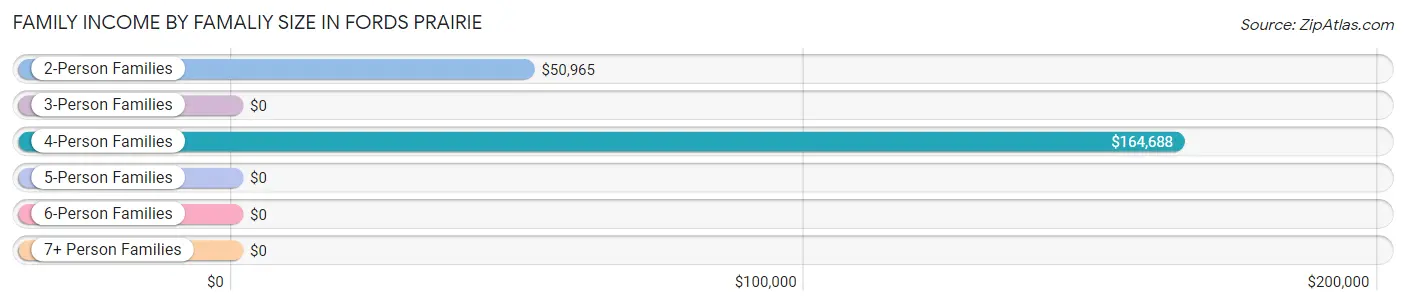
| Income Bracket | # Families | Median Income |
| 2-Person Families | 333 (53.6%) | $50,965 |
| 3-Person Families | 69 (11.1%) | $0 |
| 4-Person Families | 137 (22.1%) | $164,688 |
| 5-Person Families | 30 (4.8%) | $0 |
| 6-Person Families | 0 (0.0%) | $0 |
| 7+ Person Families | 52 (8.4%) | $0 |
| Total | 621 (100.0%) | $88,250 |
Family Income by Number of Earners in Fords Prairie
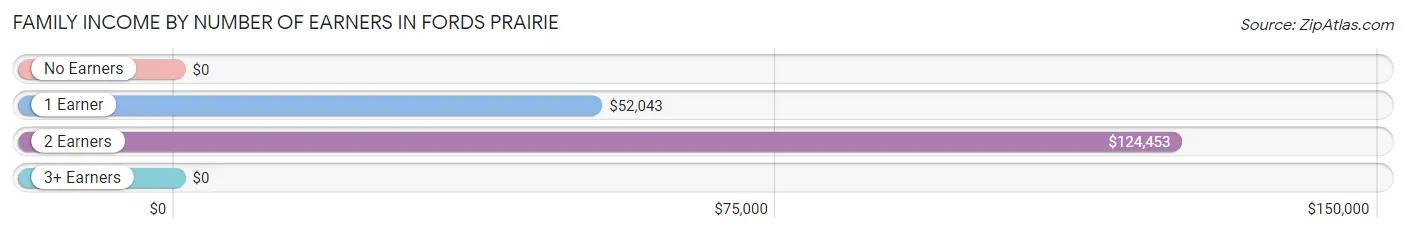
| Number of Earners | # Families | Median Income |
| No Earners | 107 (17.2%) | $0 |
| 1 Earner | 303 (48.8%) | $52,043 |
| 2 Earners | 141 (22.7%) | $124,453 |
| 3+ Earners | 70 (11.3%) | $0 |
| Total | 621 (100.0%) | $88,250 |
Household Income in Fords Prairie
Household Income Brackets in Fords Prairie
With 304 households falling in the category, the $75,000 to $99,999 income range is the most frequent in Fords Prairie, accounting for 27.8% of all households. In contrast, only 13 households (1.2%) fall into the $15,000 to $24,999 income bracket, making it the least populous group.
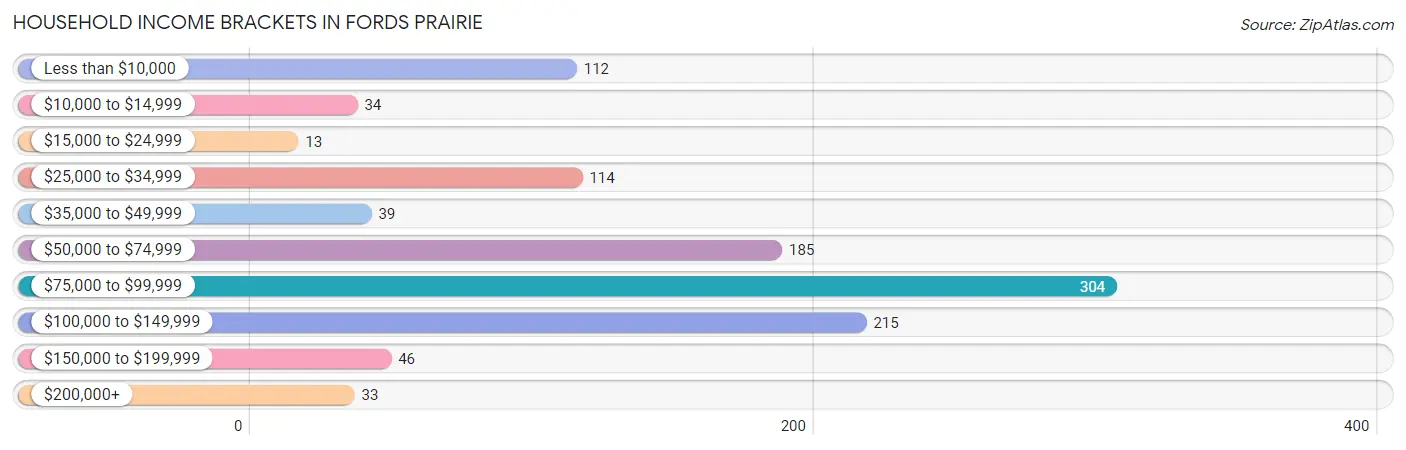
| Income Bracket | # Households | % Households |
| Less than $10,000 | 112 | 10.2% |
| $10,000 to $14,999 | 34 | 3.1% |
| $15,000 to $24,999 | 13 | 1.2% |
| $25,000 to $34,999 | 114 | 10.4% |
| $35,000 to $49,999 | 39 | 3.6% |
| $50,000 to $74,999 | 185 | 16.9% |
| $75,000 to $99,999 | 304 | 27.8% |
| $100,000 to $149,999 | 215 | 19.6% |
| $150,000 to $199,999 | 46 | 4.2% |
| $200,000+ | 33 | 3.0% |
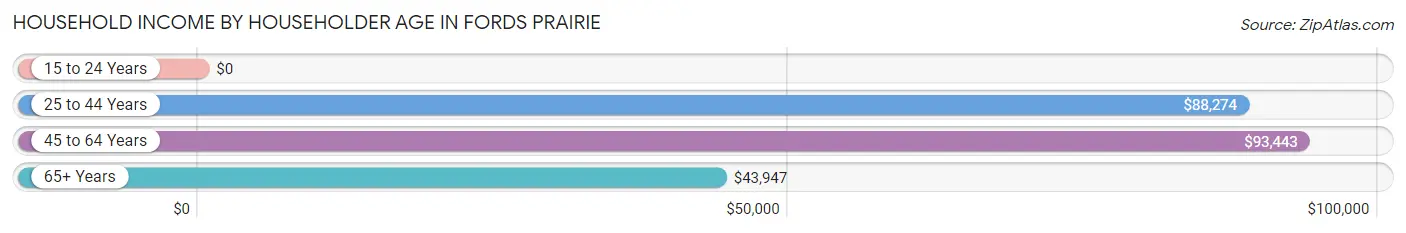
Household Income by Householder Age in Fords Prairie
The median household income in Fords Prairie is $82,741, with the highest median household income of $93,443 found in the 45 to 64 years age bracket for the primary householder. A total of 554 households (50.6%) fall into this category. Meanwhile, the 15 to 24 years age bracket for the primary householder has the lowest median household income of $0, with 46 households (4.2%) in this group.
| Income Bracket | # Households | Median Income |
| 15 to 24 Years | 46 (4.2%) | $0 |
| 25 to 44 Years | 211 (19.3%) | $88,274 |
| 45 to 64 Years | 554 (50.6%) | $93,443 |
| 65+ Years | 284 (25.9%) | $43,947 |
| Total | 1,095 (100.0%) | $82,741 |
Poverty in Fords Prairie
Income Below Poverty by Sex and Age in Fords Prairie
With 4.0% poverty level for males and 21.0% for females among the residents of Fords Prairie, under 5 year old males and 75 year old and over females are the most vulnerable to poverty, with 36 males (54.5%) and 59 females (67.0%) in their respective age groups living below the poverty level.

| Age Bracket | Male | Female |
| Under 5 Years | 36 (54.5%) | 0 (0.0%) |
| 5 Years | 0 (0.0%) | 0 (0.0%) |
| 6 to 11 Years | 0 (0.0%) | 0 (0.0%) |
| 12 to 14 Years | 0 (0.0%) | 0 (0.0%) |
| 15 Years | 0 (0.0%) | 0 (0.0%) |
| 16 and 17 Years | 0 (0.0%) | 0 (0.0%) |
| 18 to 24 Years | 0 (0.0%) | 0 (0.0%) |
| 25 to 34 Years | 4 (1.8%) | 101 (58.7%) |
| 35 to 44 Years | 0 (0.0%) | 15 (13.0%) |
| 45 to 54 Years | 0 (0.0%) | 0 (0.0%) |
| 55 to 64 Years | 0 (0.0%) | 117 (32.3%) |
| 65 to 74 Years | 14 (12.0%) | 16 (9.6%) |
| 75 Years and over | 0 (0.0%) | 59 (67.0%) |
| Total | 54 (4.0%) | 308 (21.0%) |
Income Above Poverty by Sex and Age in Fords Prairie
According to the poverty statistics in Fords Prairie, males aged 6 to 11 years and females aged under 5 years are the age groups that are most secure financially, with 100.0% of males and 100.0% of females in these age groups living above the poverty line.
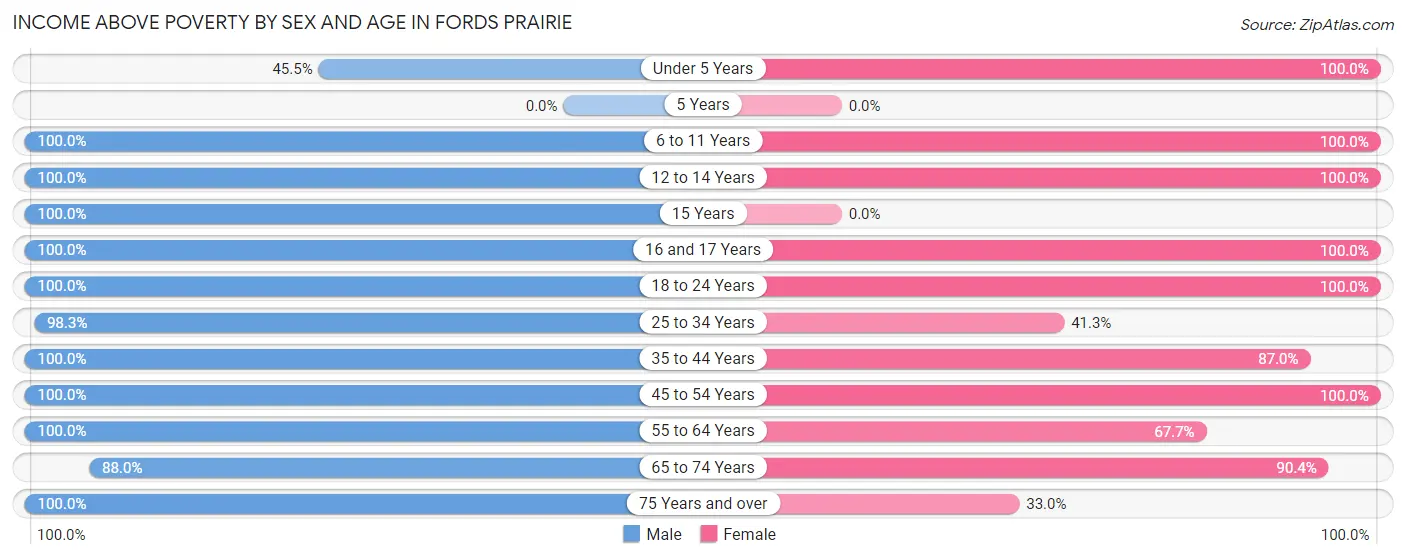
| Age Bracket | Male | Female |
| Under 5 Years | 30 (45.5%) | 53 (100.0%) |
| 5 Years | 0 (0.0%) | 0 (0.0%) |
| 6 to 11 Years | 187 (100.0%) | 88 (100.0%) |
| 12 to 14 Years | 25 (100.0%) | 69 (100.0%) |
| 15 Years | 19 (100.0%) | 0 (0.0%) |
| 16 and 17 Years | 11 (100.0%) | 37 (100.0%) |
| 18 to 24 Years | 101 (100.0%) | 157 (100.0%) |
| 25 to 34 Years | 224 (98.3%) | 71 (41.3%) |
| 35 to 44 Years | 81 (100.0%) | 100 (87.0%) |
| 45 to 54 Years | 273 (100.0%) | 162 (100.0%) |
| 55 to 64 Years | 227 (100.0%) | 245 (67.7%) |
| 65 to 74 Years | 103 (88.0%) | 150 (90.4%) |
| 75 Years and over | 28 (100.0%) | 29 (33.0%) |
| Total | 1,309 (96.0%) | 1,161 (79.0%) |
Income Below Poverty Among Married-Couple Families in Fords Prairie
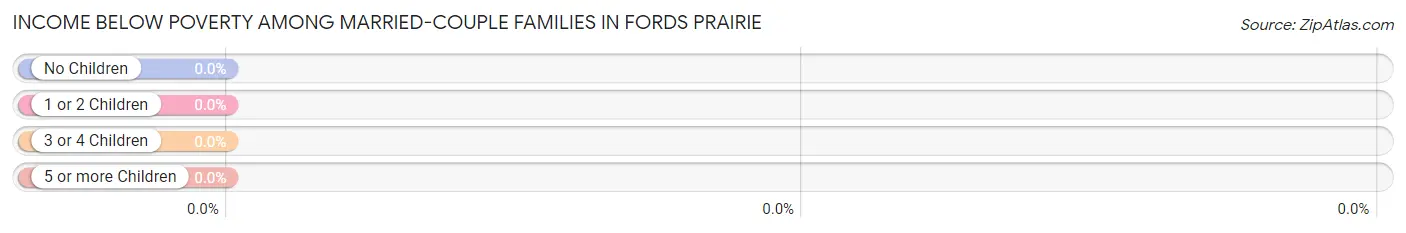
| Children | Above Poverty | Below Poverty |
| No Children | 227 (100.0%) | 0 (0.0%) |
| 1 or 2 Children | 124 (100.0%) | 0 (0.0%) |
| 3 or 4 Children | 16 (100.0%) | 0 (0.0%) |
| 5 or more Children | 52 (100.0%) | 0 (0.0%) |
| Total | 419 (100.0%) | 0 (0.0%) |
Income Below Poverty Among Single-Parent Households in Fords Prairie
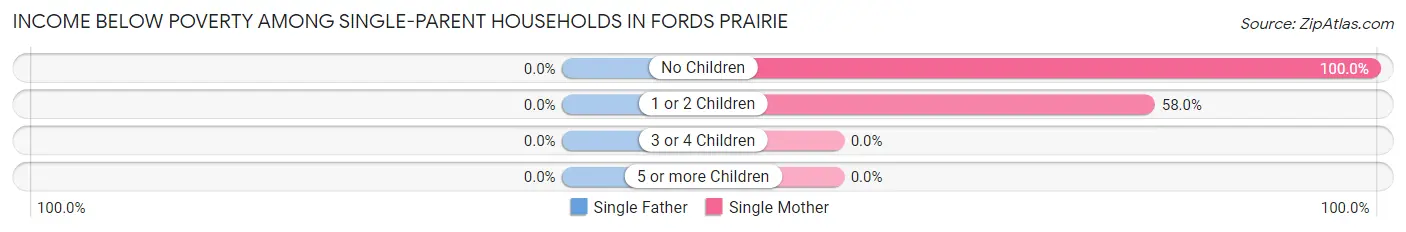
| Children | Single Father | Single Mother |
| No Children | 0 (0.0%) | 31 (100.0%) |
| 1 or 2 Children | 0 (0.0%) | 51 (58.0%) |
| 3 or 4 Children | 0 (0.0%) | 0 (0.0%) |
| 5 or more Children | 0 (0.0%) | 0 (0.0%) |
| Total | 0 (0.0%) | 82 (68.9%) |
Income Below Poverty Among Married-Couple vs Single-Parent Households in Fords Prairie
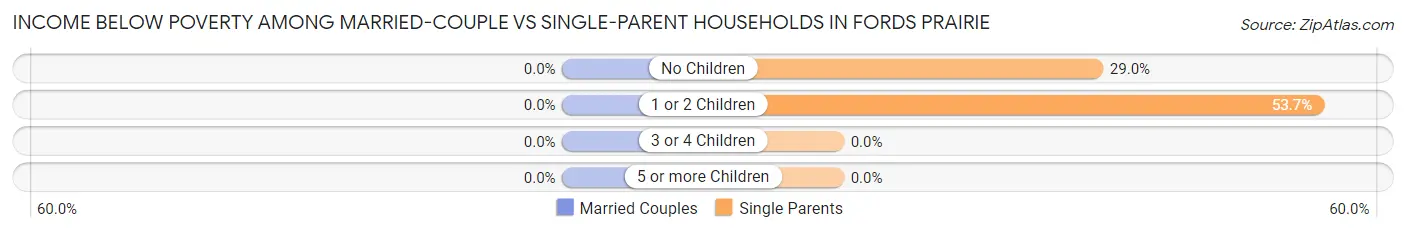
| Children | Married-Couple Families | Single-Parent Households |
| No Children | 0 (0.0%) | 31 (29.0%) |
| 1 or 2 Children | 0 (0.0%) | 51 (53.7%) |
| 3 or 4 Children | 0 (0.0%) | 0 (0.0%) |
| 5 or more Children | 0 (0.0%) | 0 (0.0%) |
| Total | 0 (0.0%) | 82 (40.6%) |
Race in Fords Prairie
The most populous races in Fords Prairie are White / Caucasian (2,396 | 84.3%), Two or more Races (289 | 10.2%), and Hispanic or Latino (218 | 7.7%).
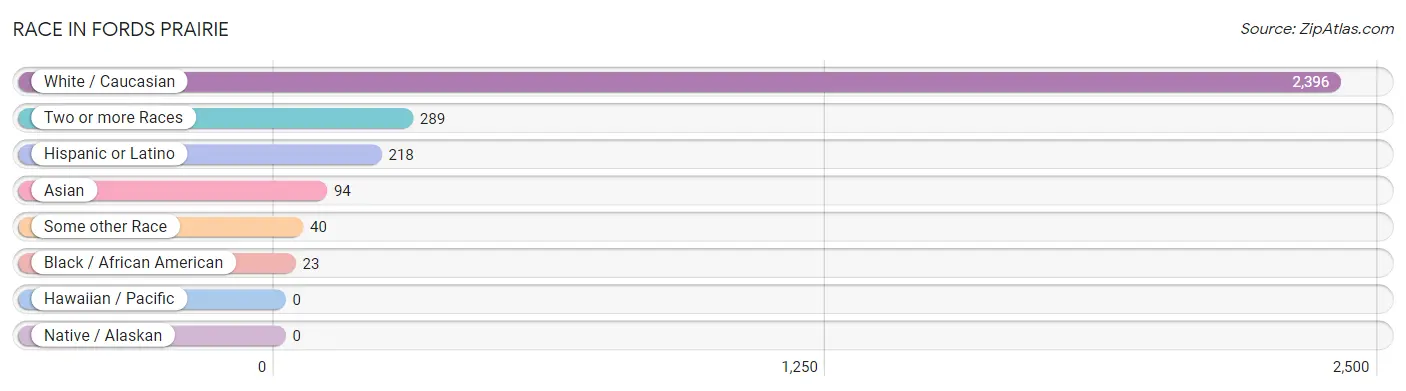
| Race | # Population | % Population |
| Asian | 94 | 3.3% |
| Black / African American | 23 | 0.8% |
| Hawaiian / Pacific | 0 | 0.0% |
| Hispanic or Latino | 218 | 7.7% |
| Native / Alaskan | 0 | 0.0% |
| White / Caucasian | 2,396 | 84.3% |
| Two or more Races | 289 | 10.2% |
| Some other Race | 40 | 1.4% |
| Total | 2,842 | 100.0% |
Ancestry in Fords Prairie
The most populous ancestries reported in Fords Prairie are German (490 | 17.2%), Irish (377 | 13.3%), Norwegian (222 | 7.8%), English (214 | 7.5%), and American (174 | 6.1%), together accounting for 52.0% of all Fords Prairie residents.
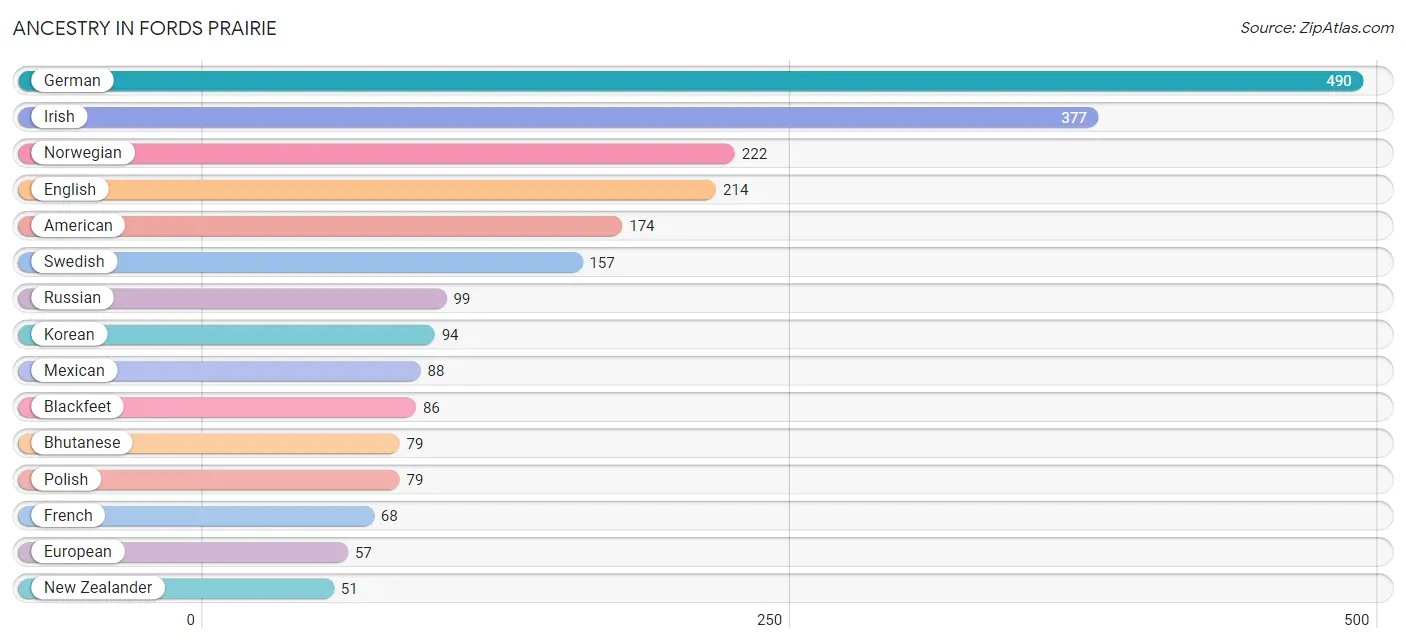
| Ancestry | # Population | % Population |
| American | 174 | 6.1% |
| Bhutanese | 79 | 2.8% |
| Blackfeet | 86 | 3.0% |
| British | 48 | 1.7% |
| Cuban | 26 | 0.9% |
| Dutch | 42 | 1.5% |
| English | 214 | 7.5% |
| European | 57 | 2.0% |
| French | 68 | 2.4% |
| German | 490 | 17.2% |
| Greek | 17 | 0.6% |
| Irish | 377 | 13.3% |
| Italian | 34 | 1.2% |
| Korean | 94 | 3.3% |
| Mexican | 88 | 3.1% |
| New Zealander | 51 | 1.8% |
| Norwegian | 222 | 7.8% |
| Polish | 79 | 2.8% |
| Puerto Rican | 28 | 1.0% |
| Russian | 99 | 3.5% |
| Scandinavian | 16 | 0.6% |
| Scotch-Irish | 16 | 0.6% |
| Swedish | 157 | 5.5% | View All 23 Rows |
Immigrants in Fords Prairie
The most numerous immigrant groups reported in Fords Prairie came from Asia (66 | 2.3%), Philippines (66 | 2.3%), South Eastern Asia (66 | 2.3%), and Oceania (21 | 0.7%), together accounting for 7.7% of all Fords Prairie residents.
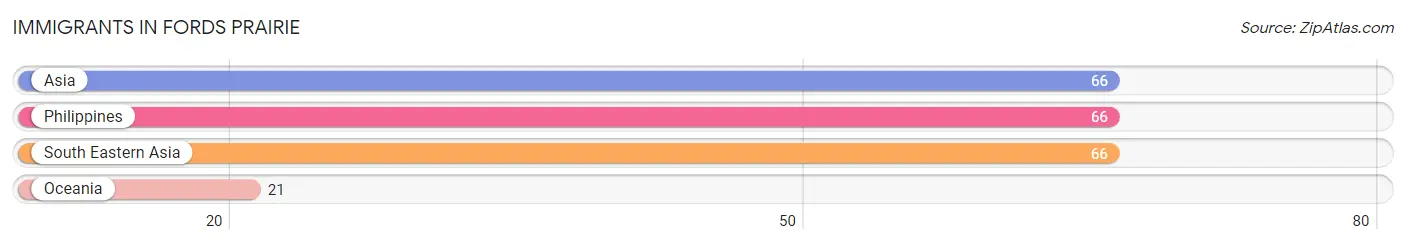
| Immigration Origin | # Population | % Population |
| Asia | 66 | 2.3% |
| Oceania | 21 | 0.7% |
| Philippines | 66 | 2.3% |
| South Eastern Asia | 66 | 2.3% | View All 4 Rows |
Sex and Age in Fords Prairie
Sex and Age in Fords Prairie
The most populous age groups in Fords Prairie are 25 to 29 Years (172 | 12.5%) for men and 55 to 59 Years (208 | 14.2%) for women.
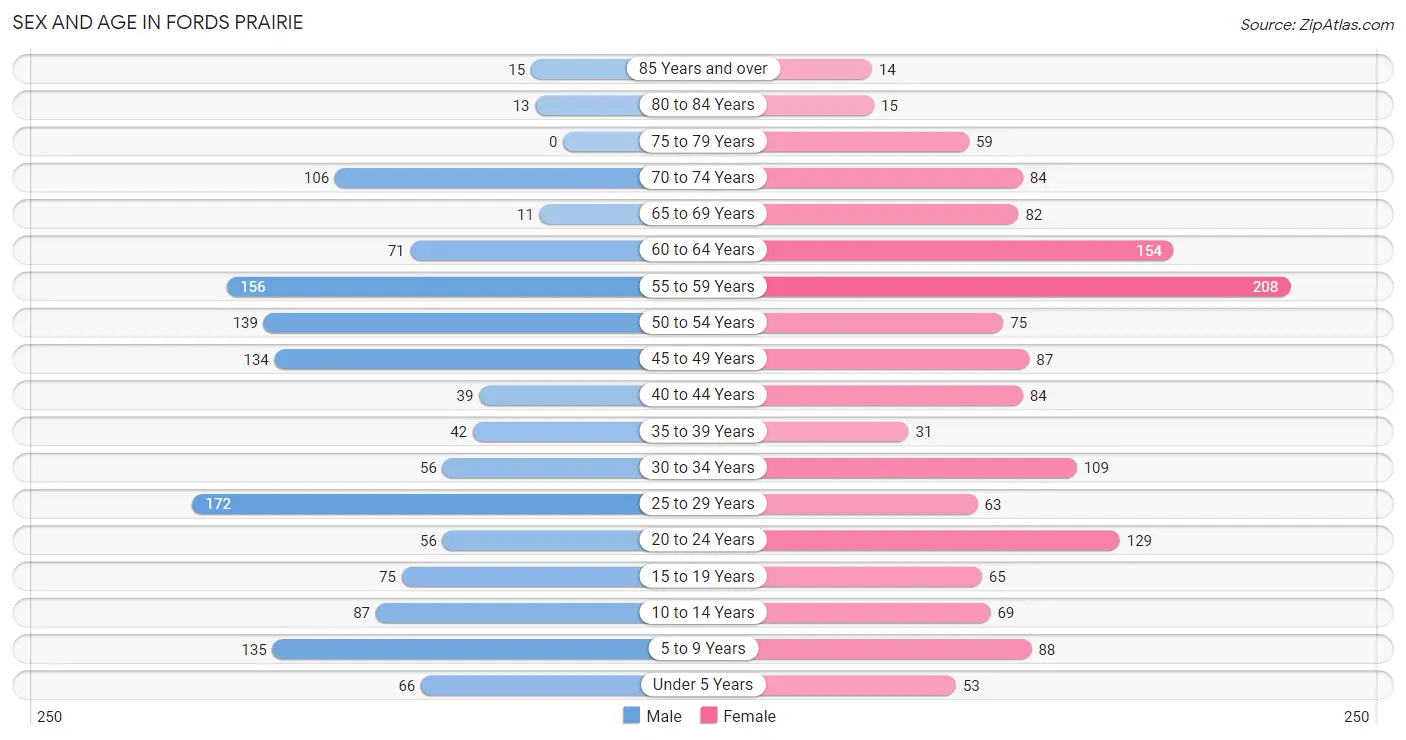
| Age Bracket | Male | Female |
| Under 5 Years | 66 (4.8%) | 53 (3.6%) |
| 5 to 9 Years | 135 (9.8%) | 88 (6.0%) |
| 10 to 14 Years | 87 (6.3%) | 69 (4.7%) |
| 15 to 19 Years | 75 (5.5%) | 65 (4.4%) |
| 20 to 24 Years | 56 (4.1%) | 129 (8.8%) |
| 25 to 29 Years | 172 (12.5%) | 63 (4.3%) |
| 30 to 34 Years | 56 (4.1%) | 109 (7.4%) |
| 35 to 39 Years | 42 (3.1%) | 31 (2.1%) |
| 40 to 44 Years | 39 (2.8%) | 84 (5.7%) |
| 45 to 49 Years | 134 (9.8%) | 87 (5.9%) |
| 50 to 54 Years | 139 (10.1%) | 75 (5.1%) |
| 55 to 59 Years | 156 (11.4%) | 208 (14.2%) |
| 60 to 64 Years | 71 (5.2%) | 154 (10.5%) |
| 65 to 69 Years | 11 (0.8%) | 82 (5.6%) |
| 70 to 74 Years | 106 (7.7%) | 84 (5.7%) |
| 75 to 79 Years | 0 (0.0%) | 59 (4.0%) |
| 80 to 84 Years | 13 (0.9%) | 15 (1.0%) |
| 85 Years and over | 15 (1.1%) | 14 (0.9%) |
| Total | 1,373 (100.0%) | 1,469 (100.0%) |
Families and Households in Fords Prairie
Median Family Size in Fords Prairie
The median family size in Fords Prairie is 3.21 persons per family, with married-couple families (419 | 67.5%) accounting for the largest median family size of 3.66 persons per family. On the other hand, single female/mother families (119 | 19.2%) represent the smallest median family size with 2.11 persons per family.
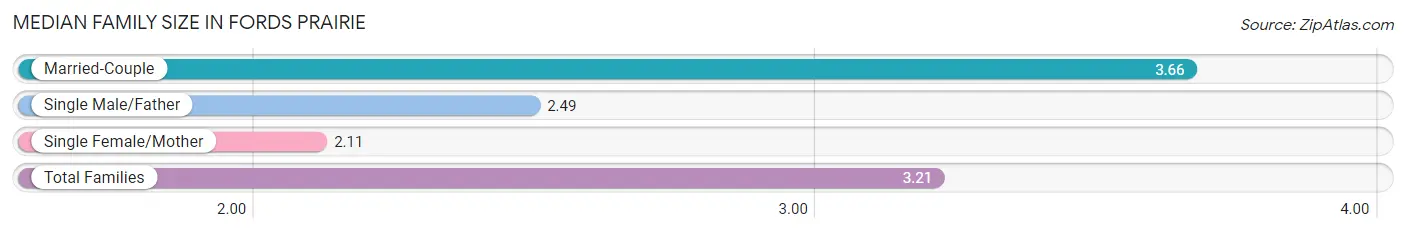
| Family Type | # Families | Family Size |
| Married-Couple | 419 (67.5%) | 3.66 |
| Single Male/Father | 83 (13.4%) | 2.49 |
| Single Female/Mother | 119 (19.2%) | 2.11 |
| Total Families | 621 (100.0%) | 3.21 |
Median Household Size in Fords Prairie
The median household size in Fords Prairie is 2.60 persons per household, with married-couple households (419 | 38.3%) accounting for the largest median household size of 3.66 persons per household. non-family households (474 | 43.3%) represent the smallest median household size with 1.38 persons per household.
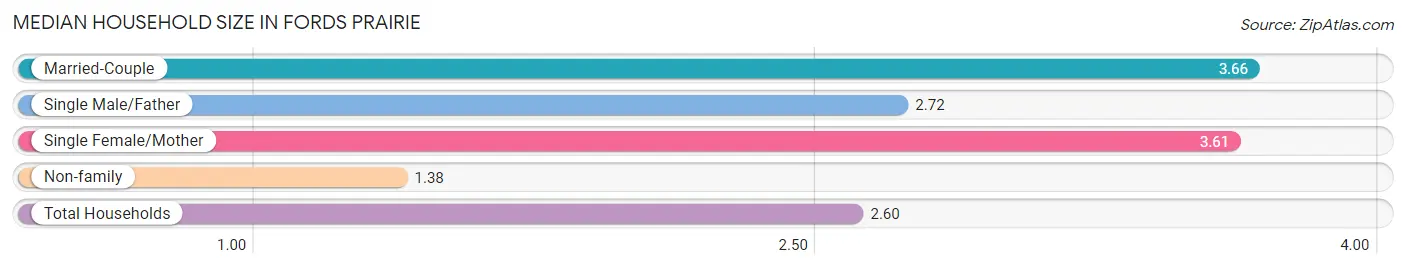
| Household Type | # Households | Household Size |
| Married-Couple | 419 (38.3%) | 3.66 |
| Single Male/Father | 83 (7.6%) | 2.72 |
| Single Female/Mother | 119 (10.9%) | 3.61 |
| Non-family | 474 (43.3%) | 1.38 |
| Total Households | 1,095 (100.0%) | 2.60 |
Household Size by Marriage Status in Fords Prairie
Out of a total of 1,095 households in Fords Prairie, 621 (56.7%) are family households, while 474 (43.3%) are nonfamily households. The most numerous type of family households are 2-person households, comprising 275, and the most common type of nonfamily households are 1-person households, comprising 329.
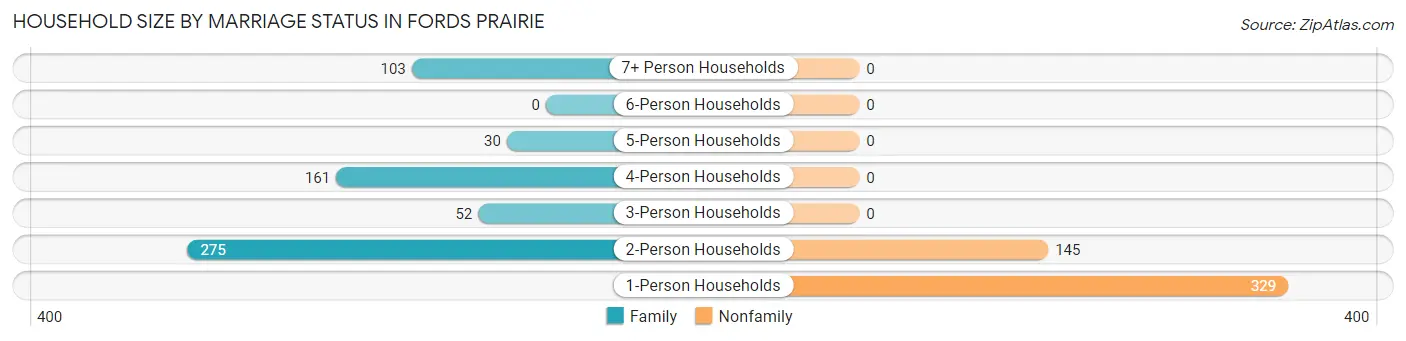
| Household Size | Family Households | Nonfamily Households |
| 1-Person Households | - | 329 (30.0%) |
| 2-Person Households | 275 (25.1%) | 145 (13.2%) |
| 3-Person Households | 52 (4.8%) | 0 (0.0%) |
| 4-Person Households | 161 (14.7%) | 0 (0.0%) |
| 5-Person Households | 30 (2.7%) | 0 (0.0%) |
| 6-Person Households | 0 (0.0%) | 0 (0.0%) |
| 7+ Person Households | 103 (9.4%) | 0 (0.0%) |
| Total | 621 (56.7%) | 474 (43.3%) |
Female Fertility in Fords Prairie
Fertility by Age in Fords Prairie
| Age Bracket | Women with Births | Births / 1,000 Women |
| 15 to 19 years | 0 (0.0%) | 0.0 |
| 20 to 34 years | 0 (0.0%) | 0.0 |
| 35 to 50 years | 0 (0.0%) | 0.0 |
| Total | 0 (0.0%) | 0.0 |
Fertility by Age by Marriage Status in Fords Prairie
| Age Bracket | Married | Unmarried |
| 15 to 19 years | 0 (0.0%) | 0 (0.0%) |
| 20 to 34 years | 0 (0.0%) | 0 (0.0%) |
| 35 to 50 years | 0 (0.0%) | 0 (0.0%) |
| Total | 0 (0.0%) | 0 (0.0%) |
Fertility by Education in Fords Prairie
| Educational Attainment | Women with Births | Births / 1,000 Women |
| Less than High School | 0 (0.0%) | 0.0 |
| High School Diploma | 0 (0.0%) | 0.0 |
| College or Associate's Degree | 0 (0.0%) | 0.0 |
| Bachelor's Degree | 0 (0.0%) | 0.0 |
| Graduate Degree | 0 (0.0%) | 0.0 |
| Total | 0 (0.0%) | 0.0 |
Fertility by Education by Marriage Status in Fords Prairie
| Educational Attainment | Married | Unmarried |
| Less than High School | 0 (0.0%) | 0 (0.0%) |
| High School Diploma | 0 (0.0%) | 0 (0.0%) |
| College or Associate's Degree | 0 (0.0%) | 0 (0.0%) |
| Bachelor's Degree | 0 (0.0%) | 0 (0.0%) |
| Graduate Degree | 0 (0.0%) | 0 (0.0%) |
| Total | 0 (0.0%) | 0 (0.0%) |
Employment Characteristics in Fords Prairie
Employment by Class of Employer in Fords Prairie
Among the 1,268 employed individuals in Fords Prairie, private company employees (743 | 58.6%), not-for-profit organizations (177 | 14.0%), and state government employees (105 | 8.3%) make up the most common classes of employment.
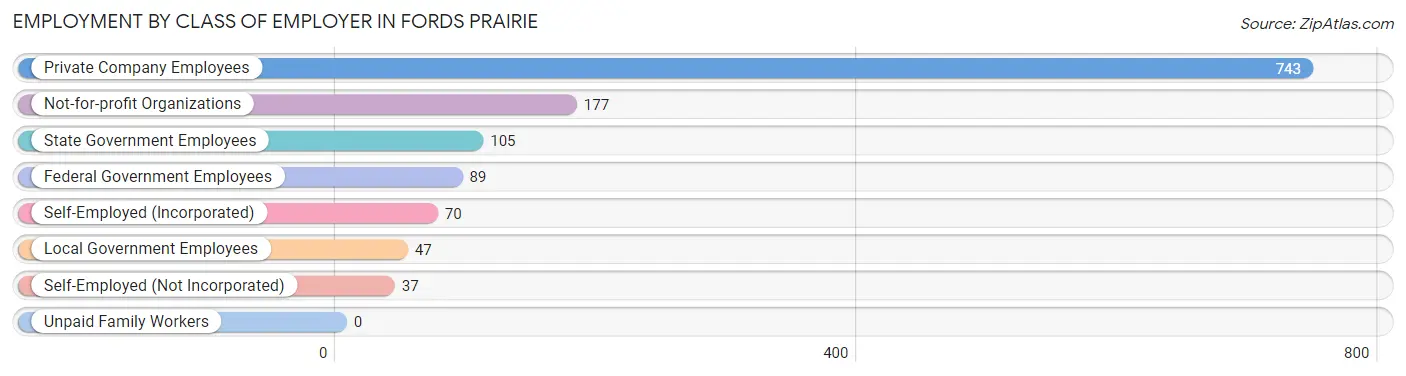
| Employer Class | # Employees | % Employees |
| Private Company Employees | 743 | 58.6% |
| Self-Employed (Incorporated) | 70 | 5.5% |
| Self-Employed (Not Incorporated) | 37 | 2.9% |
| Not-for-profit Organizations | 177 | 14.0% |
| Local Government Employees | 47 | 3.7% |
| State Government Employees | 105 | 8.3% |
| Federal Government Employees | 89 | 7.0% |
| Unpaid Family Workers | 0 | 0.0% |
| Total | 1,268 | 100.0% |
Employment Status by Age in Fords Prairie
According to the labor force statistics for Fords Prairie, out of the total population over 16 years of age (2,325), 59.2% or 1,376 individuals are in the labor force, with 4.1% or 56 of them unemployed. The age group with the highest labor force participation rate is 20 to 24 years, with 100.0% or 185 individuals in the labor force. Within the labor force, the 16 to 19 years age range has the highest percentage of unemployed individuals, with 100.0% or 45 of them being unemployed.
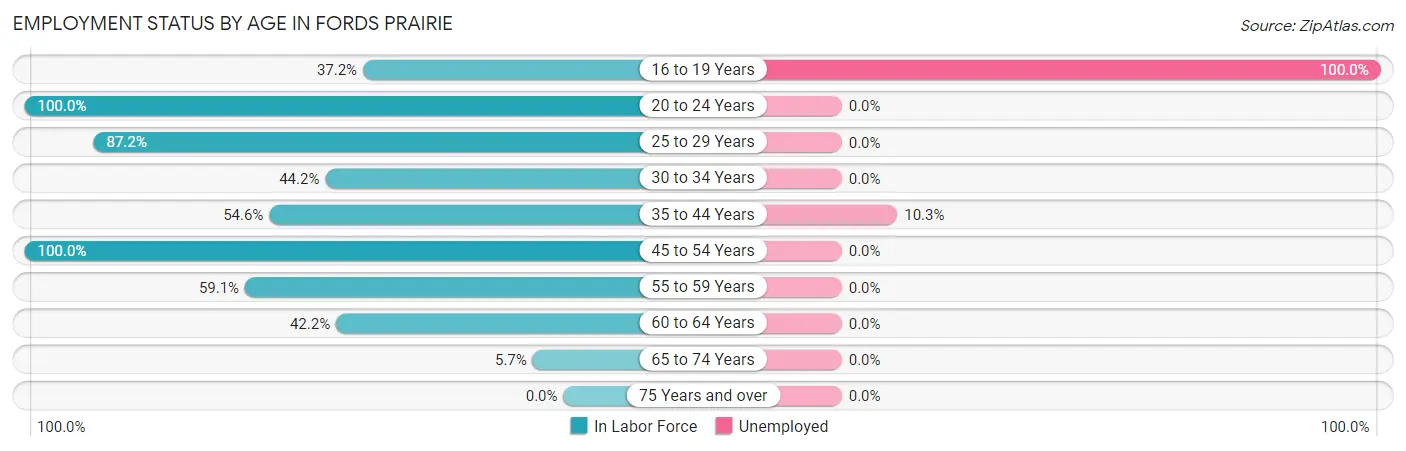
| Age Bracket | In Labor Force | Unemployed |
| 16 to 19 Years | 45 (37.2%) | 45 (100.0%) |
| 20 to 24 Years | 185 (100.0%) | 0 (0.0%) |
| 25 to 29 Years | 205 (87.2%) | 0 (0.0%) |
| 30 to 34 Years | 73 (44.2%) | 0 (0.0%) |
| 35 to 44 Years | 107 (54.6%) | 11 (10.3%) |
| 45 to 54 Years | 435 (100.0%) | 0 (0.0%) |
| 55 to 59 Years | 215 (59.1%) | 0 (0.0%) |
| 60 to 64 Years | 95 (42.2%) | 0 (0.0%) |
| 65 to 74 Years | 16 (5.7%) | 0 (0.0%) |
| 75 Years and over | 0 (0.0%) | 0 (0.0%) |
| Total | 1,376 (59.2%) | 56 (4.1%) |
Employment Status by Educational Attainment in Fords Prairie
According to labor force statistics for Fords Prairie, 69.8% of individuals (1,131) out of the total population between 25 and 64 years of age (1,620) are in the labor force, with 1.0% or 11 of them being unemployed. The group with the highest labor force participation rate are those with the educational attainment of less than high school, with 100.0% or 23 individuals in the labor force. Within the labor force, individuals with high school diploma education have the highest percentage of unemployment, with 3.6% or 11 of them being unemployed.
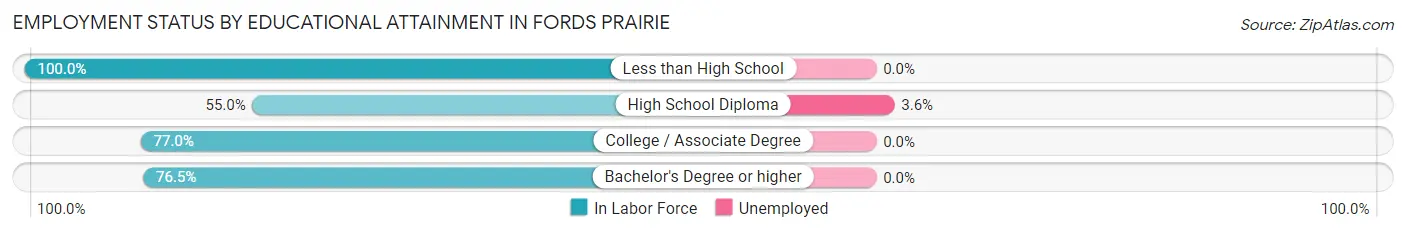
| Educational Attainment | In Labor Force | Unemployed |
| Less than High School | 23 (100.0%) | 0 (0.0%) |
| High School Diploma | 303 (55.0%) | 20 (3.6%) |
| College / Associate Degree | 628 (77.0%) | 0 (0.0%) |
| Bachelor's Degree or higher | 176 (76.5%) | 0 (0.0%) |
| Total | 1,131 (69.8%) | 16 (1.0%) |
Employment Occupations by Sex in Fords Prairie
Management, Business, Science and Arts Occupations
The most common Management, Business, Science and Arts occupations in Fords Prairie are Community & Social Service (159 | 12.0%), Education Instruction & Library (111 | 8.4%), Health Diagnosing & Treating (52 | 3.9%), Health Technologists (52 | 3.9%), and Business & Financial (38 | 2.9%).
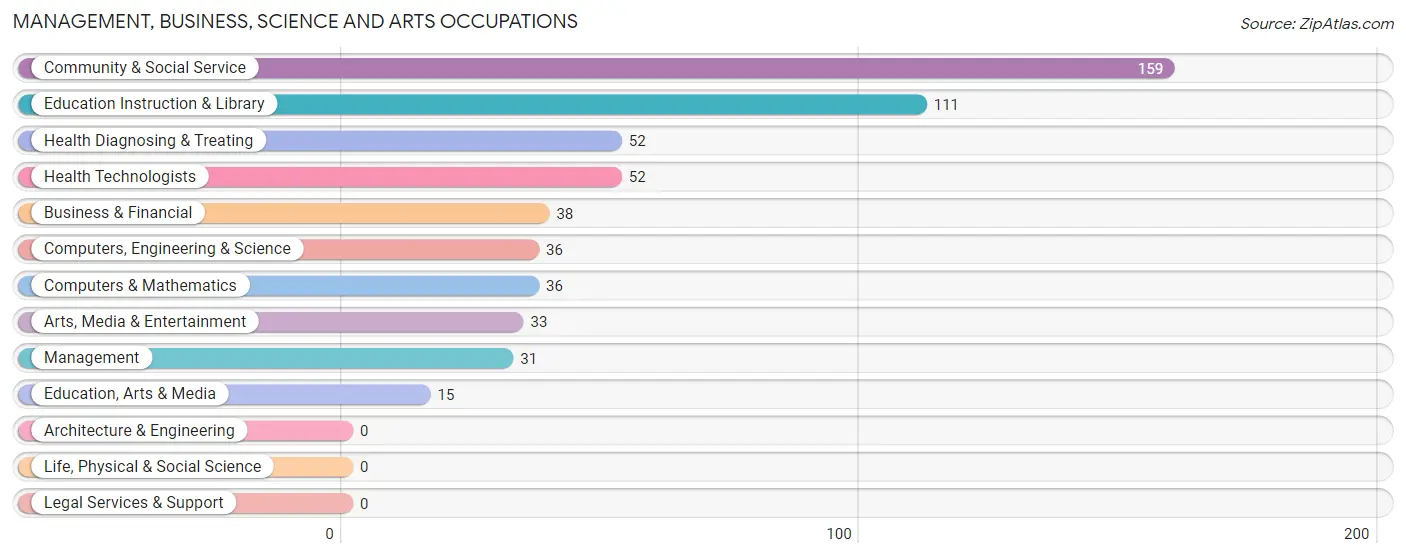
Management, Business, Science and Arts Occupations by Sex
Within the Management, Business, Science and Arts occupations in Fords Prairie, the most male-oriented occupations are Management (100.0%), Computers, Engineering & Science (100.0%), and Computers & Mathematics (100.0%), while the most female-oriented occupations are Arts, Media & Entertainment (100.0%), Health Diagnosing & Treating (100.0%), and Health Technologists (100.0%).
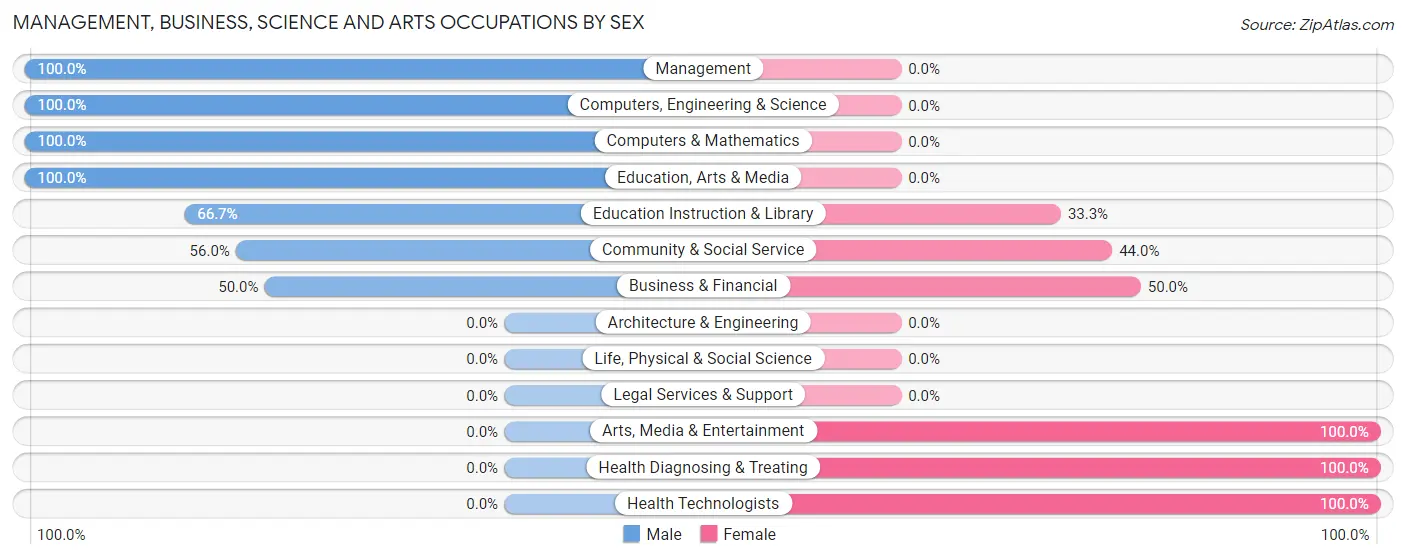
| Occupation | Male | Female |
| Management | 31 (100.0%) | 0 (0.0%) |
| Business & Financial | 19 (50.0%) | 19 (50.0%) |
| Computers, Engineering & Science | 36 (100.0%) | 0 (0.0%) |
| Computers & Mathematics | 36 (100.0%) | 0 (0.0%) |
| Architecture & Engineering | 0 (0.0%) | 0 (0.0%) |
| Life, Physical & Social Science | 0 (0.0%) | 0 (0.0%) |
| Community & Social Service | 89 (56.0%) | 70 (44.0%) |
| Education, Arts & Media | 15 (100.0%) | 0 (0.0%) |
| Legal Services & Support | 0 (0.0%) | 0 (0.0%) |
| Education Instruction & Library | 74 (66.7%) | 37 (33.3%) |
| Arts, Media & Entertainment | 0 (0.0%) | 33 (100.0%) |
| Health Diagnosing & Treating | 0 (0.0%) | 52 (100.0%) |
| Health Technologists | 0 (0.0%) | 52 (100.0%) |
| Total (Category) | 175 (55.4%) | 141 (44.6%) |
| Total (Overall) | 752 (57.0%) | 568 (43.0%) |
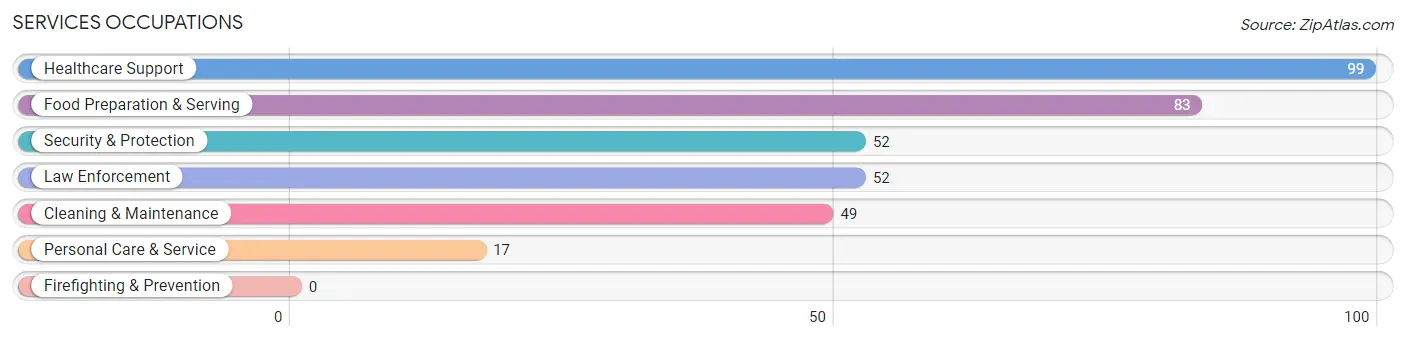
Services Occupations
The most common Services occupations in Fords Prairie are Healthcare Support (99 | 7.5%), Food Preparation & Serving (83 | 6.3%), Security & Protection (52 | 3.9%), Law Enforcement (52 | 3.9%), and Cleaning & Maintenance (49 | 3.7%).
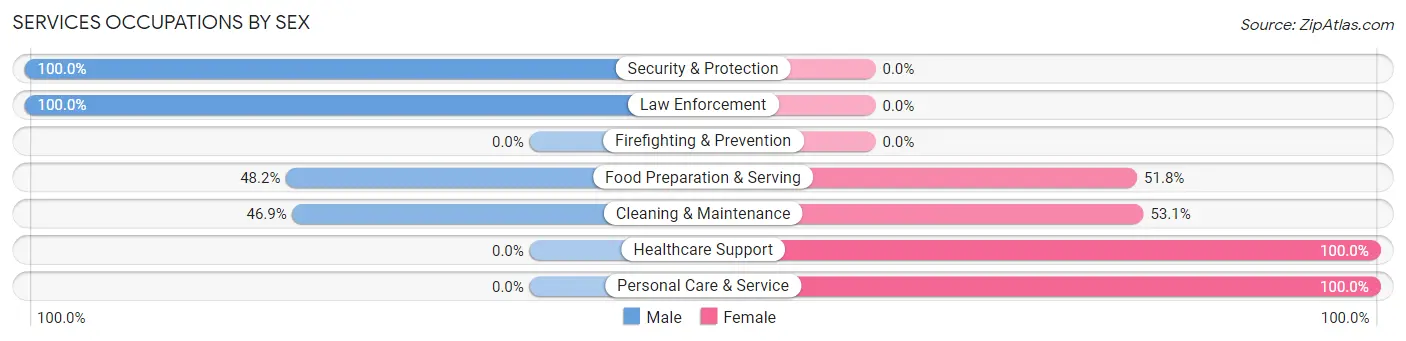
Services Occupations by Sex
Within the Services occupations in Fords Prairie, the most male-oriented occupations are Security & Protection (100.0%), Law Enforcement (100.0%), and Food Preparation & Serving (48.2%), while the most female-oriented occupations are Healthcare Support (100.0%), Personal Care & Service (100.0%), and Cleaning & Maintenance (53.1%).
| Occupation | Male | Female |
| Healthcare Support | 0 (0.0%) | 99 (100.0%) |
| Security & Protection | 52 (100.0%) | 0 (0.0%) |
| Firefighting & Prevention | 0 (0.0%) | 0 (0.0%) |
| Law Enforcement | 52 (100.0%) | 0 (0.0%) |
| Food Preparation & Serving | 40 (48.2%) | 43 (51.8%) |
| Cleaning & Maintenance | 23 (46.9%) | 26 (53.1%) |
| Personal Care & Service | 0 (0.0%) | 17 (100.0%) |
| Total (Category) | 115 (38.3%) | 185 (61.7%) |
| Total (Overall) | 752 (57.0%) | 568 (43.0%) |
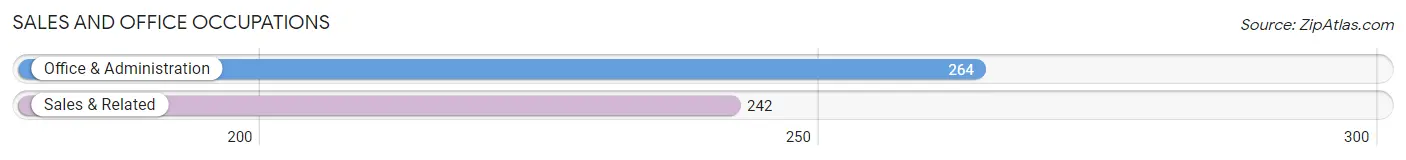
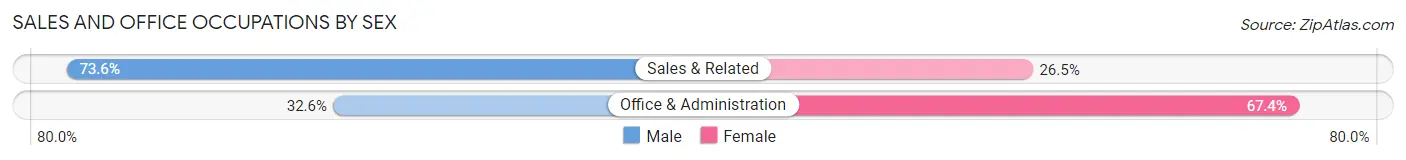
Sales and Office Occupations
The most common Sales and Office occupations in Fords Prairie are Office & Administration (264 | 20.0%), and Sales & Related (242 | 18.3%).
Sales and Office Occupations by Sex
| Occupation | Male | Female |
| Sales & Related | 178 (73.6%) | 64 (26.5%) |
| Office & Administration | 86 (32.6%) | 178 (67.4%) |
| Total (Category) | 264 (52.2%) | 242 (47.8%) |
| Total (Overall) | 752 (57.0%) | 568 (43.0%) |
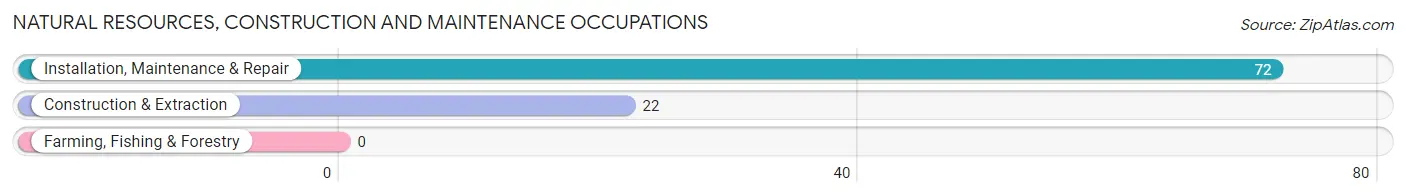
Natural Resources, Construction and Maintenance Occupations
The most common Natural Resources, Construction and Maintenance occupations in Fords Prairie are Installation, Maintenance & Repair (72 | 5.4%), and Construction & Extraction (22 | 1.7%).
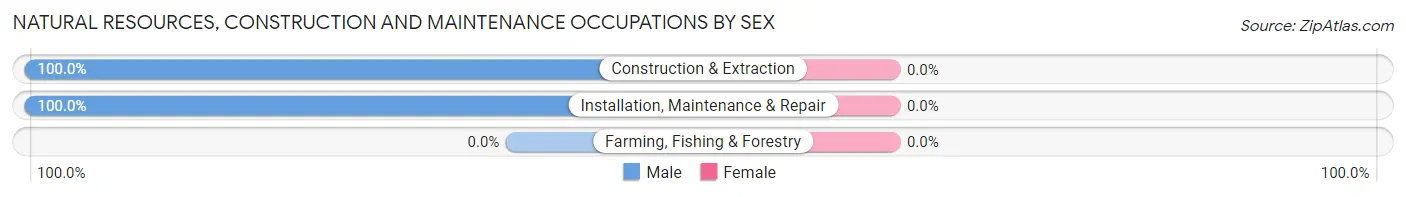
Natural Resources, Construction and Maintenance Occupations by Sex
| Occupation | Male | Female |
| Farming, Fishing & Forestry | 0 (0.0%) | 0 (0.0%) |
| Construction & Extraction | 22 (100.0%) | 0 (0.0%) |
| Installation, Maintenance & Repair | 72 (100.0%) | 0 (0.0%) |
| Total (Category) | 94 (100.0%) | 0 (0.0%) |
| Total (Overall) | 752 (57.0%) | 568 (43.0%) |
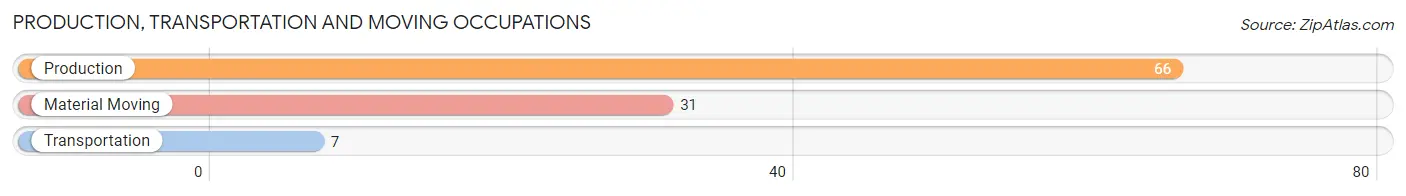
Production, Transportation and Moving Occupations
The most common Production, Transportation and Moving occupations in Fords Prairie are Production (66 | 5.0%), Material Moving (31 | 2.4%), and Transportation (7 | 0.5%).
Production, Transportation and Moving Occupations by Sex
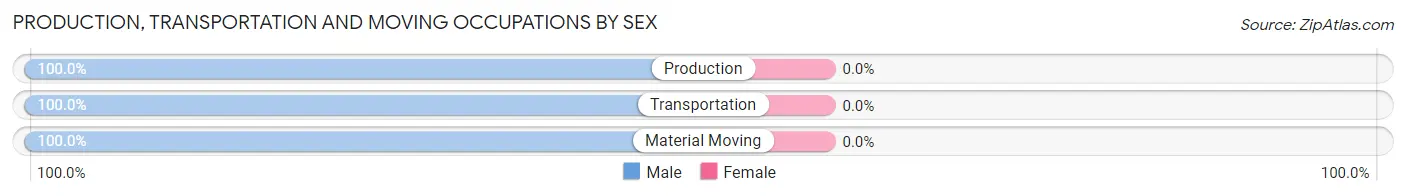
| Occupation | Male | Female |
| Production | 66 (100.0%) | 0 (0.0%) |
| Transportation | 7 (100.0%) | 0 (0.0%) |
| Material Moving | 31 (100.0%) | 0 (0.0%) |
| Total (Category) | 104 (100.0%) | 0 (0.0%) |
| Total (Overall) | 752 (57.0%) | 568 (43.0%) |
Employment Industries by Sex in Fords Prairie
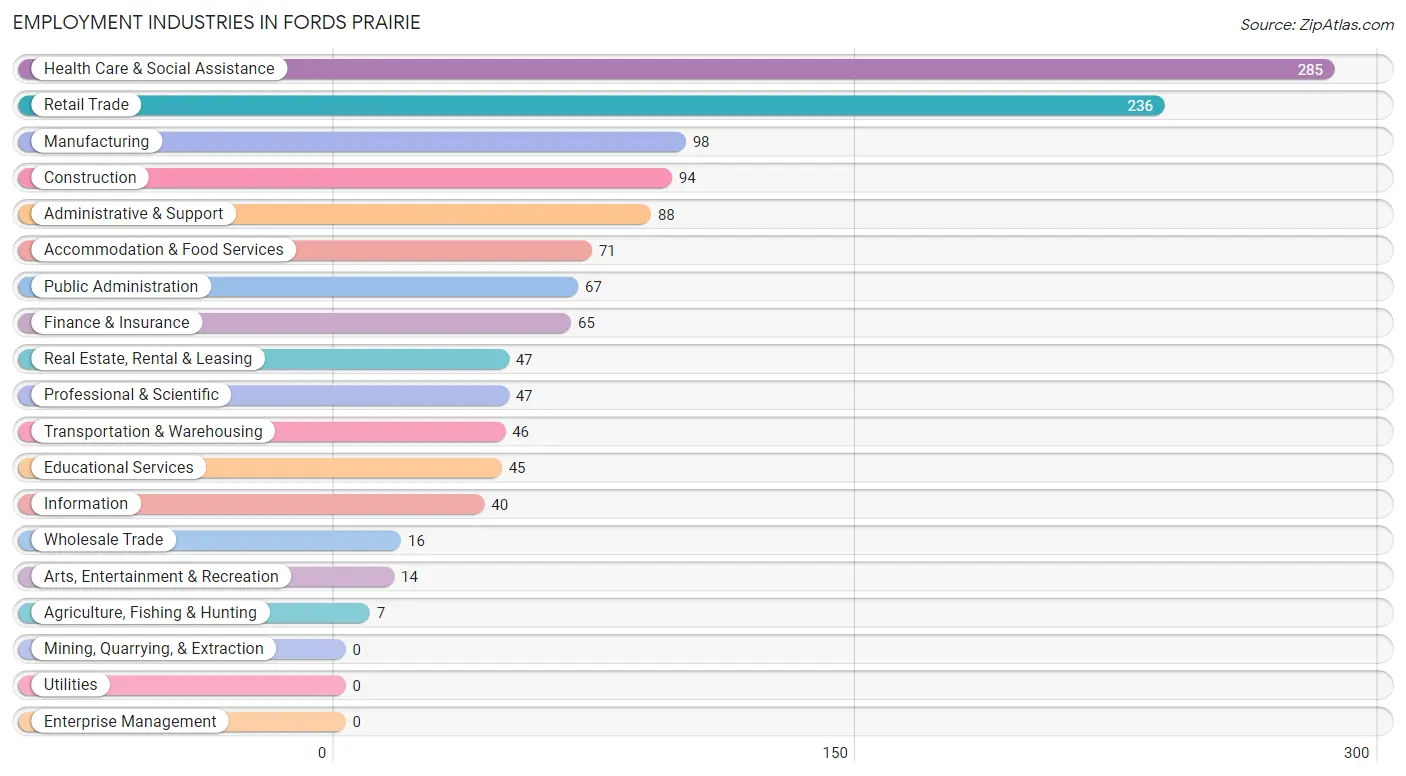
Employment Industries in Fords Prairie
The major employment industries in Fords Prairie include Health Care & Social Assistance (285 | 21.6%), Retail Trade (236 | 17.9%), Manufacturing (98 | 7.4%), Construction (94 | 7.1%), and Administrative & Support (88 | 6.7%).
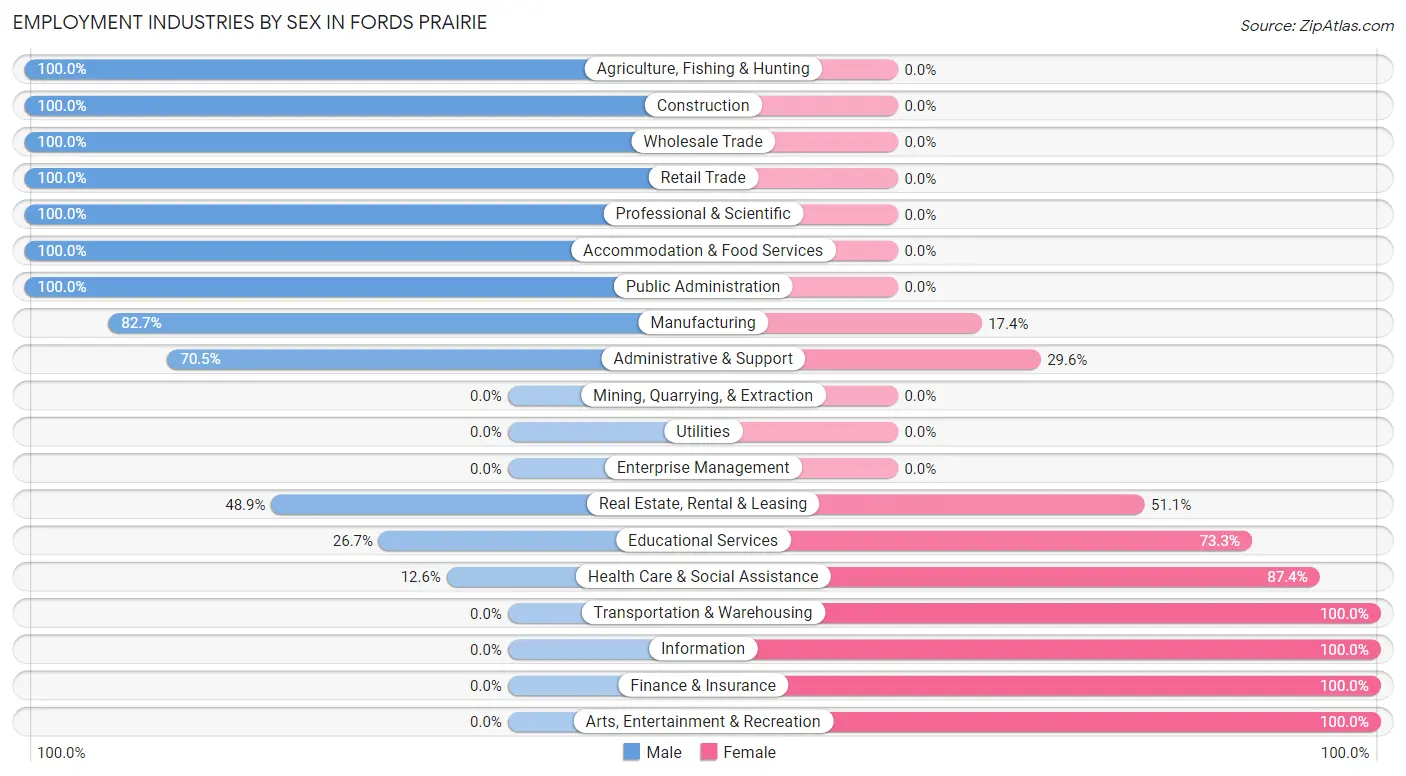
Employment Industries by Sex in Fords Prairie
The Fords Prairie industries that see more men than women are Agriculture, Fishing & Hunting (100.0%), Construction (100.0%), and Wholesale Trade (100.0%), whereas the industries that tend to have a higher number of women are Transportation & Warehousing (100.0%), Information (100.0%), and Finance & Insurance (100.0%).
| Industry | Male | Female |
| Agriculture, Fishing & Hunting | 7 (100.0%) | 0 (0.0%) |
| Mining, Quarrying, & Extraction | 0 (0.0%) | 0 (0.0%) |
| Construction | 94 (100.0%) | 0 (0.0%) |
| Manufacturing | 81 (82.7%) | 17 (17.3%) |
| Wholesale Trade | 16 (100.0%) | 0 (0.0%) |
| Retail Trade | 236 (100.0%) | 0 (0.0%) |
| Transportation & Warehousing | 0 (0.0%) | 46 (100.0%) |
| Utilities | 0 (0.0%) | 0 (0.0%) |
| Information | 0 (0.0%) | 40 (100.0%) |
| Finance & Insurance | 0 (0.0%) | 65 (100.0%) |
| Real Estate, Rental & Leasing | 23 (48.9%) | 24 (51.1%) |
| Professional & Scientific | 47 (100.0%) | 0 (0.0%) |
| Enterprise Management | 0 (0.0%) | 0 (0.0%) |
| Administrative & Support | 62 (70.5%) | 26 (29.5%) |
| Educational Services | 12 (26.7%) | 33 (73.3%) |
| Health Care & Social Assistance | 36 (12.6%) | 249 (87.4%) |
| Arts, Entertainment & Recreation | 0 (0.0%) | 14 (100.0%) |
| Accommodation & Food Services | 71 (100.0%) | 0 (0.0%) |
| Public Administration | 67 (100.0%) | 0 (0.0%) |
| Total | 752 (57.0%) | 568 (43.0%) |
Education in Fords Prairie
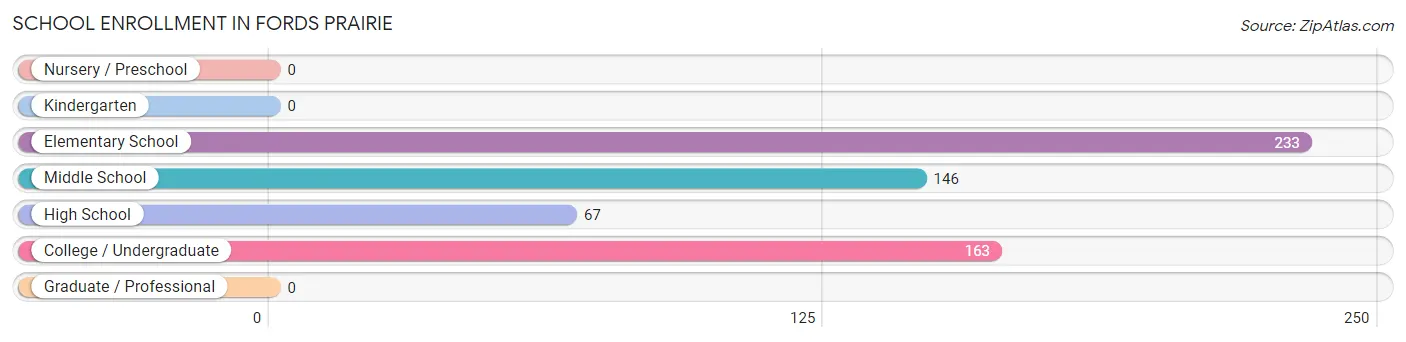
School Enrollment in Fords Prairie
The most common levels of schooling among the 609 students in Fords Prairie are elementary school (233 | 38.3%), college / undergraduate (163 | 26.8%), and middle school (146 | 24.0%).
| School Level | # Students | % Students |
| Nursery / Preschool | 0 | 0.0% |
| Kindergarten | 0 | 0.0% |
| Elementary School | 233 | 38.3% |
| Middle School | 146 | 24.0% |
| High School | 67 | 11.0% |
| College / Undergraduate | 163 | 26.8% |
| Graduate / Professional | 0 | 0.0% |
| Total | 609 | 100.0% |
School Enrollment by Age by Funding Source in Fords Prairie
Out of a total of 609 students who are enrolled in schools in Fords Prairie, 39 (6.4%) attend a private institution, while the remaining 570 (93.6%) are enrolled in public schools. The age group of 18 to 19 year olds has the highest likelihood of being enrolled in private schools, with 28 (100.0% in the age bracket) enrolled. Conversely, the age group of 5 to 9 year old has the lowest likelihood of being enrolled in a private school, with 223 (100.0% in the age bracket) attending a public institution.
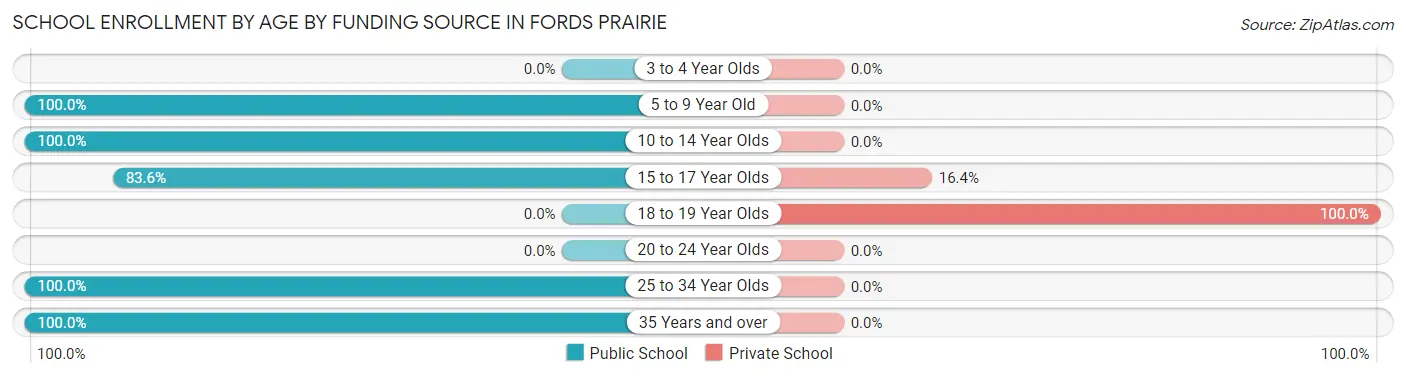
| Age Bracket | Public School | Private School |
| 3 to 4 Year Olds | 0 (0.0%) | 0 (0.0%) |
| 5 to 9 Year Old | 223 (100.0%) | 0 (0.0%) |
| 10 to 14 Year Olds | 156 (100.0%) | 0 (0.0%) |
| 15 to 17 Year Olds | 56 (83.6%) | 11 (16.4%) |
| 18 to 19 Year Olds | 0 (0.0%) | 28 (100.0%) |
| 20 to 24 Year Olds | 0 (0.0%) | 0 (0.0%) |
| 25 to 34 Year Olds | 120 (100.0%) | 0 (0.0%) |
| 35 Years and over | 15 (100.0%) | 0 (0.0%) |
| Total | 570 (93.6%) | 39 (6.4%) |
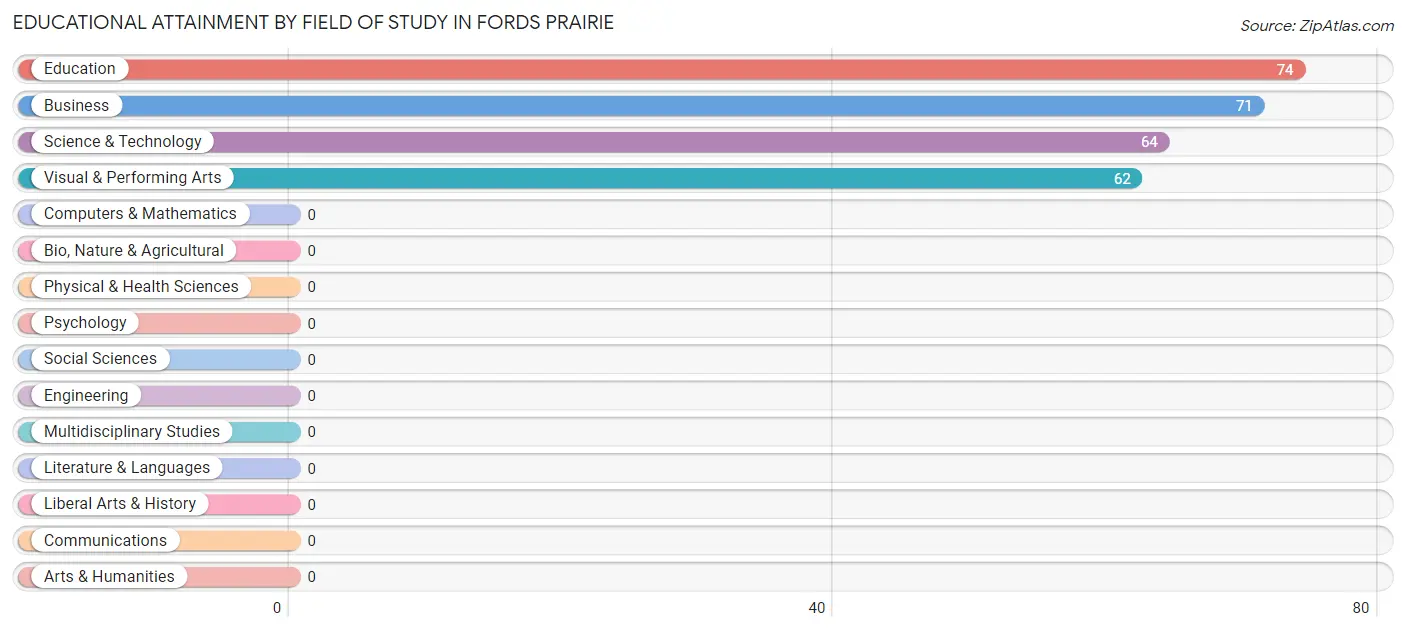
Educational Attainment by Field of Study in Fords Prairie
Education (74 | 27.3%), business (71 | 26.2%), science & technology (64 | 23.6%), and visual & performing arts (62 | 22.9%) are the most common fields of study among 271 individuals in Fords Prairie who have obtained a bachelor's degree or higher.
| Field of Study | # Graduates | % Graduates |
| Computers & Mathematics | 0 | 0.0% |
| Bio, Nature & Agricultural | 0 | 0.0% |
| Physical & Health Sciences | 0 | 0.0% |
| Psychology | 0 | 0.0% |
| Social Sciences | 0 | 0.0% |
| Engineering | 0 | 0.0% |
| Multidisciplinary Studies | 0 | 0.0% |
| Science & Technology | 64 | 23.6% |
| Business | 71 | 26.2% |
| Education | 74 | 27.3% |
| Literature & Languages | 0 | 0.0% |
| Liberal Arts & History | 0 | 0.0% |
| Visual & Performing Arts | 62 | 22.9% |
| Communications | 0 | 0.0% |
| Arts & Humanities | 0 | 0.0% |
| Total | 271 | 100.0% |
Transportation & Commute in Fords Prairie
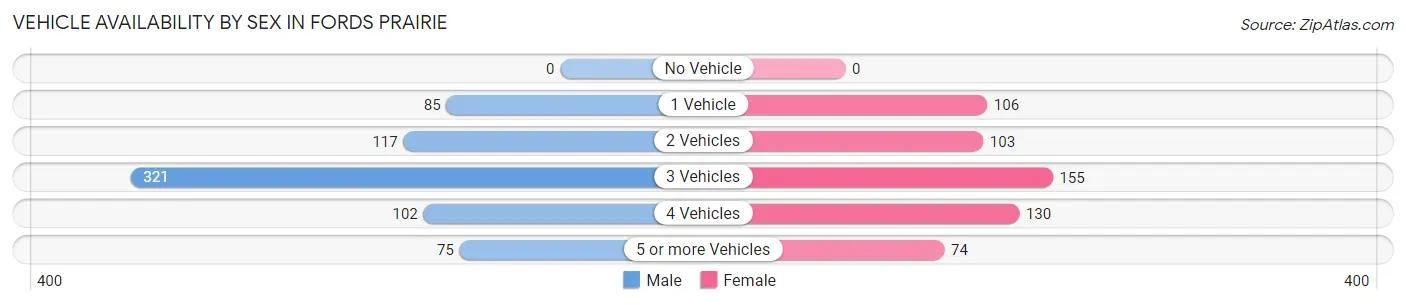
Vehicle Availability by Sex in Fords Prairie
The most prevalent vehicle ownership categories in Fords Prairie are males with 3 vehicles (321, accounting for 45.9%) and females with 3 vehicles (155, making up 56.5%).
| Vehicles Available | Male | Female |
| No Vehicle | 0 (0.0%) | 0 (0.0%) |
| 1 Vehicle | 85 (12.1%) | 106 (18.7%) |
| 2 Vehicles | 117 (16.7%) | 103 (18.1%) |
| 3 Vehicles | 321 (45.9%) | 155 (27.3%) |
| 4 Vehicles | 102 (14.6%) | 130 (22.9%) |
| 5 or more Vehicles | 75 (10.7%) | 74 (13.0%) |
| Total | 700 (100.0%) | 568 (100.0%) |
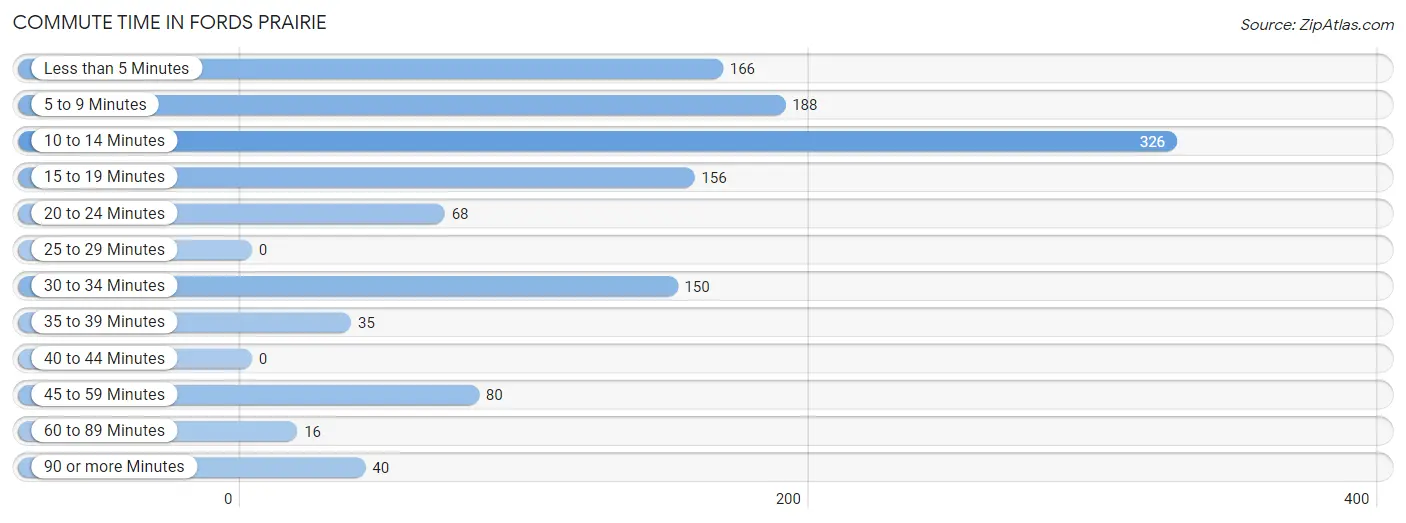
Commute Time in Fords Prairie
The most frequently occuring commute durations in Fords Prairie are 10 to 14 minutes (326 commuters, 26.6%), 5 to 9 minutes (188 commuters, 15.3%), and less than 5 minutes (166 commuters, 13.6%).
| Commute Time | # Commuters | % Commuters |
| Less than 5 Minutes | 166 | 13.6% |
| 5 to 9 Minutes | 188 | 15.3% |
| 10 to 14 Minutes | 326 | 26.6% |
| 15 to 19 Minutes | 156 | 12.7% |
| 20 to 24 Minutes | 68 | 5.6% |
| 25 to 29 Minutes | 0 | 0.0% |
| 30 to 34 Minutes | 150 | 12.2% |
| 35 to 39 Minutes | 35 | 2.9% |
| 40 to 44 Minutes | 0 | 0.0% |
| 45 to 59 Minutes | 80 | 6.5% |
| 60 to 89 Minutes | 16 | 1.3% |
| 90 or more Minutes | 40 | 3.3% |
Commute Time by Sex in Fords Prairie
The most common commute times in Fords Prairie are 10 to 14 minutes (186 commuters, 27.2%) for males and 5 to 9 minutes (144 commuters, 26.7%) for females.
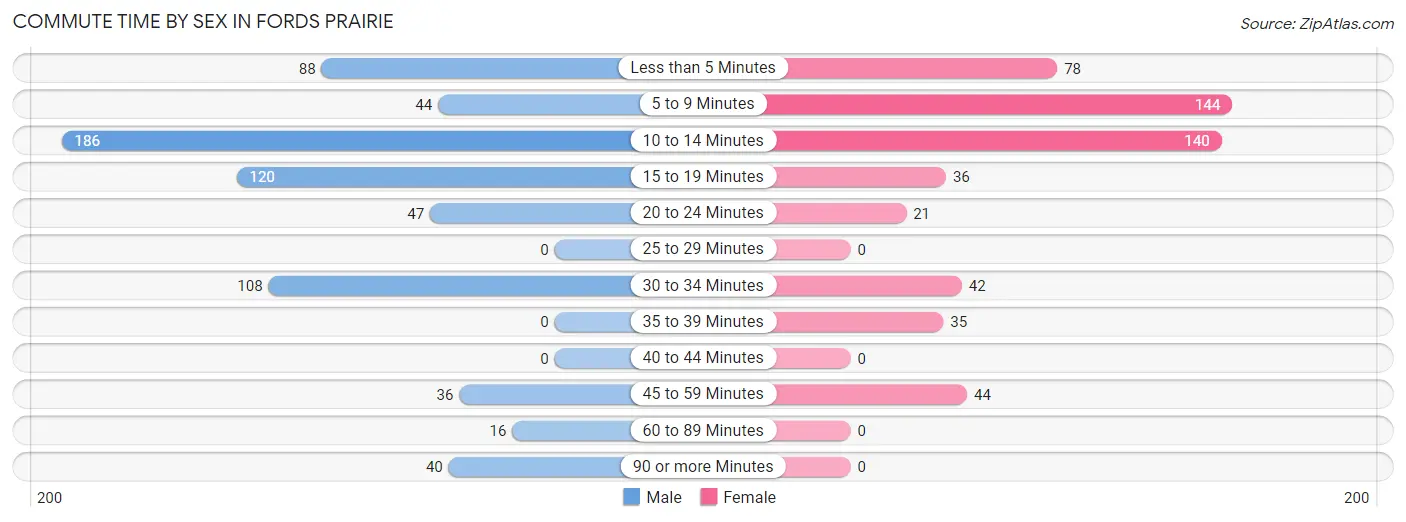
| Commute Time | Male | Female |
| Less than 5 Minutes | 88 (12.9%) | 78 (14.4%) |
| 5 to 9 Minutes | 44 (6.4%) | 144 (26.7%) |
| 10 to 14 Minutes | 186 (27.2%) | 140 (25.9%) |
| 15 to 19 Minutes | 120 (17.5%) | 36 (6.7%) |
| 20 to 24 Minutes | 47 (6.9%) | 21 (3.9%) |
| 25 to 29 Minutes | 0 (0.0%) | 0 (0.0%) |
| 30 to 34 Minutes | 108 (15.8%) | 42 (7.8%) |
| 35 to 39 Minutes | 0 (0.0%) | 35 (6.5%) |
| 40 to 44 Minutes | 0 (0.0%) | 0 (0.0%) |
| 45 to 59 Minutes | 36 (5.3%) | 44 (8.2%) |
| 60 to 89 Minutes | 16 (2.3%) | 0 (0.0%) |
| 90 or more Minutes | 40 (5.8%) | 0 (0.0%) |
Time of Departure to Work by Sex in Fords Prairie
The most frequent times of departure to work in Fords Prairie are 7:30 AM to 7:59 AM (165, 24.1%) for males and 7:00 AM to 7:29 AM (91, 16.9%) for females.
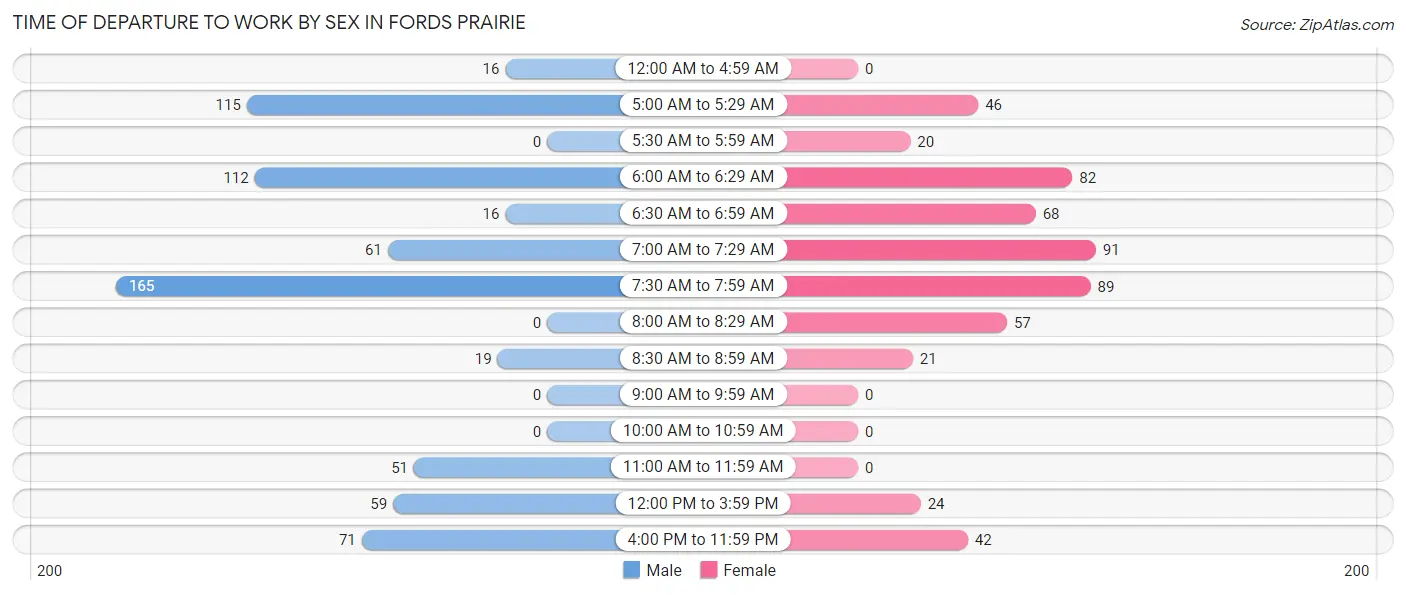
| Time of Departure | Male | Female |
| 12:00 AM to 4:59 AM | 16 (2.3%) | 0 (0.0%) |
| 5:00 AM to 5:29 AM | 115 (16.8%) | 46 (8.5%) |
| 5:30 AM to 5:59 AM | 0 (0.0%) | 20 (3.7%) |
| 6:00 AM to 6:29 AM | 112 (16.4%) | 82 (15.2%) |
| 6:30 AM to 6:59 AM | 16 (2.3%) | 68 (12.6%) |
| 7:00 AM to 7:29 AM | 61 (8.9%) | 91 (16.9%) |
| 7:30 AM to 7:59 AM | 165 (24.1%) | 89 (16.5%) |
| 8:00 AM to 8:29 AM | 0 (0.0%) | 57 (10.6%) |
| 8:30 AM to 8:59 AM | 19 (2.8%) | 21 (3.9%) |
| 9:00 AM to 9:59 AM | 0 (0.0%) | 0 (0.0%) |
| 10:00 AM to 10:59 AM | 0 (0.0%) | 0 (0.0%) |
| 11:00 AM to 11:59 AM | 51 (7.4%) | 0 (0.0%) |
| 12:00 PM to 3:59 PM | 59 (8.6%) | 24 (4.4%) |
| 4:00 PM to 11:59 PM | 71 (10.4%) | 42 (7.8%) |
| Total | 685 (100.0%) | 540 (100.0%) |
Housing Occupancy in Fords Prairie
Occupancy by Ownership in Fords Prairie
Of the total 1,095 dwellings in Fords Prairie, owner-occupied units account for 819 (74.8%), while renter-occupied units make up 276 (25.2%).
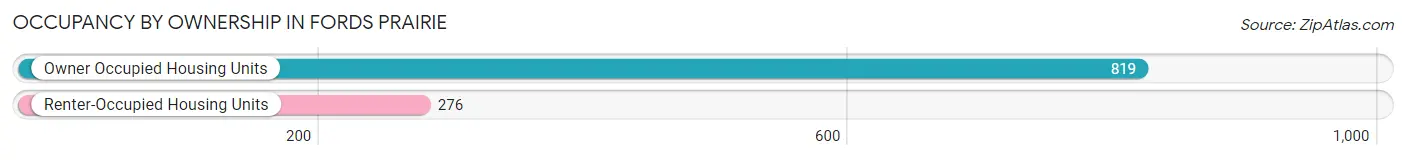
| Occupancy | # Housing Units | % Housing Units |
| Owner Occupied Housing Units | 819 | 74.8% |
| Renter-Occupied Housing Units | 276 | 25.2% |
| Total Occupied Housing Units | 1,095 | 100.0% |
Occupancy by Household Size in Fords Prairie
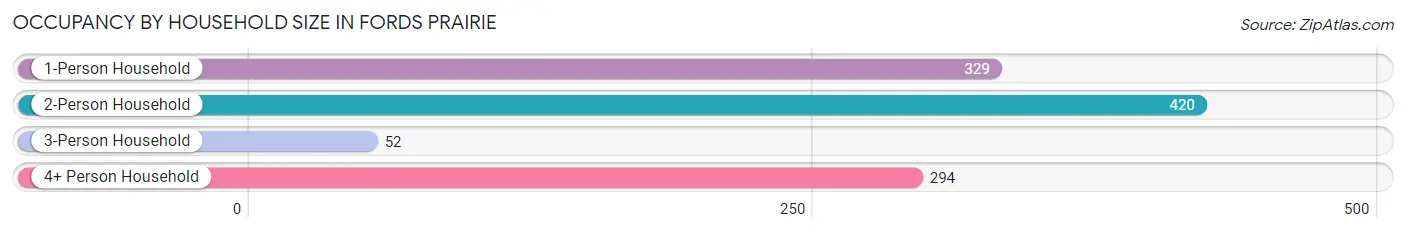
| Household Size | # Housing Units | % Housing Units |
| 1-Person Household | 329 | 30.0% |
| 2-Person Household | 420 | 38.4% |
| 3-Person Household | 52 | 4.8% |
| 4+ Person Household | 294 | 26.9% |
| Total Housing Units | 1,095 | 100.0% |
Occupancy by Ownership by Household Size in Fords Prairie
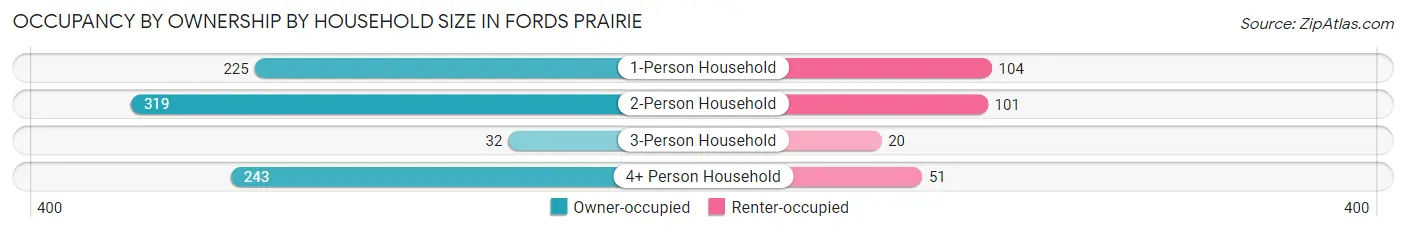
| Household Size | Owner-occupied | Renter-occupied |
| 1-Person Household | 225 (68.4%) | 104 (31.6%) |
| 2-Person Household | 319 (75.9%) | 101 (24.0%) |
| 3-Person Household | 32 (61.5%) | 20 (38.5%) |
| 4+ Person Household | 243 (82.7%) | 51 (17.3%) |
| Total Housing Units | 819 (74.8%) | 276 (25.2%) |
Occupancy by Educational Attainment in Fords Prairie
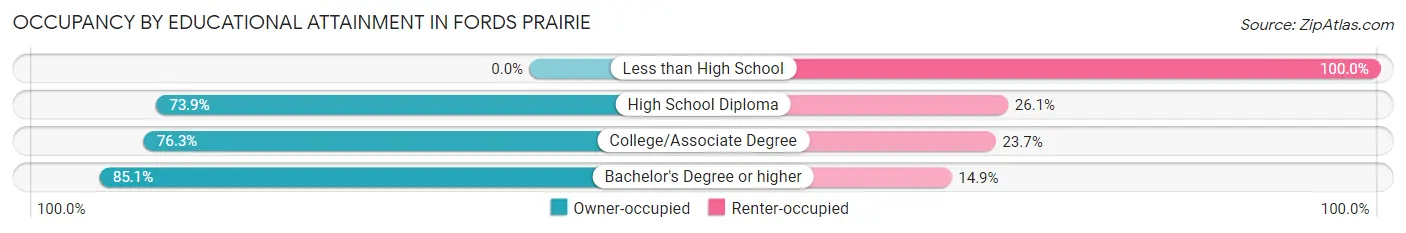
| Household Size | Owner-occupied | Renter-occupied |
| Less than High School | 0 (0.0%) | 23 (100.0%) |
| High School Diploma | 280 (73.9%) | 99 (26.1%) |
| College/Associate Degree | 442 (76.3%) | 137 (23.7%) |
| Bachelor's Degree or higher | 97 (85.1%) | 17 (14.9%) |
Occupancy by Age of Householder in Fords Prairie
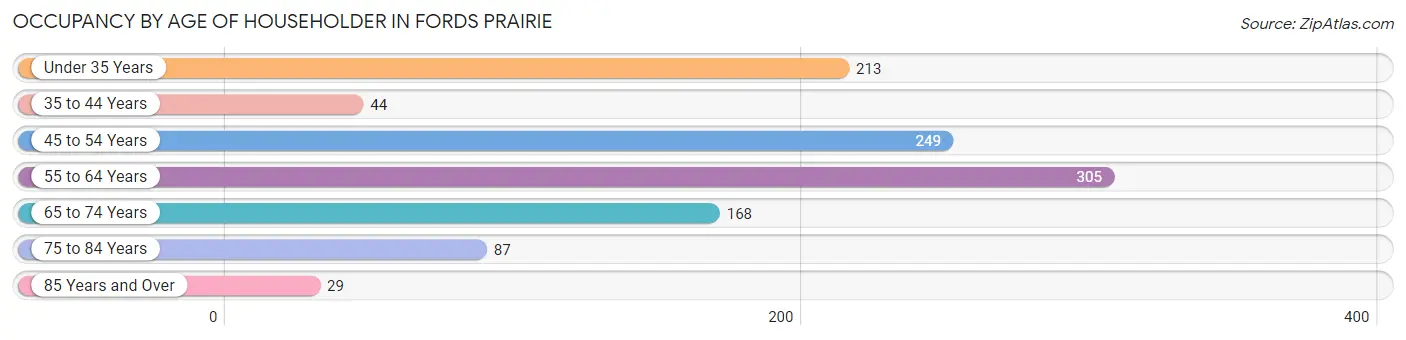
| Age Bracket | # Households | % Households |
| Under 35 Years | 213 | 19.5% |
| 35 to 44 Years | 44 | 4.0% |
| 45 to 54 Years | 249 | 22.7% |
| 55 to 64 Years | 305 | 27.9% |
| 65 to 74 Years | 168 | 15.3% |
| 75 to 84 Years | 87 | 8.0% |
| 85 Years and Over | 29 | 2.6% |
| Total | 1,095 | 100.0% |
Housing Finances in Fords Prairie
Median Income by Occupancy in Fords Prairie
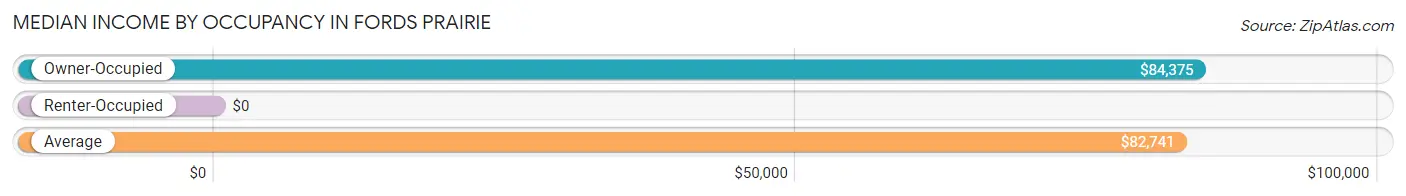
| Occupancy Type | # Households | Median Income |
| Owner-Occupied | 819 (74.8%) | $84,375 |
| Renter-Occupied | 276 (25.2%) | $0 |
| Average | 1,095 (100.0%) | $82,741 |
Occupancy by Householder Income Bracket in Fords Prairie
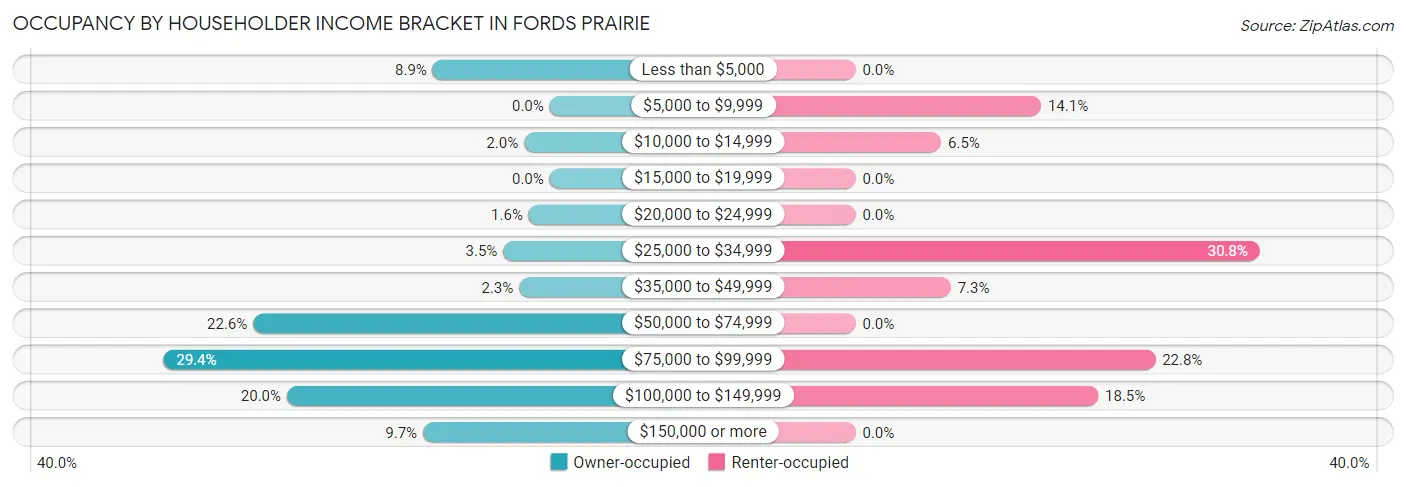
| Income Bracket | Owner-occupied | Renter-occupied |
| Less than $5,000 | 73 (8.9%) | 0 (0.0%) |
| $5,000 to $9,999 | 0 (0.0%) | 39 (14.1%) |
| $10,000 to $14,999 | 16 (1.9%) | 18 (6.5%) |
| $15,000 to $19,999 | 0 (0.0%) | 0 (0.0%) |
| $20,000 to $24,999 | 13 (1.6%) | 0 (0.0%) |
| $25,000 to $34,999 | 29 (3.5%) | 85 (30.8%) |
| $35,000 to $49,999 | 19 (2.3%) | 20 (7.2%) |
| $50,000 to $74,999 | 185 (22.6%) | 0 (0.0%) |
| $75,000 to $99,999 | 241 (29.4%) | 63 (22.8%) |
| $100,000 to $149,999 | 164 (20.0%) | 51 (18.5%) |
| $150,000 or more | 79 (9.7%) | 0 (0.0%) |
| Total | 819 (100.0%) | 276 (100.0%) |
Monthly Housing Cost Tiers in Fords Prairie
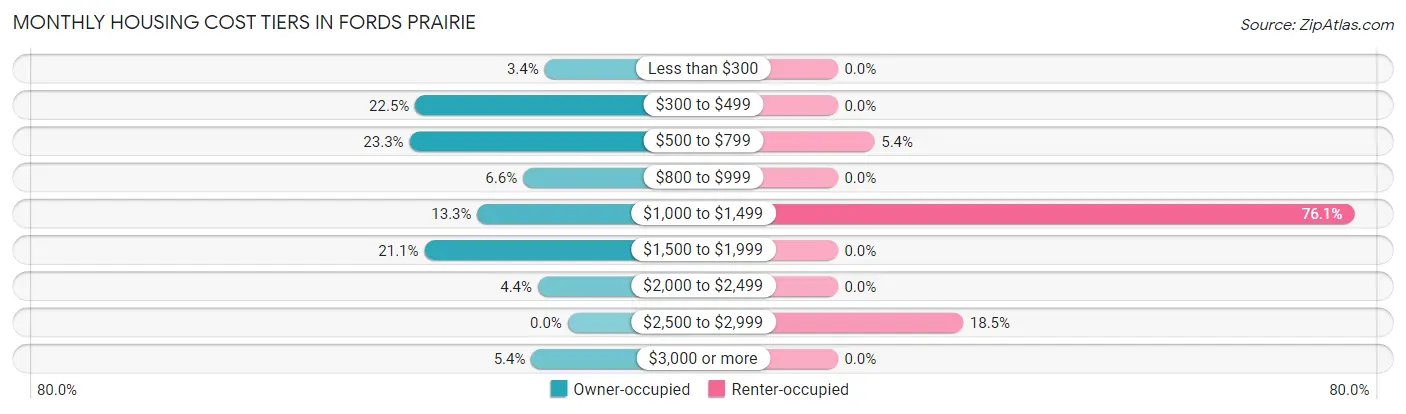
| Monthly Cost | Owner-occupied | Renter-occupied |
| Less than $300 | 28 (3.4%) | 0 (0.0%) |
| $300 to $499 | 184 (22.5%) | 0 (0.0%) |
| $500 to $799 | 191 (23.3%) | 15 (5.4%) |
| $800 to $999 | 54 (6.6%) | 0 (0.0%) |
| $1,000 to $1,499 | 109 (13.3%) | 210 (76.1%) |
| $1,500 to $1,999 | 173 (21.1%) | 0 (0.0%) |
| $2,000 to $2,499 | 36 (4.4%) | 0 (0.0%) |
| $2,500 to $2,999 | 0 (0.0%) | 51 (18.5%) |
| $3,000 or more | 44 (5.4%) | 0 (0.0%) |
| Total | 819 (100.0%) | 276 (100.0%) |
Physical Housing Characteristics in Fords Prairie
Housing Structures in Fords Prairie
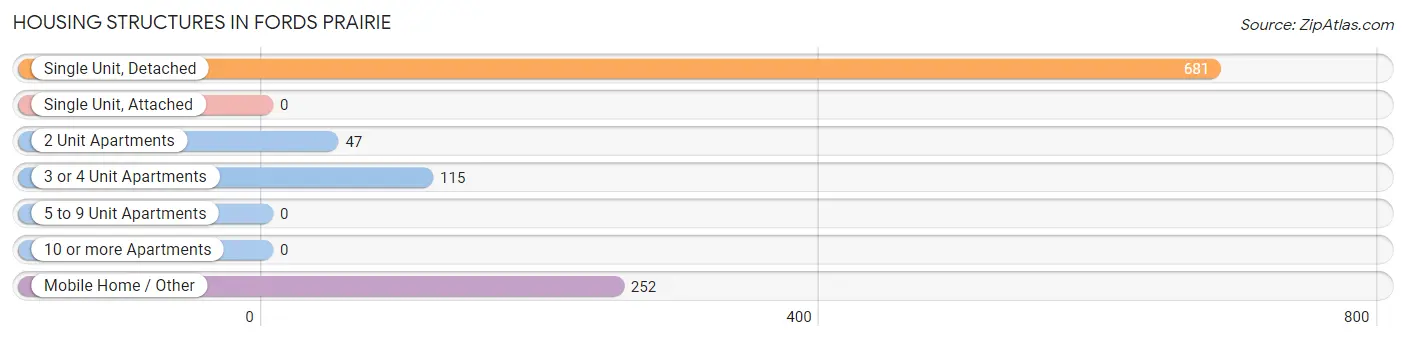
| Structure Type | # Housing Units | % Housing Units |
| Single Unit, Detached | 681 | 62.2% |
| Single Unit, Attached | 0 | 0.0% |
| 2 Unit Apartments | 47 | 4.3% |
| 3 or 4 Unit Apartments | 115 | 10.5% |
| 5 to 9 Unit Apartments | 0 | 0.0% |
| 10 or more Apartments | 0 | 0.0% |
| Mobile Home / Other | 252 | 23.0% |
| Total | 1,095 | 100.0% |
Housing Structures by Occupancy in Fords Prairie
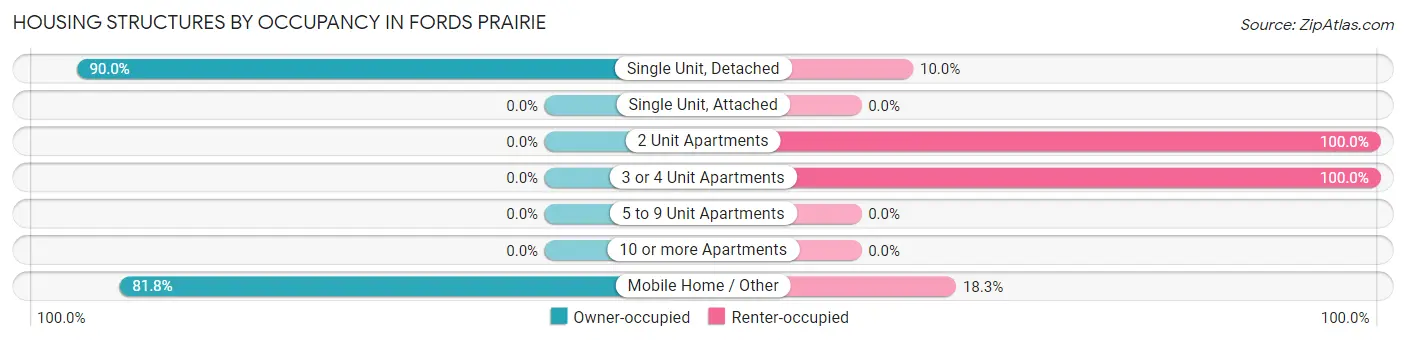
| Structure Type | Owner-occupied | Renter-occupied |
| Single Unit, Detached | 613 (90.0%) | 68 (10.0%) |
| Single Unit, Attached | 0 (0.0%) | 0 (0.0%) |
| 2 Unit Apartments | 0 (0.0%) | 47 (100.0%) |
| 3 or 4 Unit Apartments | 0 (0.0%) | 115 (100.0%) |
| 5 to 9 Unit Apartments | 0 (0.0%) | 0 (0.0%) |
| 10 or more Apartments | 0 (0.0%) | 0 (0.0%) |
| Mobile Home / Other | 206 (81.8%) | 46 (18.2%) |
| Total | 819 (74.8%) | 276 (25.2%) |
Housing Structures by Number of Rooms in Fords Prairie
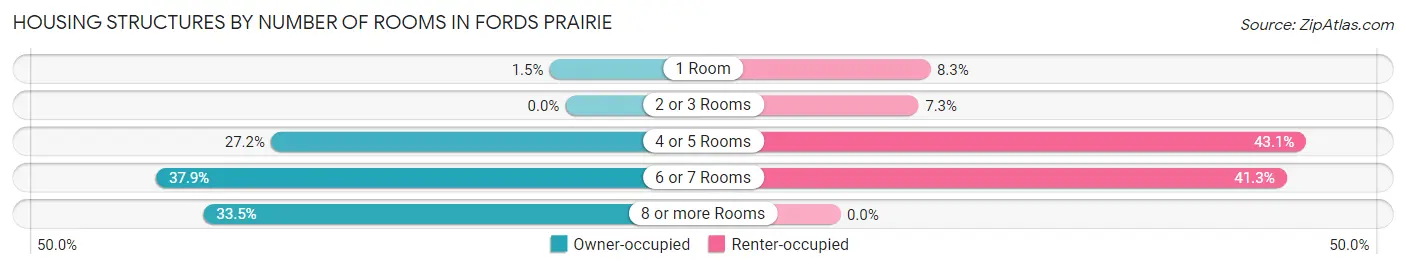
| Number of Rooms | Owner-occupied | Renter-occupied |
| 1 Room | 12 (1.5%) | 23 (8.3%) |
| 2 or 3 Rooms | 0 (0.0%) | 20 (7.2%) |
| 4 or 5 Rooms | 223 (27.2%) | 119 (43.1%) |
| 6 or 7 Rooms | 310 (37.9%) | 114 (41.3%) |
| 8 or more Rooms | 274 (33.5%) | 0 (0.0%) |
| Total | 819 (100.0%) | 276 (100.0%) |
Housing Structure by Heating Type in Fords Prairie
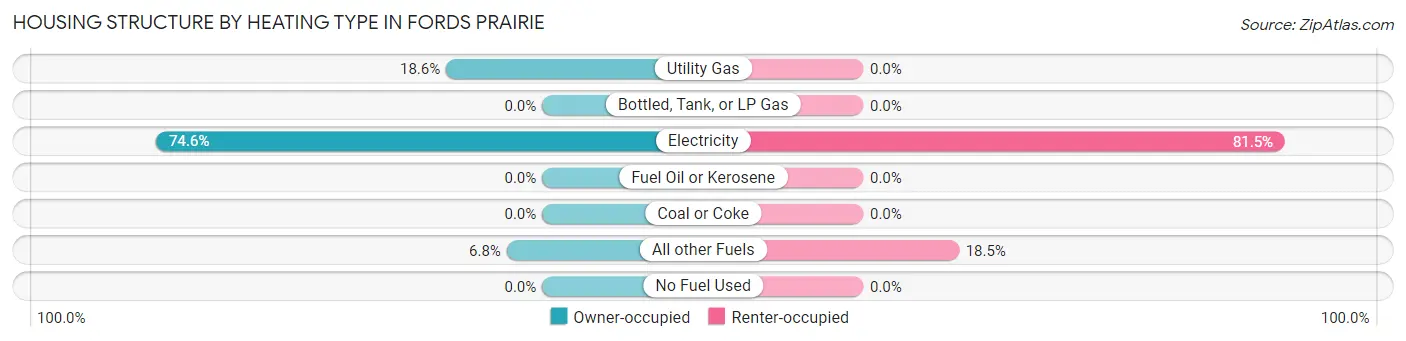
| Heating Type | Owner-occupied | Renter-occupied |
| Utility Gas | 152 (18.6%) | 0 (0.0%) |
| Bottled, Tank, or LP Gas | 0 (0.0%) | 0 (0.0%) |
| Electricity | 611 (74.6%) | 225 (81.5%) |
| Fuel Oil or Kerosene | 0 (0.0%) | 0 (0.0%) |
| Coal or Coke | 0 (0.0%) | 0 (0.0%) |
| All other Fuels | 56 (6.8%) | 51 (18.5%) |
| No Fuel Used | 0 (0.0%) | 0 (0.0%) |
| Total | 819 (100.0%) | 276 (100.0%) |
Household Vehicle Usage in Fords Prairie
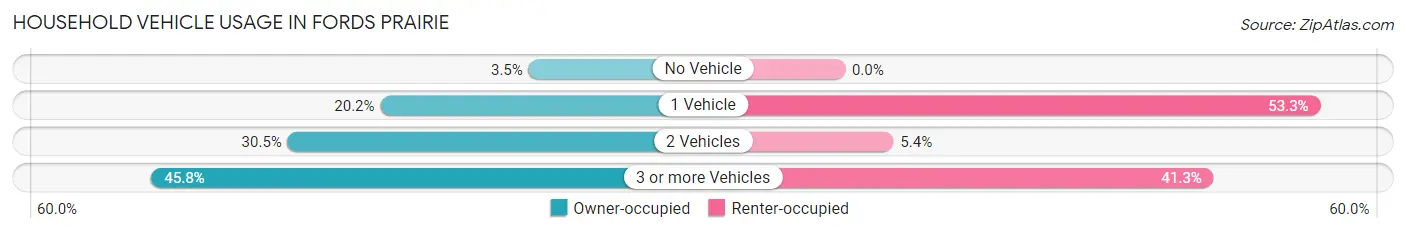
| Vehicles per Household | Owner-occupied | Renter-occupied |
| No Vehicle | 29 (3.5%) | 0 (0.0%) |
| 1 Vehicle | 165 (20.2%) | 147 (53.3%) |
| 2 Vehicles | 250 (30.5%) | 15 (5.4%) |
| 3 or more Vehicles | 375 (45.8%) | 114 (41.3%) |
| Total | 819 (100.0%) | 276 (100.0%) |
Real Estate & Mortgages in Fords Prairie
Real Estate and Mortgage Overview in Fords Prairie
| Characteristic | Without Mortgage | With Mortgage |
| Housing Units | 420 | 399 |
| Median Property Value | $280,400 | $245,500 |
| Median Household Income | $51,606 | $79 |
| Monthly Housing Costs | $498 | $44 |
| Real Estate Taxes | $3,065 | $0 |
Property Value by Mortgage Status in Fords Prairie
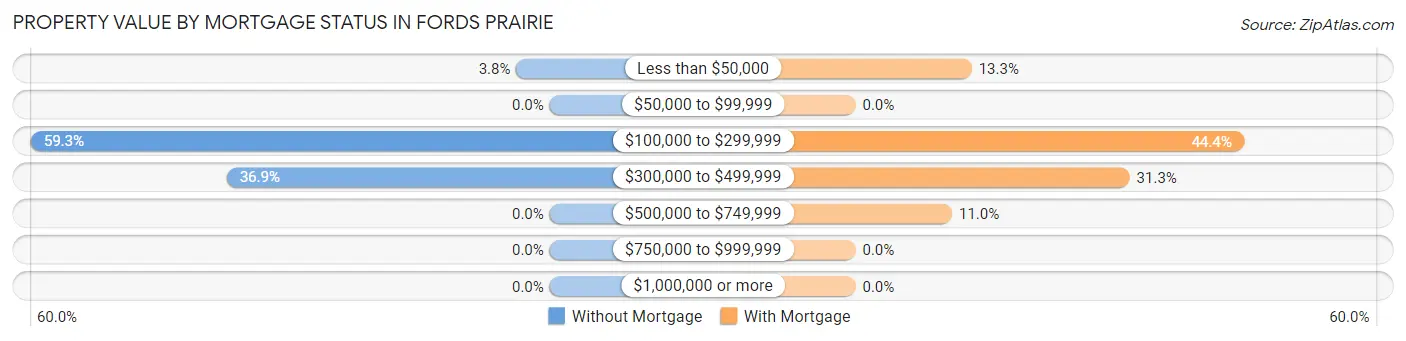
| Property Value | Without Mortgage | With Mortgage |
| Less than $50,000 | 16 (3.8%) | 53 (13.3%) |
| $50,000 to $99,999 | 0 (0.0%) | 0 (0.0%) |
| $100,000 to $299,999 | 249 (59.3%) | 177 (44.4%) |
| $300,000 to $499,999 | 155 (36.9%) | 125 (31.3%) |
| $500,000 to $749,999 | 0 (0.0%) | 44 (11.0%) |
| $750,000 to $999,999 | 0 (0.0%) | 0 (0.0%) |
| $1,000,000 or more | 0 (0.0%) | 0 (0.0%) |
| Total | 420 (100.0%) | 399 (100.0%) |
Household Income by Mortgage Status in Fords Prairie
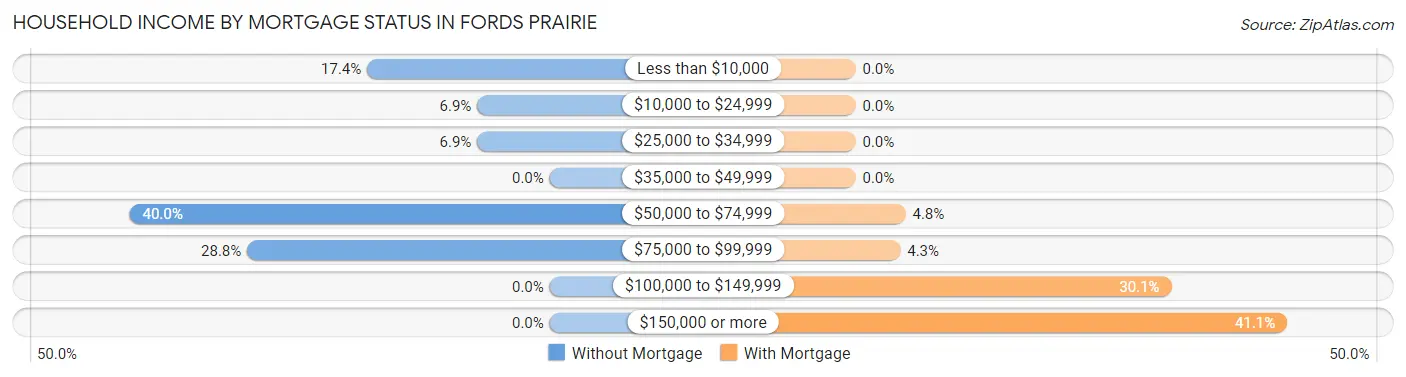
| Household Income | Without Mortgage | With Mortgage |
| Less than $10,000 | 73 (17.4%) | 0 (0.0%) |
| $10,000 to $24,999 | 29 (6.9%) | 0 (0.0%) |
| $25,000 to $34,999 | 29 (6.9%) | 0 (0.0%) |
| $35,000 to $49,999 | 0 (0.0%) | 0 (0.0%) |
| $50,000 to $74,999 | 168 (40.0%) | 19 (4.8%) |
| $75,000 to $99,999 | 121 (28.8%) | 17 (4.3%) |
| $100,000 to $149,999 | 0 (0.0%) | 120 (30.1%) |
| $150,000 or more | 0 (0.0%) | 164 (41.1%) |
| Total | 420 (100.0%) | 399 (100.0%) |
Property Value to Household Income Ratio in Fords Prairie
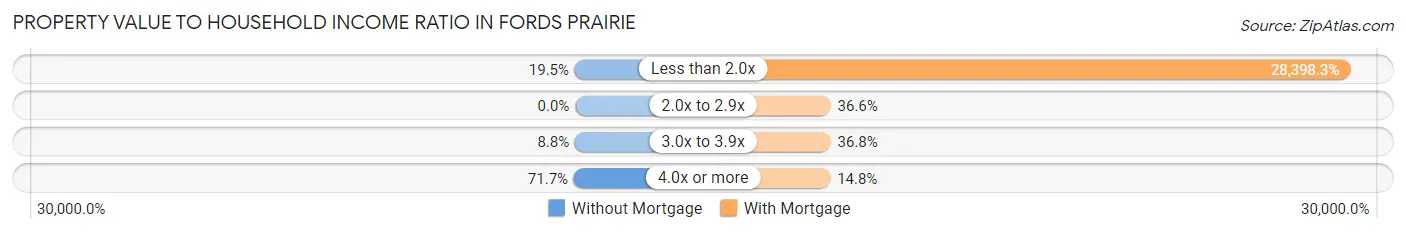
| Value-to-Income Ratio | Without Mortgage | With Mortgage |
| Less than 2.0x | 82 (19.5%) | 113,309 (28,398.3%) |
| 2.0x to 2.9x | 0 (0.0%) | 146 (36.6%) |
| 3.0x to 3.9x | 37 (8.8%) | 147 (36.8%) |
| 4.0x or more | 301 (71.7%) | 59 (14.8%) |
| Total | 420 (100.0%) | 399 (100.0%) |
Real Estate Taxes by Mortgage Status in Fords Prairie
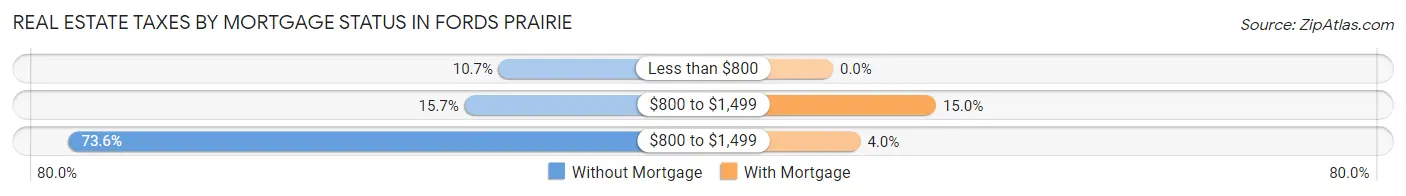
| Property Taxes | Without Mortgage | With Mortgage |
| Less than $800 | 45 (10.7%) | 0 (0.0%) |
| $800 to $1,499 | 66 (15.7%) | 60 (15.0%) |
| $800 to $1,499 | 309 (73.6%) | 16 (4.0%) |
| Total | 420 (100.0%) | 399 (100.0%) |
Health & Disability in Fords Prairie
Health Insurance Coverage by Age in Fords Prairie
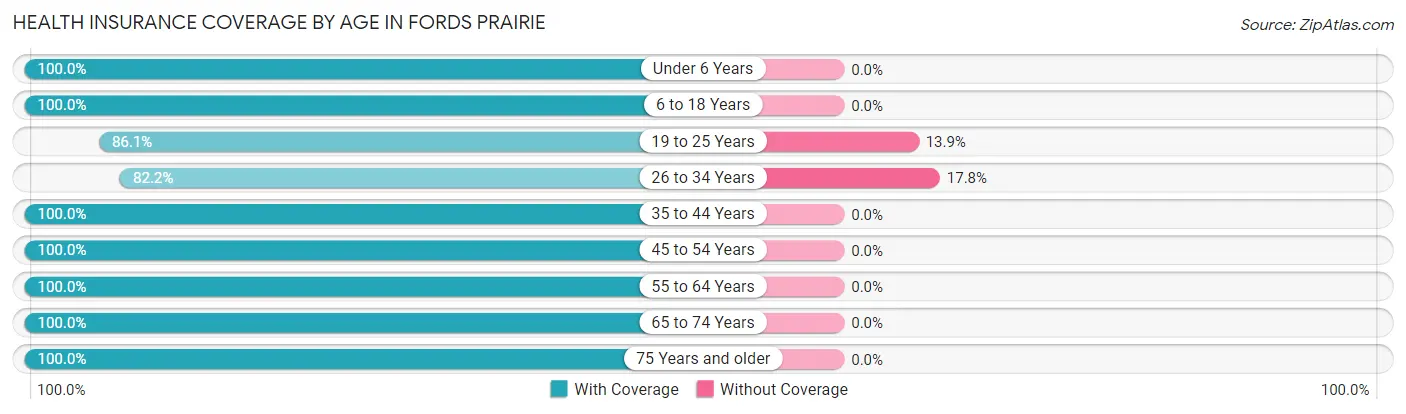
| Age Bracket | With Coverage | Without Coverage |
| Under 6 Years | 119 (100.0%) | 0 (0.0%) |
| 6 to 18 Years | 446 (100.0%) | 0 (0.0%) |
| 19 to 25 Years | 267 (86.1%) | 43 (13.9%) |
| 26 to 34 Years | 286 (82.2%) | 62 (17.8%) |
| 35 to 44 Years | 196 (100.0%) | 0 (0.0%) |
| 45 to 54 Years | 435 (100.0%) | 0 (0.0%) |
| 55 to 64 Years | 589 (100.0%) | 0 (0.0%) |
| 65 to 74 Years | 283 (100.0%) | 0 (0.0%) |
| 75 Years and older | 116 (100.0%) | 0 (0.0%) |
| Total | 2,737 (96.3%) | 105 (3.7%) |
Health Insurance Coverage by Citizenship Status in Fords Prairie
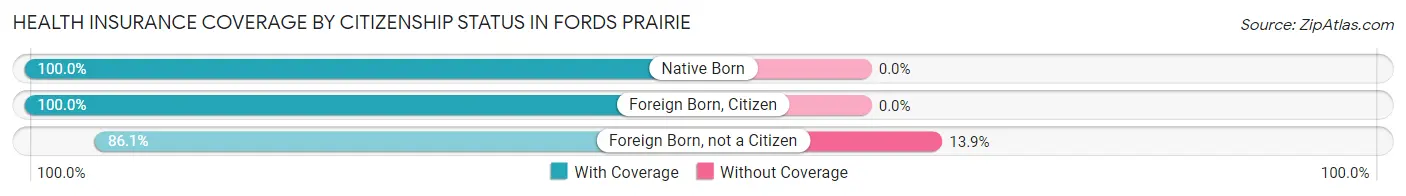
| Citizenship Status | With Coverage | Without Coverage |
| Native Born | 119 (100.0%) | 0 (0.0%) |
| Foreign Born, Citizen | 446 (100.0%) | 0 (0.0%) |
| Foreign Born, not a Citizen | 267 (86.1%) | 43 (13.9%) |
Health Insurance Coverage by Household Income in Fords Prairie
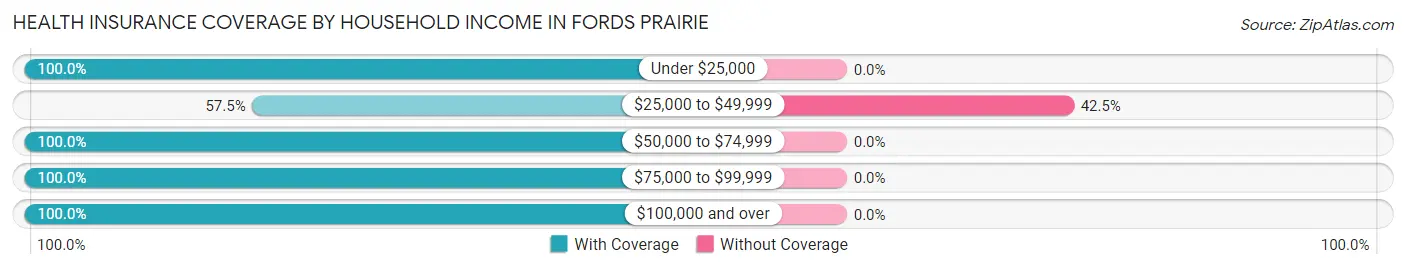
| Household Income | With Coverage | Without Coverage |
| Under $25,000 | 189 (100.0%) | 0 (0.0%) |
| $25,000 to $49,999 | 142 (57.5%) | 105 (42.5%) |
| $50,000 to $74,999 | 391 (100.0%) | 0 (0.0%) |
| $75,000 to $99,999 | 903 (100.0%) | 0 (0.0%) |
| $100,000 and over | 1,112 (100.0%) | 0 (0.0%) |
Public vs Private Health Insurance Coverage by Age in Fords Prairie
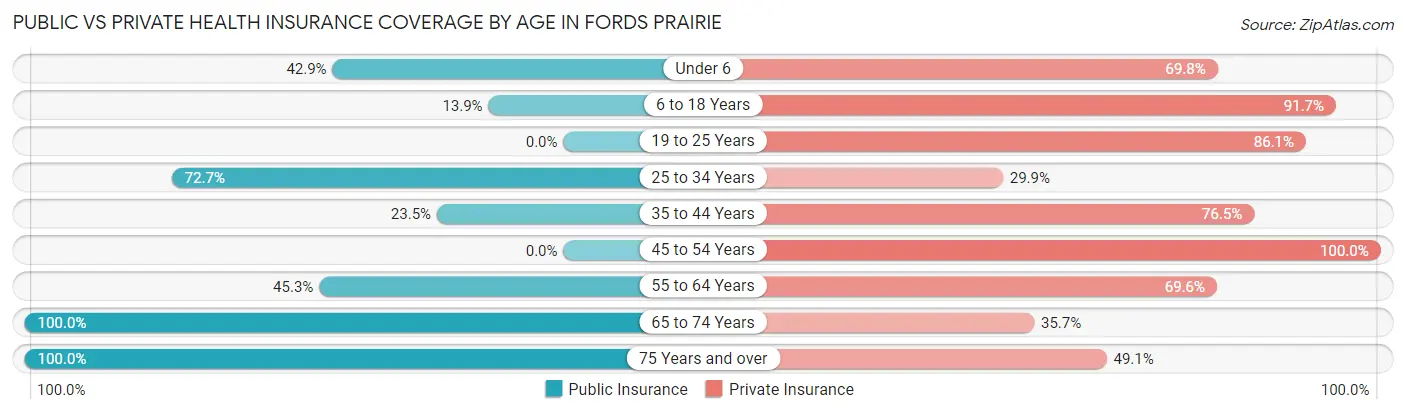
| Age Bracket | Public Insurance | Private Insurance |
| Under 6 | 51 (42.9%) | 83 (69.8%) |
| 6 to 18 Years | 62 (13.9%) | 409 (91.7%) |
| 19 to 25 Years | 0 (0.0%) | 267 (86.1%) |
| 25 to 34 Years | 253 (72.7%) | 104 (29.9%) |
| 35 to 44 Years | 46 (23.5%) | 150 (76.5%) |
| 45 to 54 Years | 0 (0.0%) | 435 (100.0%) |
| 55 to 64 Years | 267 (45.3%) | 410 (69.6%) |
| 65 to 74 Years | 283 (100.0%) | 101 (35.7%) |
| 75 Years and over | 116 (100.0%) | 57 (49.1%) |
| Total | 1,078 (37.9%) | 2,016 (70.9%) |
Disability Status by Sex by Age in Fords Prairie
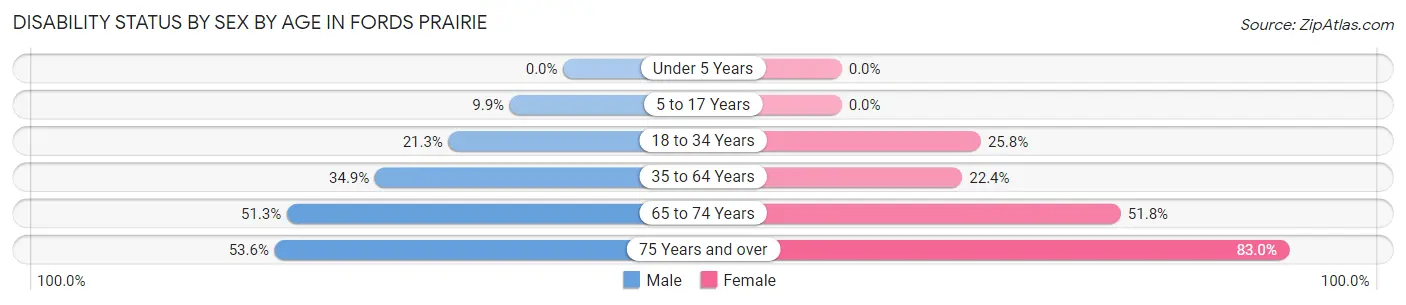
| Age Bracket | Male | Female |
| Under 5 Years | 0 (0.0%) | 0 (0.0%) |
| 5 to 17 Years | 25 (9.9%) | 0 (0.0%) |
| 18 to 34 Years | 70 (21.3%) | 85 (25.8%) |
| 35 to 64 Years | 203 (34.9%) | 143 (22.4%) |
| 65 to 74 Years | 60 (51.3%) | 86 (51.8%) |
| 75 Years and over | 15 (53.6%) | 73 (83.0%) |
Disability Class by Sex by Age in Fords Prairie
Disability Class: Hearing Difficulty
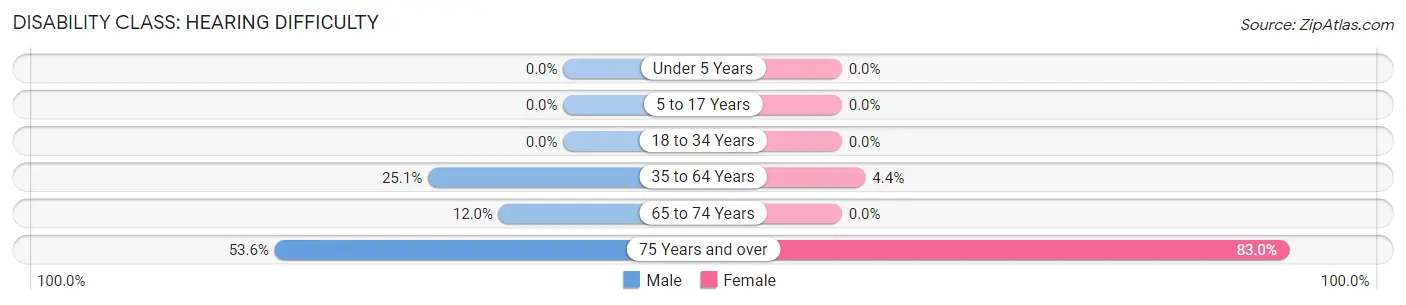
| Age Bracket | Male | Female |
| Under 5 Years | 0 (0.0%) | 0 (0.0%) |
| 5 to 17 Years | 0 (0.0%) | 0 (0.0%) |
| 18 to 34 Years | 0 (0.0%) | 0 (0.0%) |
| 35 to 64 Years | 146 (25.1%) | 28 (4.4%) |
| 65 to 74 Years | 14 (12.0%) | 0 (0.0%) |
| 75 Years and over | 15 (53.6%) | 73 (83.0%) |
Disability Class: Vision Difficulty
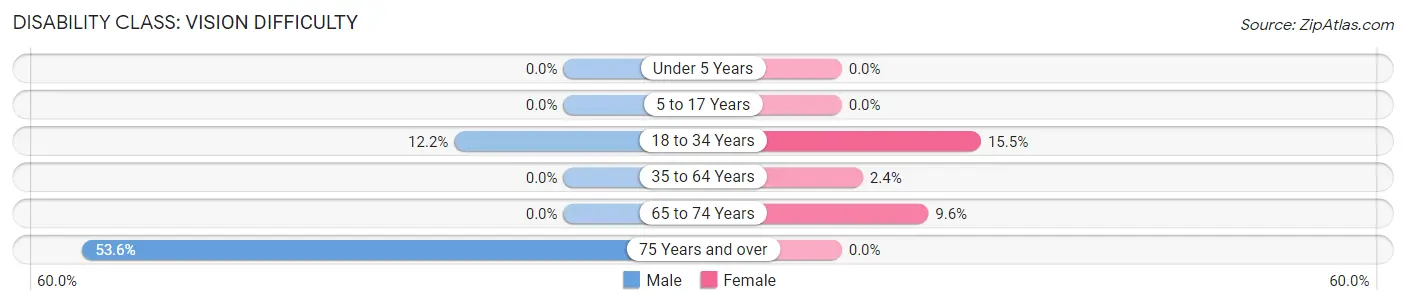
| Age Bracket | Male | Female |
| Under 5 Years | 0 (0.0%) | 0 (0.0%) |
| 5 to 17 Years | 0 (0.0%) | 0 (0.0%) |
| 18 to 34 Years | 40 (12.2%) | 51 (15.5%) |
| 35 to 64 Years | 0 (0.0%) | 15 (2.4%) |
| 65 to 74 Years | 0 (0.0%) | 16 (9.6%) |
| 75 Years and over | 15 (53.6%) | 0 (0.0%) |
Disability Class: Cognitive Difficulty
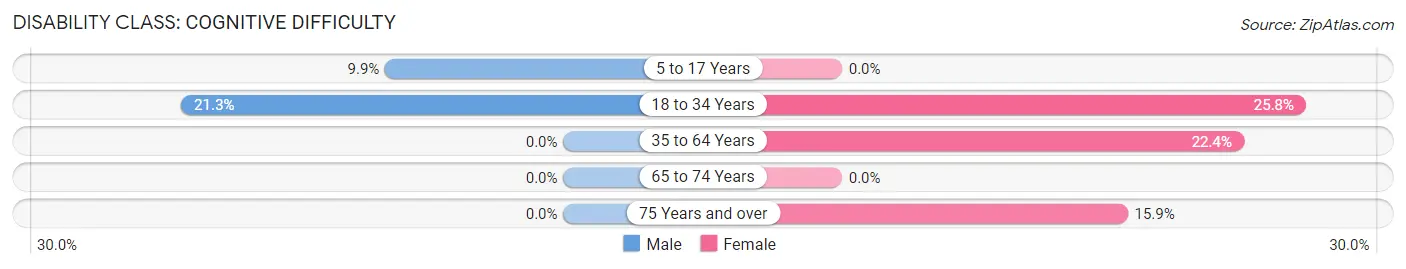
| Age Bracket | Male | Female |
| 5 to 17 Years | 25 (9.9%) | 0 (0.0%) |
| 18 to 34 Years | 70 (21.3%) | 85 (25.8%) |
| 35 to 64 Years | 0 (0.0%) | 143 (22.4%) |
| 65 to 74 Years | 0 (0.0%) | 0 (0.0%) |
| 75 Years and over | 0 (0.0%) | 14 (15.9%) |
Disability Class: Ambulatory Difficulty
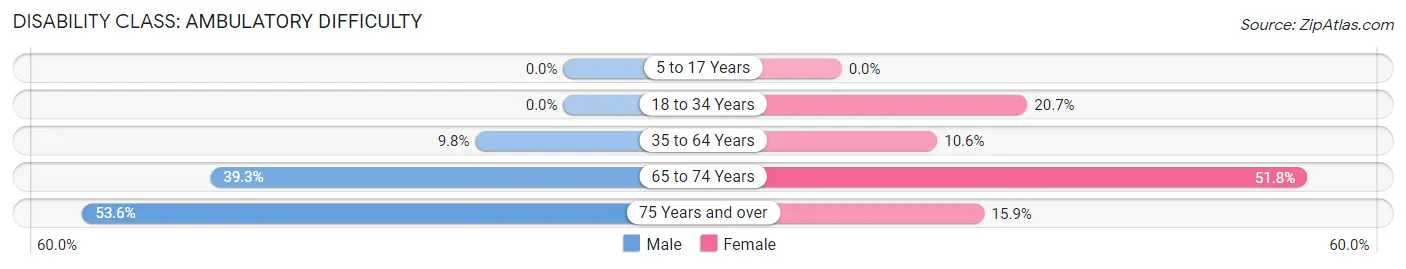
| Age Bracket | Male | Female |
| 5 to 17 Years | 0 (0.0%) | 0 (0.0%) |
| 18 to 34 Years | 0 (0.0%) | 68 (20.7%) |
| 35 to 64 Years | 57 (9.8%) | 68 (10.6%) |
| 65 to 74 Years | 46 (39.3%) | 86 (51.8%) |
| 75 Years and over | 15 (53.6%) | 14 (15.9%) |
Disability Class: Self-Care Difficulty
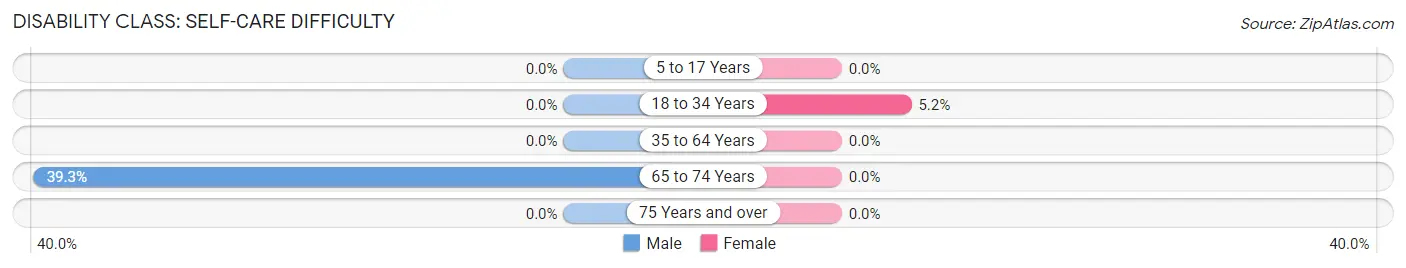
| Age Bracket | Male | Female |
| 5 to 17 Years | 0 (0.0%) | 0 (0.0%) |
| 18 to 34 Years | 0 (0.0%) | 17 (5.2%) |
| 35 to 64 Years | 0 (0.0%) | 0 (0.0%) |
| 65 to 74 Years | 46 (39.3%) | 0 (0.0%) |
| 75 Years and over | 0 (0.0%) | 0 (0.0%) |
Technology Access in Fords Prairie
Computing Device Access in Fords Prairie
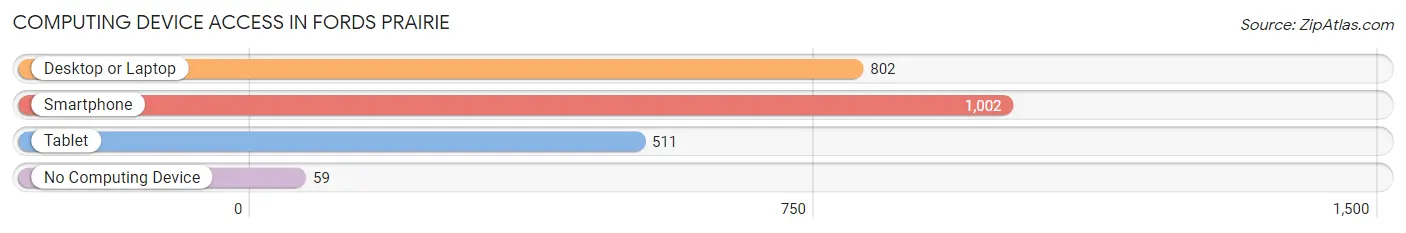
| Device Type | # Households | % Households |
| Desktop or Laptop | 802 | 73.2% |
| Smartphone | 1,002 | 91.5% |
| Tablet | 511 | 46.7% |
| No Computing Device | 59 | 5.4% |
| Total | 1,095 | 100.0% |
Internet Access in Fords Prairie
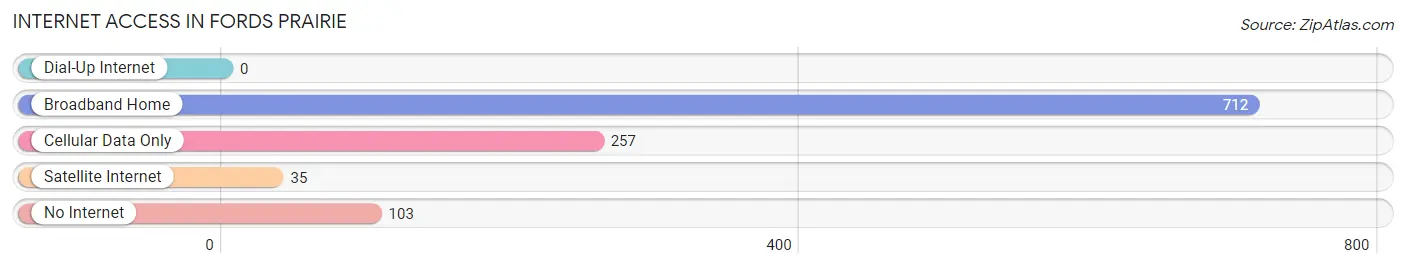
| Internet Type | # Households | % Households |
| Dial-Up Internet | 0 | 0.0% |
| Broadband Home | 712 | 65.0% |
| Cellular Data Only | 257 | 23.5% |
| Satellite Internet | 35 | 3.2% |
| No Internet | 103 | 9.4% |
| Total | 1,095 | 100.0% |
Fords Prairie Summary
Fords Prairie is a small unincorporated community located in the state of Washington, United States. It is situated in the southeastern part of the state, in the county of Thurston. The community is located on the banks of the Deschutes River, near the city of Olympia.
History
Fords Prairie was first settled in the late 1800s by a group of settlers from the Midwest. The settlers were attracted to the area due to its fertile soil and abundant natural resources. The settlers built a small community and named it after the nearby Ford’s Prairie, which was named after the first settler, William Ford.
The community grew slowly over the years, and by the early 1900s, it had become a thriving agricultural community. The area was known for its dairy farms, and the community was home to several small businesses, including a general store, a blacksmith shop, and a post office.
In the 1950s, the community began to decline as the population shifted to larger cities. By the 1970s, the population had dropped to just a few hundred people. In the 1980s, the community began to experience a resurgence as people began to move back to the area. Today, Fords Prairie is a small, rural community with a population of around 500 people.
Geography
Fords Prairie is located in the southeastern part of the state of Washington, in the county of Thurston. The community is situated on the banks of the Deschutes River, near the city of Olympia. The area is characterized by rolling hills and lush forests. The climate is mild, with temperatures ranging from the mid-50s in the winter to the mid-80s in the summer.
Economy
Fords Prairie is a small, rural community with a population of around 500 people. The economy of the community is largely based on agriculture, with dairy farming being the primary industry. The area is also home to several small businesses, including a general store, a blacksmith shop, and a post office.
Demographics
As of the 2010 census, the population of Fords Prairie was 498 people. The racial makeup of the community was 94.4% White, 0.2% African American, 0.4% Native American, 0.2% Asian, 0.2% Pacific Islander, 0.2% from other races, and 4.6% from two or more races. The median household income was $45,000, and the median age was 44.5 years. The majority of the population (90.2%) was over the age of 18, and the median home value was $179,000.
Common Questions
What is Per Capita Income in Fords Prairie?
Per Capita income in Fords Prairie is $31,968.
What is the Median Family Income in Fords Prairie?
Median Family Income in Fords Prairie is $88,250.
What is the Median Household income in Fords Prairie?
Median Household Income in Fords Prairie is $82,741.
What is Income or Wage Gap in Fords Prairie?
Income or Wage Gap in Fords Prairie is 31.7%.
Women in Fords Prairie earn 68.3 cents for every dollar earned by a man.
What is Family Income Deficit in Fords Prairie?
Family Income Deficit in Fords Prairie is $8,176.
Families that are below poverty line in Fords Prairie earn $8,176 less on average than the poverty threshold level.
What is Inequality or Gini Index in Fords Prairie?
Inequality or Gini Index in Fords Prairie is 0.40.
What is the Total Population of Fords Prairie?
Total Population of Fords Prairie is 2,842.
What is the Total Male Population of Fords Prairie?
Total Male Population of Fords Prairie is 1,373.
What is the Total Female Population of Fords Prairie?
Total Female Population of Fords Prairie is 1,469.
What is the Ratio of Males per 100 Females in Fords Prairie?
There are 93.46 Males per 100 Females in Fords Prairie.
What is the Ratio of Females per 100 Males in Fords Prairie?
There are 106.99 Females per 100 Males in Fords Prairie.
What is the Median Population Age in Fords Prairie?
Median Population Age in Fords Prairie is 45.0 Years.
What is the Average Family Size in Fords Prairie
Average Family Size in Fords Prairie is 3.2 People.
What is the Average Household Size in Fords Prairie
Average Household Size in Fords Prairie is 2.6 People.
How Large is the Labor Force in Fords Prairie?
There are 1,376 People in the Labor Forcein in Fords Prairie.
What is the Percentage of People in the Labor Force in Fords Prairie?
59.2% of People are in the Labor Force in Fords Prairie.
What is the Unemployment Rate in Fords Prairie?
Unemployment Rate in Fords Prairie is 4.1%.