Zip Codes with the Highest Percentage of Population with a Degree in Science and Engineering in Marysville, WA
RELATED REPORTS & OPTIONS
Science and Engineering
Marysville
Compare Zip Codes
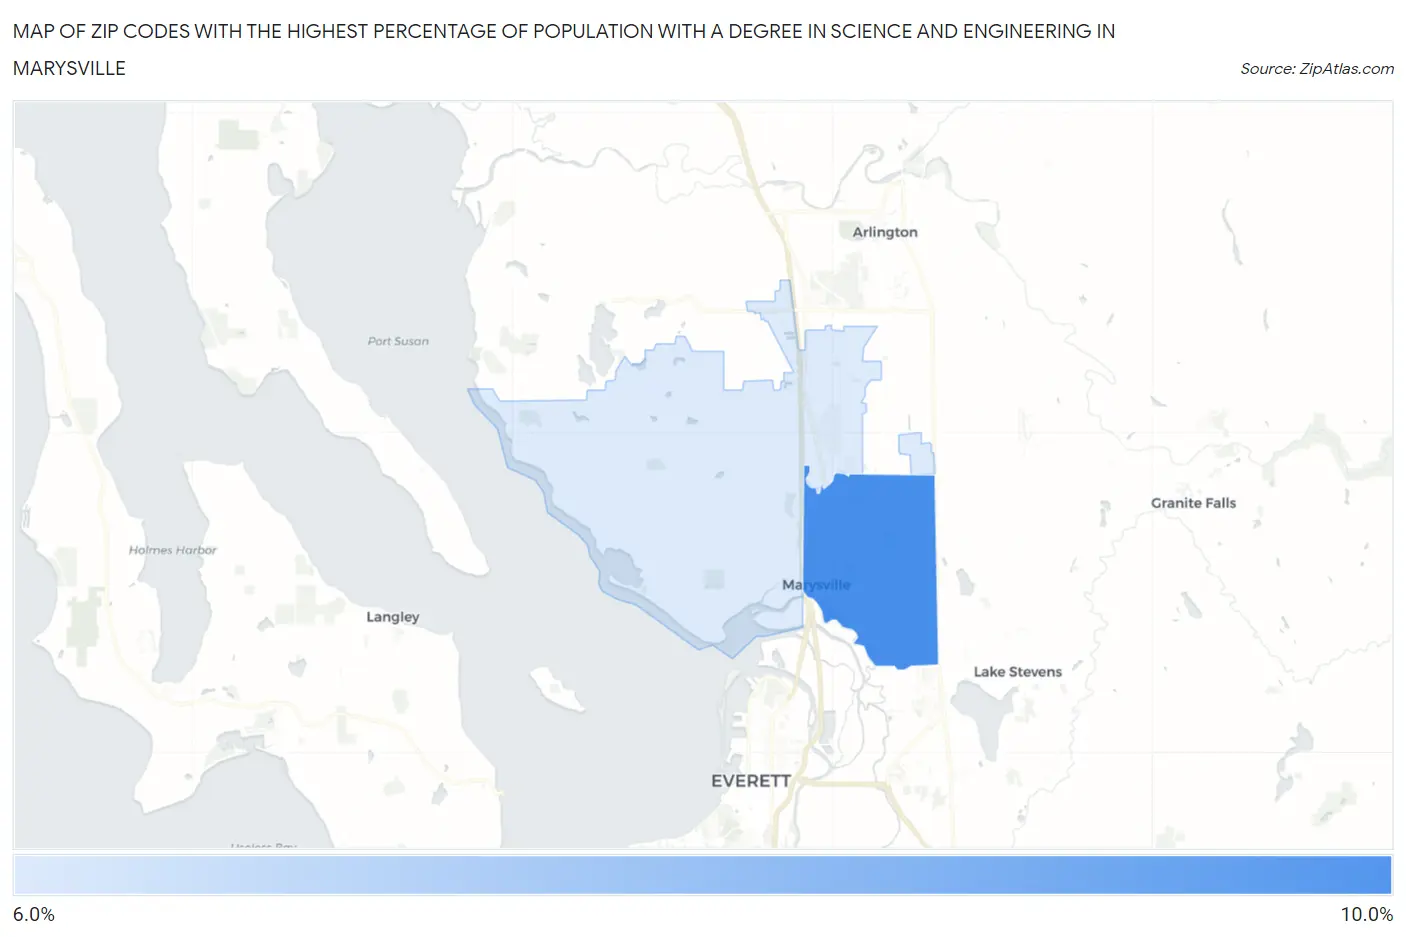
Map of Zip Codes with the Highest Percentage of Population with a Degree in Science and Engineering in Marysville
6.0%
8.1%
Zip Codes with the Highest Percentage of Population with a Degree in Science and Engineering in Marysville, WA
| Zip Code | % Graduates | vs State | vs National | |
| 1. | 98270 | 8.1% | 8.7%(-0.606)#308 | 9.8%(-1.65)#19,353 |
| 2. | 98271 | 6.0% | 8.7%(-2.70)#422 | 9.8%(-3.74)#23,381 |
1
Common Questions
What are the Top Zip Codes with the Highest Percentage of Population with a Degree in Science and Engineering in Marysville, WA?
Top Zip Codes with the Highest Percentage of Population with a Degree in Science and Engineering in Marysville, WA are:
What zip code has the Highest Percentage of Population with a Degree in Science and Engineering in Marysville, WA?
98270 has the Highest Percentage of Population with a Degree in Science and Engineering in Marysville, WA with 8.1%.
What is the Percentage of Population with a Degree in Science and Engineering in Marysville, WA?
Percentage of Population with a Degree in Science and Engineering in Marysville is 7.7%.
What is the Percentage of Population with a Degree in Science and Engineering in Washington?
Percentage of Population with a Degree in Science and Engineering in Washington is 8.7%.
What is the Percentage of Population with a Degree in Science and Engineering in the United States?
Percentage of Population with a Degree in Science and Engineering in the United States is 9.8%.