Zip Codes with the Highest Percentage of Population with a Degree in Science and Engineering in Puyallup, WA
RELATED REPORTS & OPTIONS
Science and Engineering
Puyallup
Compare Zip Codes
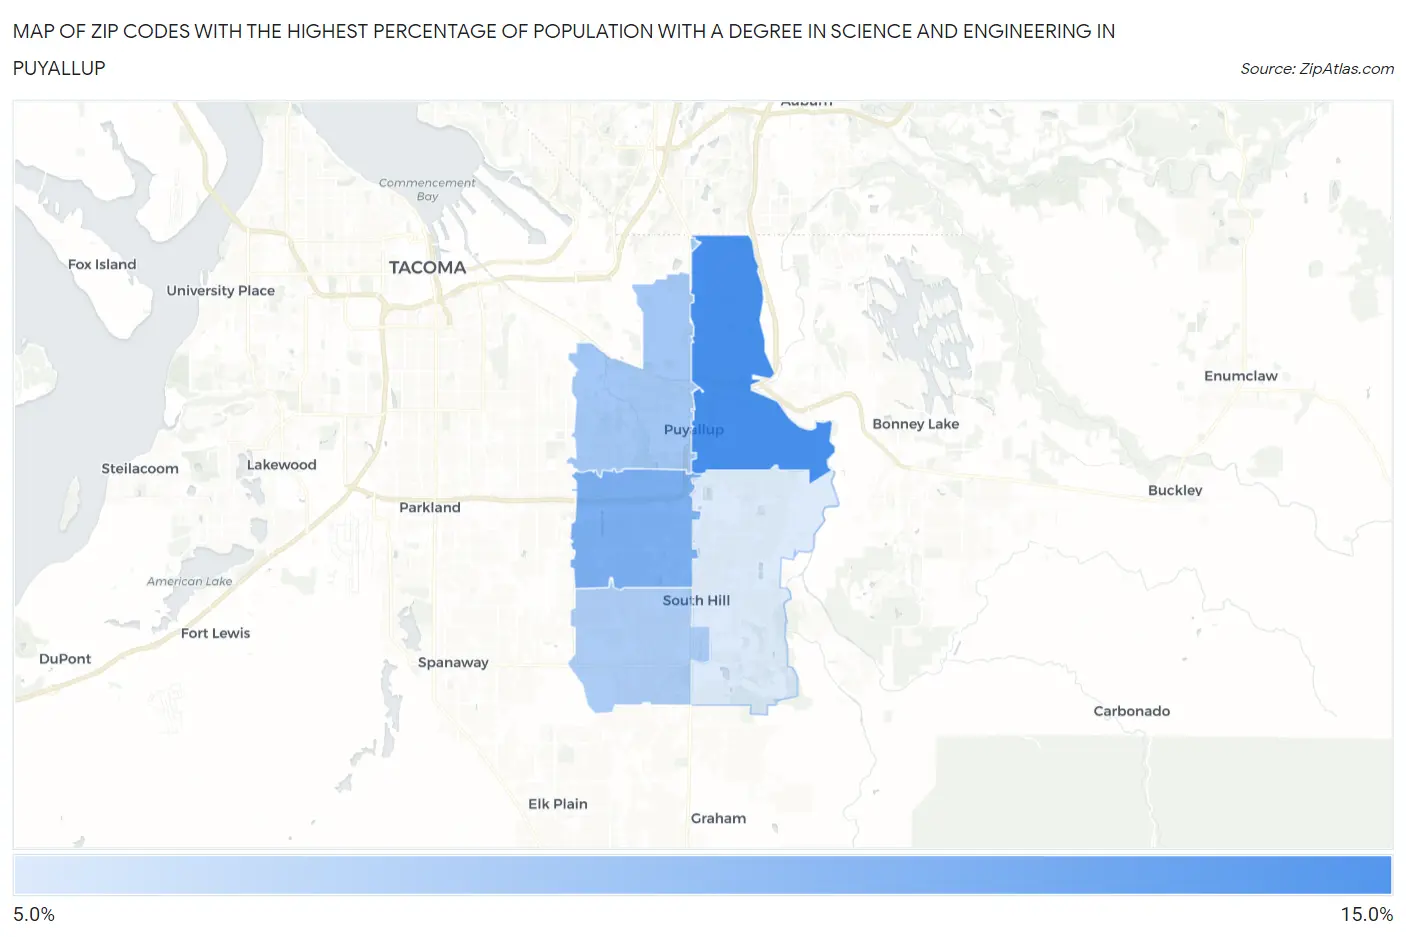
Map of Zip Codes with the Highest Percentage of Population with a Degree in Science and Engineering in Puyallup
8.1%
14.2%
Zip Codes with the Highest Percentage of Population with a Degree in Science and Engineering in Puyallup, WA
| Zip Code | % Graduates | vs State | vs National | |
| 1. | 98372 | 14.2% | 8.7%(+5.51)#79 | 9.8%(+4.47)#7,564 |
| 2. | 98373 | 12.0% | 8.7%(+3.29)#122 | 9.8%(+2.25)#10,845 |
| 3. | 98371 | 10.4% | 8.7%(+1.66)#194 | 9.8%(+0.618)#14,191 |
| 4. | 98375 | 10.0% | 8.7%(+1.23)#207 | 9.8%(+0.190)#15,097 |
| 5. | 98374 | 8.1% | 8.7%(-0.685)#312 | 9.8%(-1.73)#19,508 |
1
Common Questions
What are the Top 3 Zip Codes with the Highest Percentage of Population with a Degree in Science and Engineering in Puyallup, WA?
Top 3 Zip Codes with the Highest Percentage of Population with a Degree in Science and Engineering in Puyallup, WA are:
What zip code has the Highest Percentage of Population with a Degree in Science and Engineering in Puyallup, WA?
98372 has the Highest Percentage of Population with a Degree in Science and Engineering in Puyallup, WA with 14.2%.
What is the Percentage of Population with a Degree in Science and Engineering in Puyallup, WA?
Percentage of Population with a Degree in Science and Engineering in Puyallup is 13.0%.
What is the Percentage of Population with a Degree in Science and Engineering in Washington?
Percentage of Population with a Degree in Science and Engineering in Washington is 8.7%.
What is the Percentage of Population with a Degree in Science and Engineering in the United States?
Percentage of Population with a Degree in Science and Engineering in the United States is 9.8%.