Zip Codes with the Highest Percentage of Population with a Degree in Science and Engineering in Seattle, WA
RELATED REPORTS & OPTIONS
Science and Engineering
Seattle
Compare Zip Codes
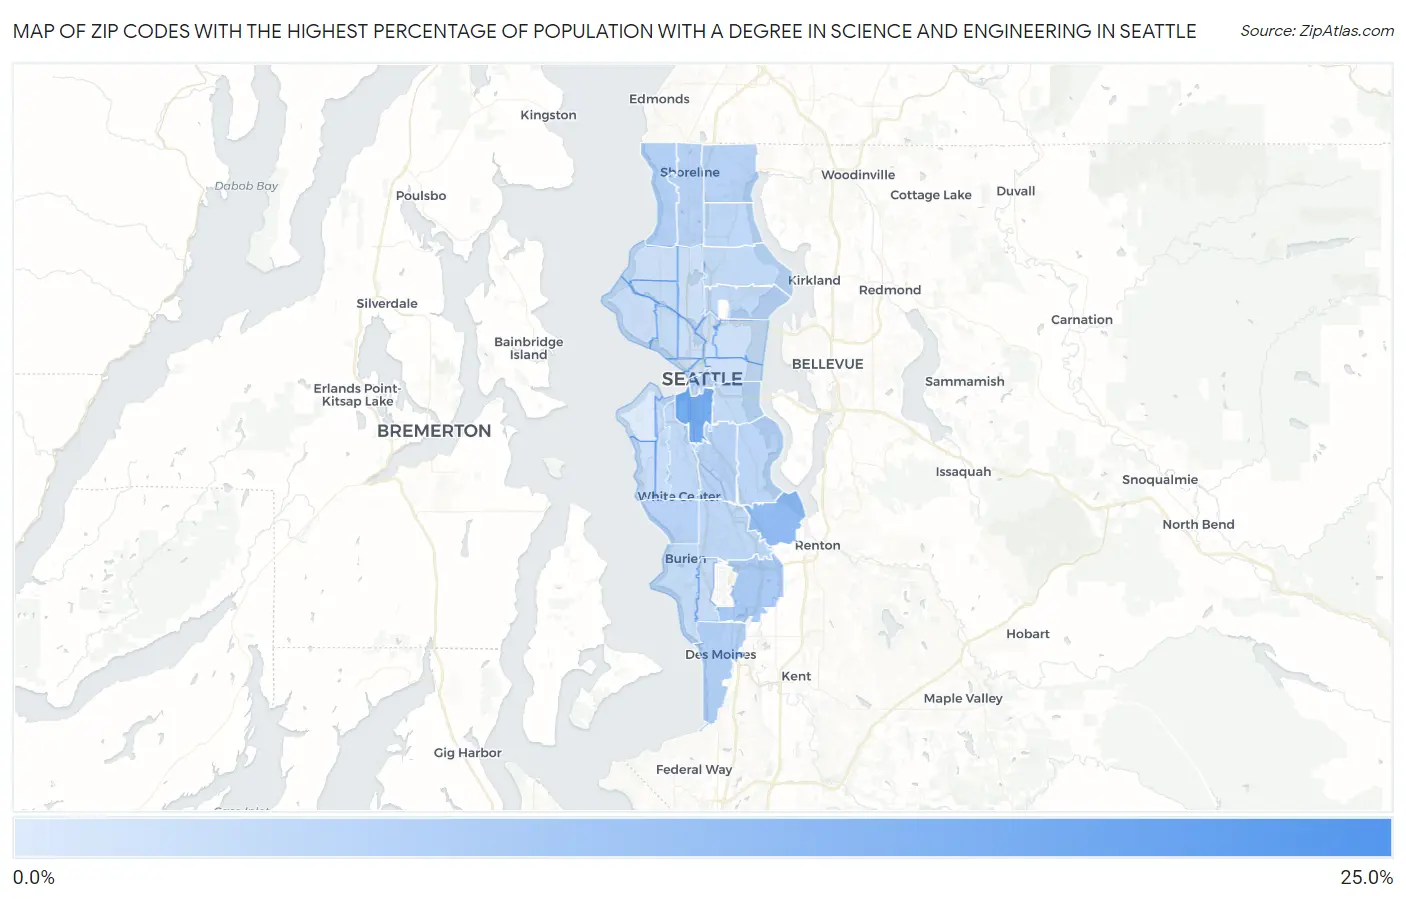
Map of Zip Codes with the Highest Percentage of Population with a Degree in Science and Engineering in Seattle
4.8%
23.1%
Zip Codes with the Highest Percentage of Population with a Degree in Science and Engineering in Seattle, WA
| Zip Code | % Graduates | vs State | vs National | |
| 1. | 98164 | 23.1% | 8.7%(+14.4)#25 | 9.8%(+13.3)#2,357 |
| 2. | 98134 | 17.1% | 8.7%(+8.36)#48 | 9.8%(+7.32)#4,868 |
| 3. | 98178 | 13.9% | 8.7%(+5.12)#84 | 9.8%(+4.08)#8,038 |
| 4. | 98188 | 10.6% | 8.7%(+1.82)#184 | 9.8%(+0.776)#13,821 |
| 5. | 98198 | 9.7% | 8.7%(+0.959)#221 | 9.8%(-0.083)#15,711 |
| 6. | 98177 | 9.5% | 8.7%(+0.713)#231 | 9.8%(-0.329)#16,275 |
| 7. | 98155 | 9.2% | 8.7%(+0.420)#247 | 9.8%(-0.622)#16,951 |
| 8. | 98108 | 9.1% | 8.7%(+0.325)#250 | 9.8%(-0.717)#17,186 |
| 9. | 98133 | 9.0% | 8.7%(+0.282)#254 | 9.8%(-0.759)#17,292 |
| 10. | 98146 | 8.9% | 8.7%(+0.188)#259 | 9.8%(-0.853)#17,501 |
| 11. | 98104 | 8.5% | 8.7%(-0.260)#283 | 9.8%(-1.30)#18,505 |
| 12. | 98118 | 8.4% | 8.7%(-0.299)#288 | 9.8%(-1.34)#18,604 |
| 13. | 98125 | 8.2% | 8.7%(-0.500)#301 | 9.8%(-1.54)#19,101 |
| 14. | 98168 | 8.2% | 8.7%(-0.542)#304 | 9.8%(-1.58)#19,196 |
| 15. | 98105 | 8.0% | 8.7%(-0.711)#313 | 9.8%(-1.75)#19,568 |
| 16. | 98106 | 7.9% | 8.7%(-0.804)#315 | 9.8%(-1.85)#19,784 |
| 17. | 98144 | 7.7% | 8.7%(-0.994)#329 | 9.8%(-2.04)#20,192 |
| 18. | 98115 | 7.7% | 8.7%(-1.02)#331 | 9.8%(-2.06)#20,242 |
| 19. | 98119 | 7.5% | 8.7%(-1.24)#346 | 9.8%(-2.28)#20,728 |
| 20. | 98107 | 7.4% | 8.7%(-1.37)#351 | 9.8%(-2.41)#20,996 |
| 21. | 98166 | 7.3% | 8.7%(-1.42)#358 | 9.8%(-2.47)#21,108 |
| 22. | 98148 | 7.3% | 8.7%(-1.46)#360 | 9.8%(-2.51)#21,180 |
| 23. | 98126 | 7.3% | 8.7%(-1.47)#361 | 9.8%(-2.51)#21,206 |
| 24. | 98136 | 6.8% | 8.7%(-1.91)#385 | 9.8%(-2.95)#22,030 |
| 25. | 98199 | 6.8% | 8.7%(-1.94)#386 | 9.8%(-2.99)#22,082 |
| 26. | 98109 | 6.6% | 8.7%(-2.15)#396 | 9.8%(-3.19)#22,432 |
| 27. | 98103 | 6.4% | 8.7%(-2.30)#402 | 9.8%(-3.34)#22,688 |
| 28. | 98122 | 6.4% | 8.7%(-2.30)#403 | 9.8%(-3.34)#22,701 |
| 29. | 98112 | 6.4% | 8.7%(-2.34)#404 | 9.8%(-3.38)#22,753 |
| 30. | 98117 | 6.4% | 8.7%(-2.37)#406 | 9.8%(-3.41)#22,806 |
| 31. | 98102 | 6.3% | 8.7%(-2.41)#407 | 9.8%(-3.45)#22,881 |
| 32. | 98121 | 6.2% | 8.7%(-2.58)#418 | 9.8%(-3.62)#23,187 |
| 33. | 98101 | 6.1% | 8.7%(-2.66)#421 | 9.8%(-3.71)#23,325 |
| 34. | 98116 | 4.8% | 8.7%(-3.92)#451 | 9.8%(-4.96)#24,938 |
1
Common Questions
What are the Top 10 Zip Codes with the Highest Percentage of Population with a Degree in Science and Engineering in Seattle, WA?
Top 10 Zip Codes with the Highest Percentage of Population with a Degree in Science and Engineering in Seattle, WA are:
What zip code has the Highest Percentage of Population with a Degree in Science and Engineering in Seattle, WA?
98164 has the Highest Percentage of Population with a Degree in Science and Engineering in Seattle, WA with 23.1%.
What is the Percentage of Population with a Degree in Science and Engineering in Seattle, WA?
Percentage of Population with a Degree in Science and Engineering in Seattle is 7.1%.
What is the Percentage of Population with a Degree in Science and Engineering in Washington?
Percentage of Population with a Degree in Science and Engineering in Washington is 8.7%.
What is the Percentage of Population with a Degree in Science and Engineering in the United States?
Percentage of Population with a Degree in Science and Engineering in the United States is 9.8%.