Zip Codes with the Highest Percentage of Population with a Degree in Science and Engineering in Richland, WA
RELATED REPORTS & OPTIONS
Science and Engineering
Richland
Compare Zip Codes
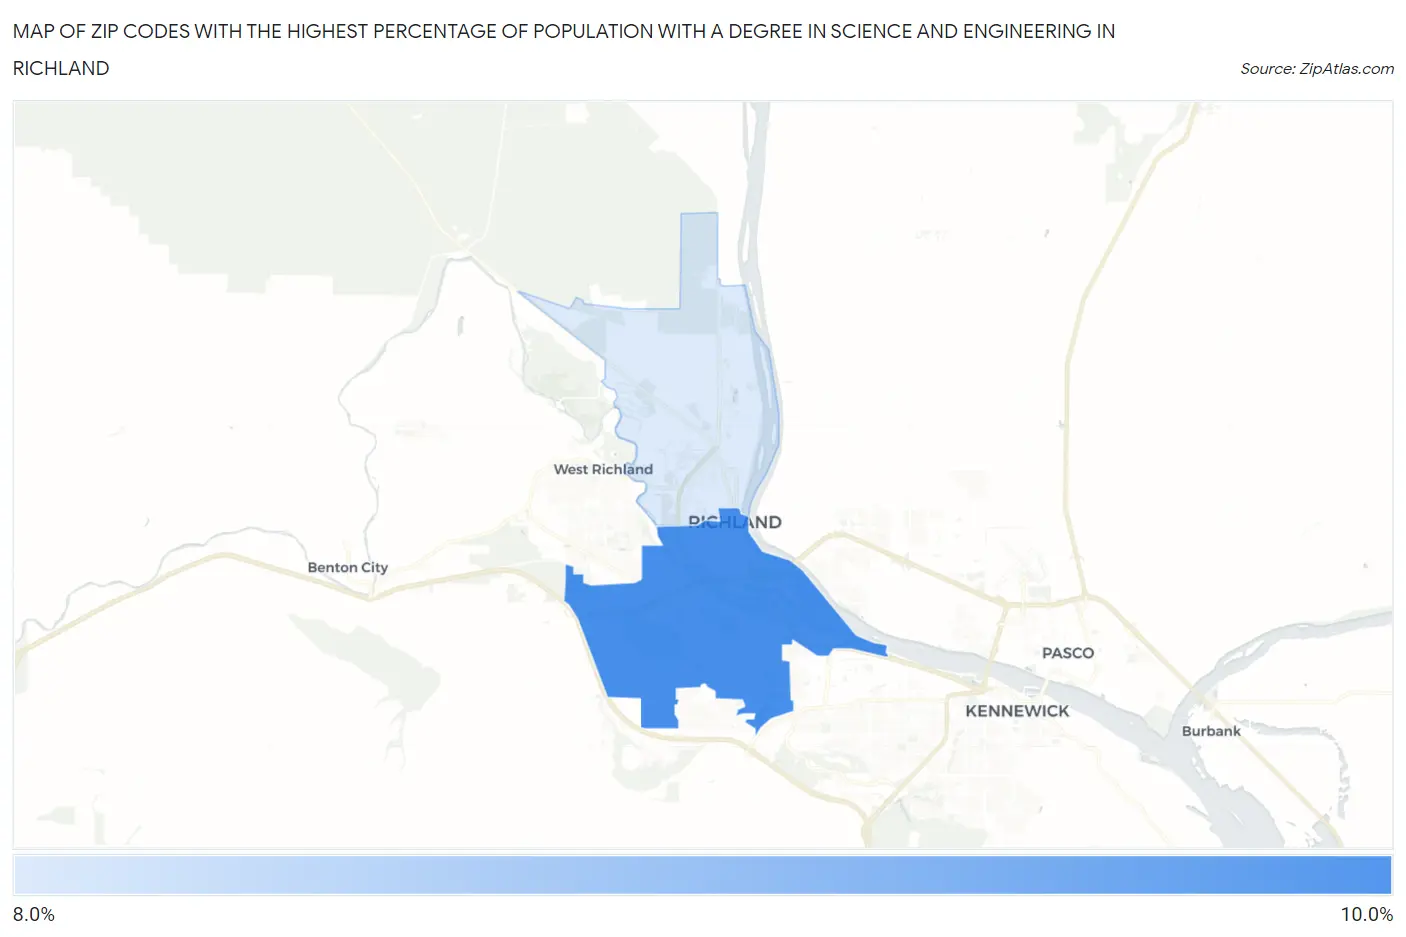
Map of Zip Codes with the Highest Percentage of Population with a Degree in Science and Engineering in Richland
8.1%
8.5%
Zip Codes with the Highest Percentage of Population with a Degree in Science and Engineering in Richland, WA
| Zip Code | % Graduates | vs State | vs National | |
| 1. | 99352 | 8.5% | 8.7%(-0.282)#286 | 9.8%(-1.32)#18,560 |
| 2. | 99354 | 8.1% | 8.7%(-0.603)#307 | 9.8%(-1.64)#19,348 |
1
Common Questions
What are the Top Zip Codes with the Highest Percentage of Population with a Degree in Science and Engineering in Richland, WA?
Top Zip Codes with the Highest Percentage of Population with a Degree in Science and Engineering in Richland, WA are:
What zip code has the Highest Percentage of Population with a Degree in Science and Engineering in Richland, WA?
99352 has the Highest Percentage of Population with a Degree in Science and Engineering in Richland, WA with 8.5%.
What is the Percentage of Population with a Degree in Science and Engineering in Richland, WA?
Percentage of Population with a Degree in Science and Engineering in Richland is 8.5%.
What is the Percentage of Population with a Degree in Science and Engineering in Washington?
Percentage of Population with a Degree in Science and Engineering in Washington is 8.7%.
What is the Percentage of Population with a Degree in Science and Engineering in the United States?
Percentage of Population with a Degree in Science and Engineering in the United States is 9.8%.