Zip Codes with the Highest Percentage of Population with a Degree in Science and Engineering in Kirkland, WA
RELATED REPORTS & OPTIONS
Science and Engineering
Kirkland
Compare Zip Codes
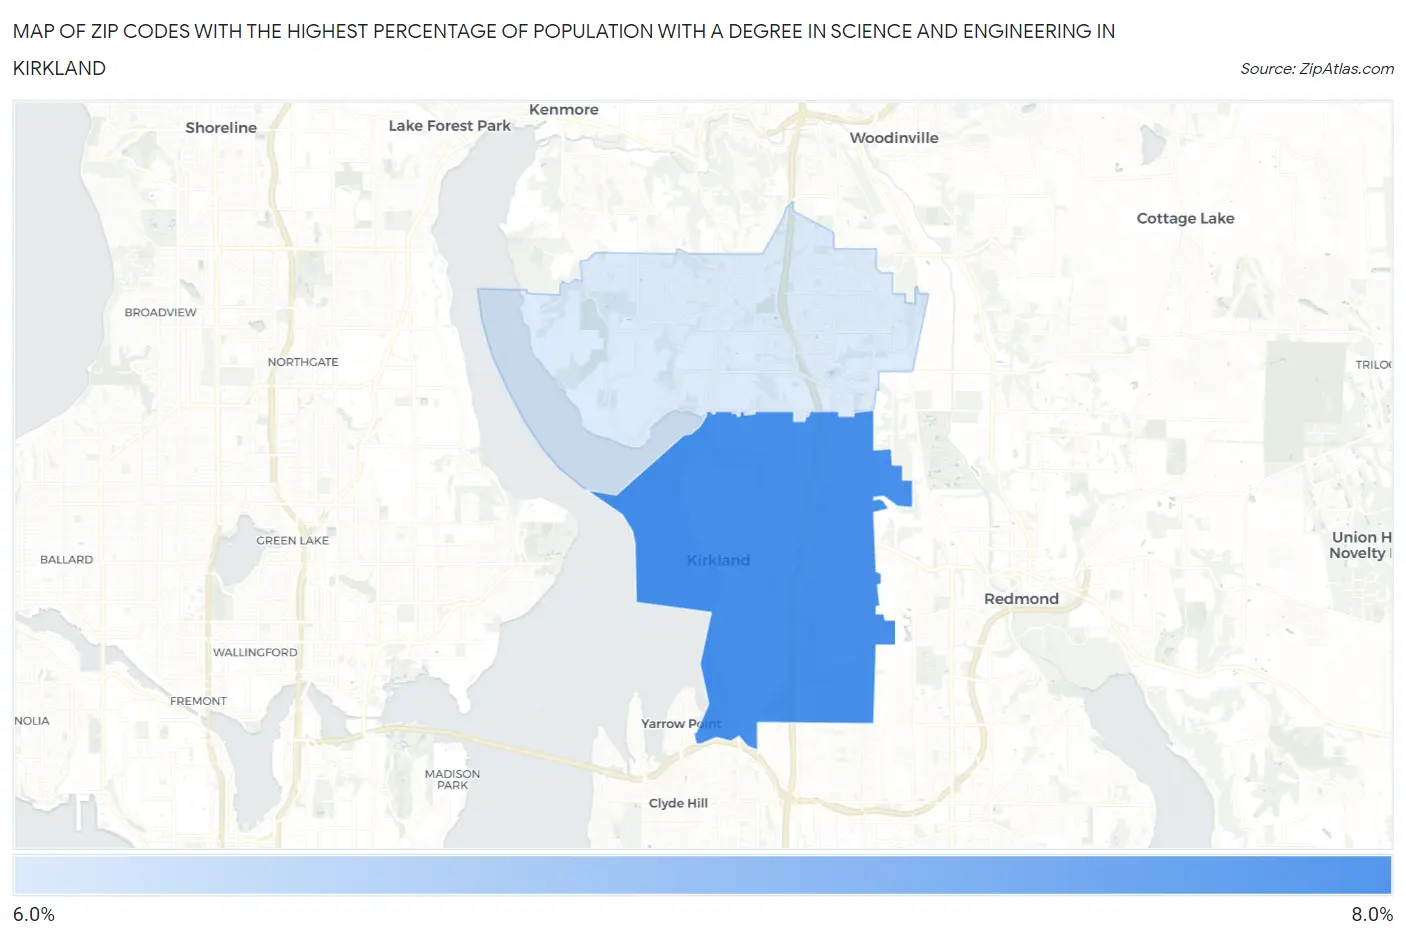
Map of Zip Codes with the Highest Percentage of Population with a Degree in Science and Engineering in Kirkland
6.7%
6.7%
Zip Codes with the Highest Percentage of Population with a Degree in Science and Engineering in Kirkland, WA
| Zip Code | % Graduates | vs State | vs National | |
| 1. | 98033 | 6.7% | 8.7%(-2.07)#391 | 9.8%(-3.11)#22,268 |
| 2. | 98034 | 6.7% | 8.7%(-2.09)#393 | 9.8%(-3.13)#22,329 |
1
Common Questions
What are the Top Zip Codes with the Highest Percentage of Population with a Degree in Science and Engineering in Kirkland, WA?
Top Zip Codes with the Highest Percentage of Population with a Degree in Science and Engineering in Kirkland, WA are:
What zip code has the Highest Percentage of Population with a Degree in Science and Engineering in Kirkland, WA?
98033 has the Highest Percentage of Population with a Degree in Science and Engineering in Kirkland, WA with 6.7%.
What is the Percentage of Population with a Degree in Science and Engineering in Kirkland, WA?
Percentage of Population with a Degree in Science and Engineering in Kirkland is 6.7%.
What is the Percentage of Population with a Degree in Science and Engineering in Washington?
Percentage of Population with a Degree in Science and Engineering in Washington is 8.7%.
What is the Percentage of Population with a Degree in Science and Engineering in the United States?
Percentage of Population with a Degree in Science and Engineering in the United States is 9.8%.