Zip Codes with the Highest Percentage of Population with a Degree in Science and Engineering in Redmond, WA
RELATED REPORTS & OPTIONS
Science and Engineering
Redmond
Compare Zip Codes
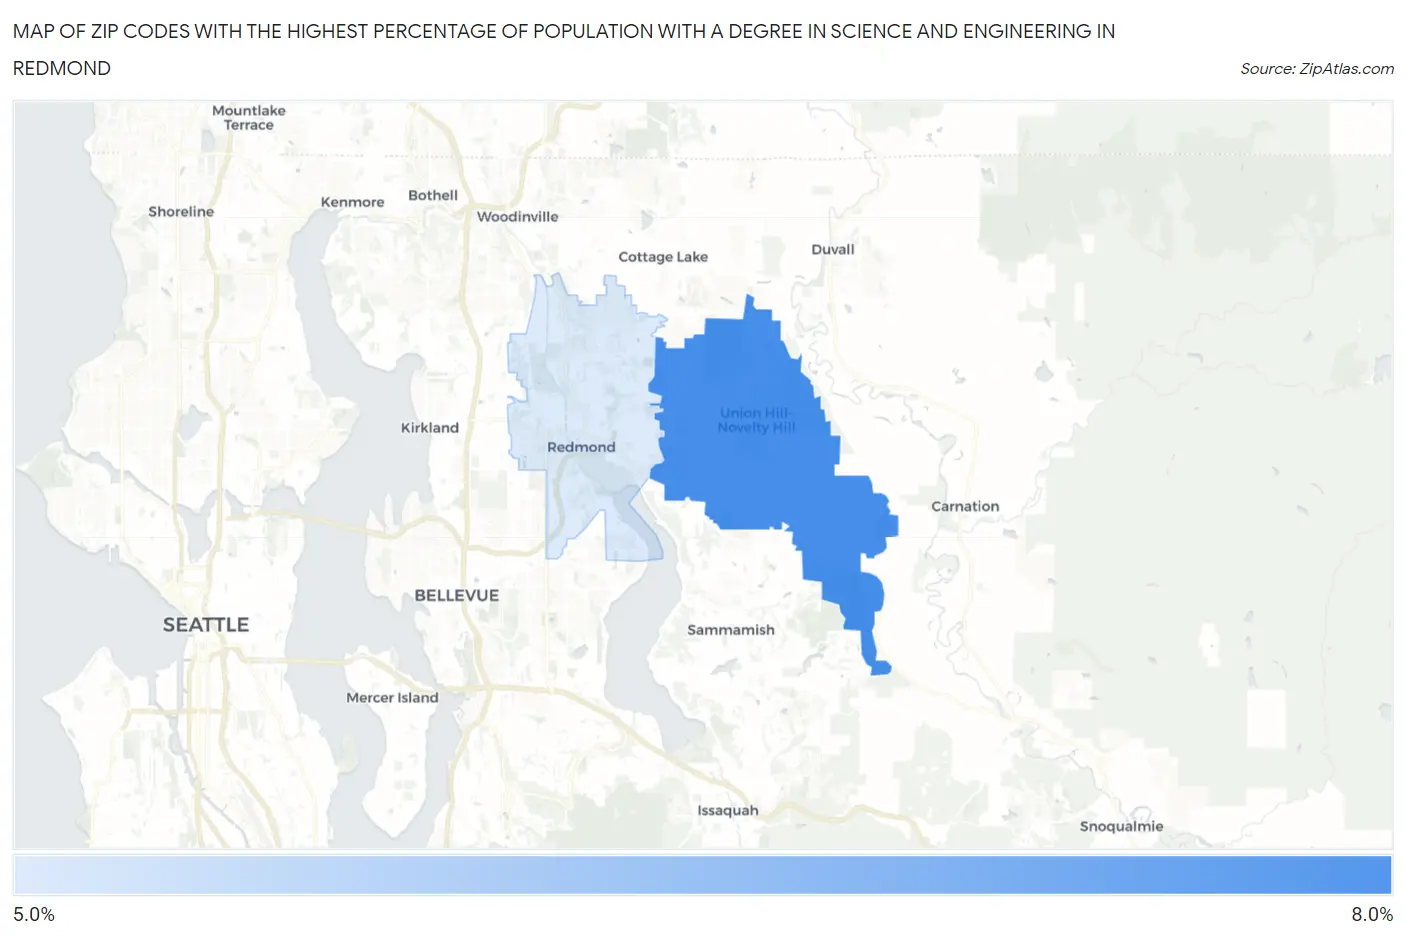
Map of Zip Codes with the Highest Percentage of Population with a Degree in Science and Engineering in Redmond
5.7%
6.2%
Zip Codes with the Highest Percentage of Population with a Degree in Science and Engineering in Redmond, WA
| Zip Code | % Graduates | vs State | vs National | |
| 1. | 98053 | 6.2% | 8.7%(-2.52)#417 | 9.8%(-3.56)#23,086 |
| 2. | 98052 | 5.7% | 8.7%(-3.03)#428 | 9.8%(-4.07)#23,869 |
1
Common Questions
What are the Top Zip Codes with the Highest Percentage of Population with a Degree in Science and Engineering in Redmond, WA?
Top Zip Codes with the Highest Percentage of Population with a Degree in Science and Engineering in Redmond, WA are:
What zip code has the Highest Percentage of Population with a Degree in Science and Engineering in Redmond, WA?
98053 has the Highest Percentage of Population with a Degree in Science and Engineering in Redmond, WA with 6.2%.
What is the Percentage of Population with a Degree in Science and Engineering in Redmond, WA?
Percentage of Population with a Degree in Science and Engineering in Redmond is 5.6%.
What is the Percentage of Population with a Degree in Science and Engineering in Washington?
Percentage of Population with a Degree in Science and Engineering in Washington is 8.7%.
What is the Percentage of Population with a Degree in Science and Engineering in the United States?
Percentage of Population with a Degree in Science and Engineering in the United States is 9.8%.