Zip Codes with the Highest Percentage of Population with a Degree in Science and Engineering in Bellingham, WA
RELATED REPORTS & OPTIONS
Science and Engineering
Bellingham
Compare Zip Codes
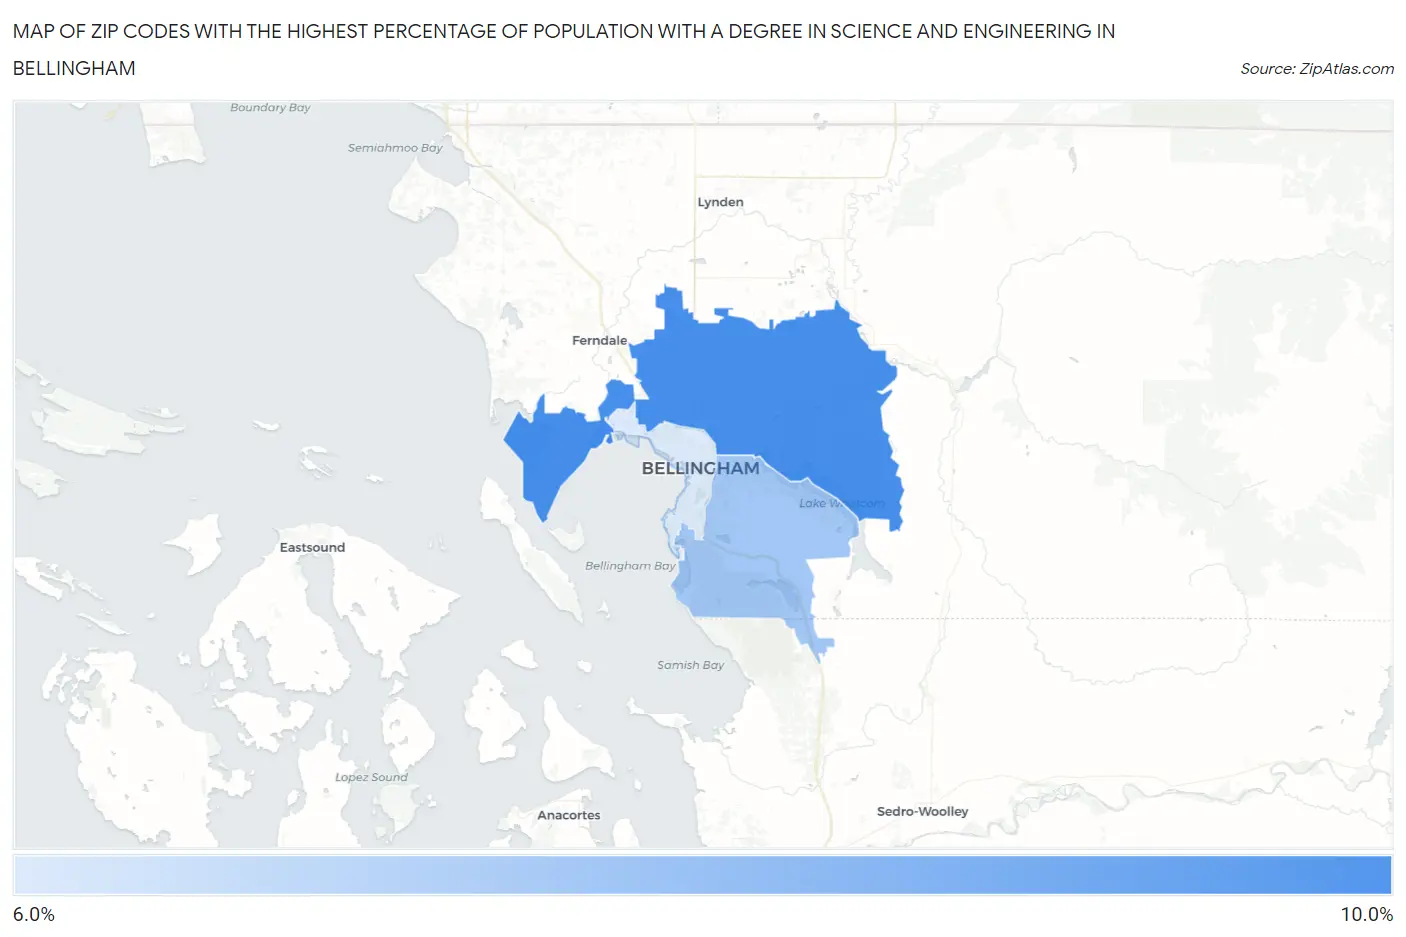
Map of Zip Codes with the Highest Percentage of Population with a Degree in Science and Engineering in Bellingham
6.3%
9.4%
Zip Codes with the Highest Percentage of Population with a Degree in Science and Engineering in Bellingham, WA
| Zip Code | % Graduates | vs State | vs National | |
| 1. | 98226 | 9.4% | 8.7%(+0.667)#235 | 9.8%(-0.375)#16,383 |
| 2. | 98229 | 7.5% | 8.7%(-1.23)#344 | 9.8%(-2.27)#20,698 |
| 3. | 98225 | 6.3% | 8.7%(-2.43)#409 | 9.8%(-3.47)#22,923 |
1
Common Questions
What are the Top Zip Codes with the Highest Percentage of Population with a Degree in Science and Engineering in Bellingham, WA?
Top Zip Codes with the Highest Percentage of Population with a Degree in Science and Engineering in Bellingham, WA are:
What zip code has the Highest Percentage of Population with a Degree in Science and Engineering in Bellingham, WA?
98226 has the Highest Percentage of Population with a Degree in Science and Engineering in Bellingham, WA with 9.4%.
What is the Percentage of Population with a Degree in Science and Engineering in Bellingham, WA?
Percentage of Population with a Degree in Science and Engineering in Bellingham is 7.3%.
What is the Percentage of Population with a Degree in Science and Engineering in Washington?
Percentage of Population with a Degree in Science and Engineering in Washington is 8.7%.
What is the Percentage of Population with a Degree in Science and Engineering in the United States?
Percentage of Population with a Degree in Science and Engineering in the United States is 9.8%.