Pasco, WA Map & Demographics
Pasco Map
Pasco Overview
$30,242
PER CAPITA INCOME
$79,877
AVG FAMILY INCOME
$75,316
AVG HOUSEHOLD INCOME
29.4%
WAGE / INCOME GAP [ % ]
70.6¢/ $1
WAGE / INCOME GAP [ $ ]
$12,044
FAMILY INCOME DEFICIT
0.41
INEQUALITY / GINI INDEX
77,274
TOTAL POPULATION
39,102
MALE POPULATION
38,172
FEMALE POPULATION
102.44
MALES / 100 FEMALES
97.62
FEMALES / 100 MALES
30.1
MEDIAN AGE
3.7
AVG FAMILY SIZE
3.3
AVG HOUSEHOLD SIZE
37,297
LABOR FORCE [ PEOPLE ]
67.7%
PERCENT IN LABOR FORCE
5.8%
UNEMPLOYMENT RATE
Pasco Zip Codes
Pasco Area Codes
Income in Pasco
Income Overview in Pasco
Per Capita Income in Pasco is $30,242, while median incomes of families and households are $79,877 and $75,316 respectively.
| Characteristic | Number | Measure |
| Per Capita Income | 77,274 | $30,242 |
| Median Family Income | 18,178 | $79,877 |
| Mean Family Income | 18,178 | $99,908 |
| Median Household Income | 23,134 | $75,316 |
| Mean Household Income | 23,134 | $95,064 |
| Income Deficit | 18,178 | $12,044 |
| Wage / Income Gap (%) | 77,274 | 29.42% |
| Wage / Income Gap ($) | 77,274 | 70.58¢ per $1 |
| Gini / Inequality Index | 77,274 | 0.41 |
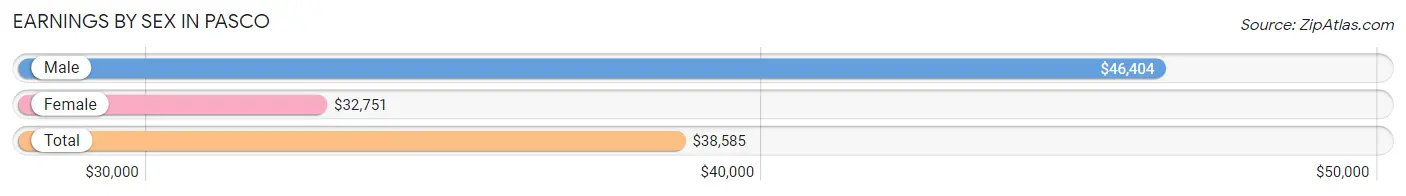
Earnings by Sex in Pasco
Average Earnings in Pasco are $38,585, $46,404 for men and $32,751 for women, a difference of 29.4%.
| Sex | Number | Average Earnings |
| Male | 20,877 (54.8%) | $46,404 |
| Female | 17,190 (45.2%) | $32,751 |
| Total | 38,067 (100.0%) | $38,585 |
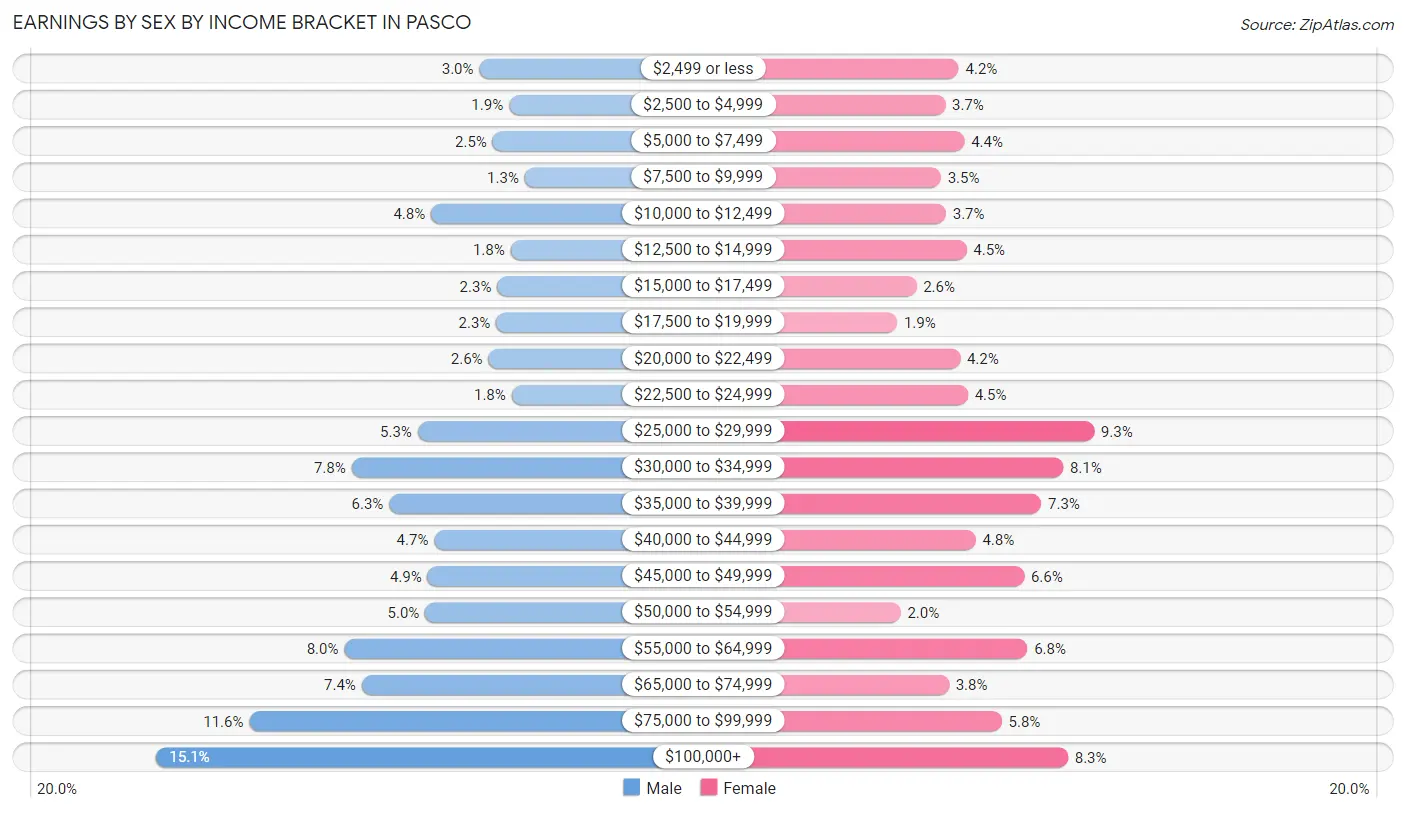
Earnings by Sex by Income Bracket in Pasco
The most common earnings brackets in Pasco are $100,000+ for men (3,144 | 15.1%) and $25,000 to $29,999 for women (1,591 | 9.3%).
| Income | Male | Female |
| $2,499 or less | 619 (3.0%) | 721 (4.2%) |
| $2,500 to $4,999 | 387 (1.8%) | 632 (3.7%) |
| $5,000 to $7,499 | 513 (2.5%) | 756 (4.4%) |
| $7,500 to $9,999 | 263 (1.3%) | 605 (3.5%) |
| $10,000 to $12,499 | 995 (4.8%) | 637 (3.7%) |
| $12,500 to $14,999 | 373 (1.8%) | 770 (4.5%) |
| $15,000 to $17,499 | 479 (2.3%) | 447 (2.6%) |
| $17,500 to $19,999 | 487 (2.3%) | 323 (1.9%) |
| $20,000 to $22,499 | 546 (2.6%) | 729 (4.2%) |
| $22,500 to $24,999 | 365 (1.8%) | 779 (4.5%) |
| $25,000 to $29,999 | 1,101 (5.3%) | 1,591 (9.3%) |
| $30,000 to $34,999 | 1,617 (7.7%) | 1,393 (8.1%) |
| $35,000 to $39,999 | 1,323 (6.3%) | 1,252 (7.3%) |
| $40,000 to $44,999 | 970 (4.6%) | 829 (4.8%) |
| $45,000 to $49,999 | 1,022 (4.9%) | 1,142 (6.6%) |
| $50,000 to $54,999 | 1,042 (5.0%) | 345 (2.0%) |
| $55,000 to $64,999 | 1,675 (8.0%) | 1,162 (6.8%) |
| $65,000 to $74,999 | 1,539 (7.4%) | 656 (3.8%) |
| $75,000 to $99,999 | 2,417 (11.6%) | 997 (5.8%) |
| $100,000+ | 3,144 (15.1%) | 1,424 (8.3%) |
| Total | 20,877 (100.0%) | 17,190 (100.0%) |
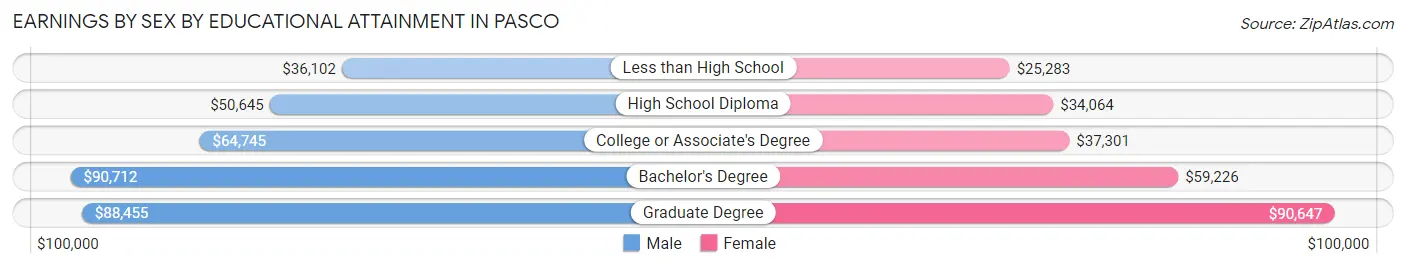
Earnings by Sex by Educational Attainment in Pasco
Average earnings in Pasco are $53,920 for men and $37,073 for women, a difference of 31.2%. Men with an educational attainment of bachelor's degree enjoy the highest average annual earnings of $90,712, while those with less than high school education earn the least with $36,102. Women with an educational attainment of graduate degree earn the most with the average annual earnings of $90,647, while those with less than high school education have the smallest earnings of $25,283.
| Educational Attainment | Male Income | Female Income |
| Less than High School | $36,102 | $25,283 |
| High School Diploma | $50,645 | $34,064 |
| College or Associate's Degree | $64,745 | $37,301 |
| Bachelor's Degree | $90,712 | $59,226 |
| Graduate Degree | $88,455 | $90,647 |
| Total | $53,920 | $37,073 |
Family Income in Pasco
Family Income Brackets in Pasco
According to the Pasco family income data, there are 3,399 families falling into the $50,000 to $74,999 income range, which is the most common income bracket and makes up 18.7% of all families. Conversely, the $10,000 to $14,999 income bracket is the least frequent group with only 309 families (1.7%) belonging to this category.
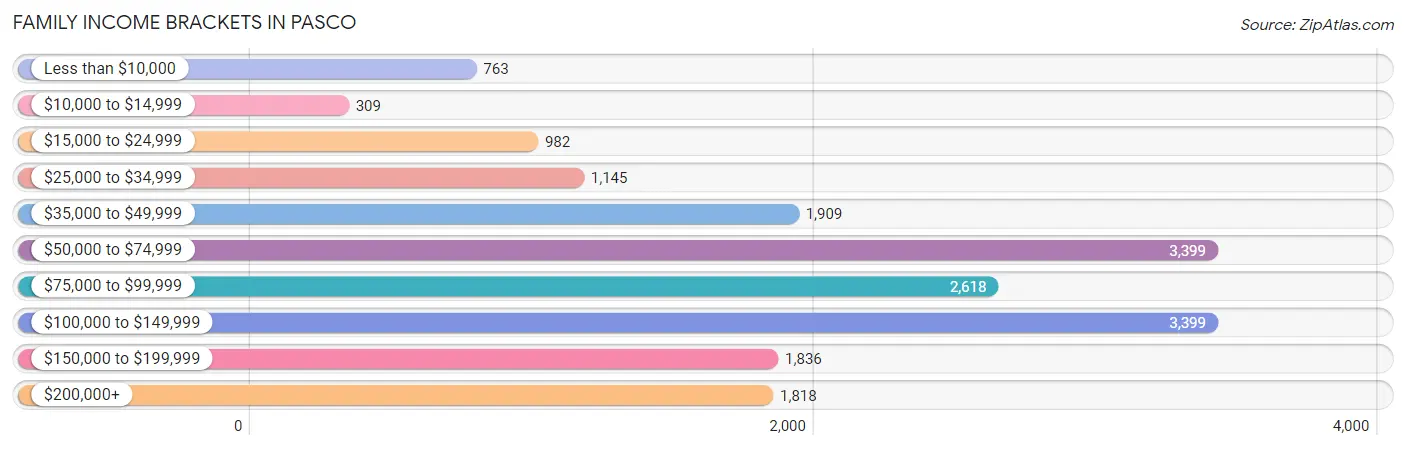
| Income Bracket | # Families | % Families |
| Less than $10,000 | 763 | 4.2% |
| $10,000 to $14,999 | 309 | 1.7% |
| $15,000 to $24,999 | 982 | 5.4% |
| $25,000 to $34,999 | 1,145 | 6.3% |
| $35,000 to $49,999 | 1,909 | 10.5% |
| $50,000 to $74,999 | 3,399 | 18.7% |
| $75,000 to $99,999 | 2,618 | 14.4% |
| $100,000 to $149,999 | 3,399 | 18.7% |
| $150,000 to $199,999 | 1,836 | 10.1% |
| $200,000+ | 1,818 | 10.0% |
Family Income by Famaliy Size in Pasco
7+ person families (489 | 2.7%) account for the highest median family income in Pasco with $123,438 per family, while 2-person families (6,600 | 36.3%) have the highest median income of $41,948 per family member.
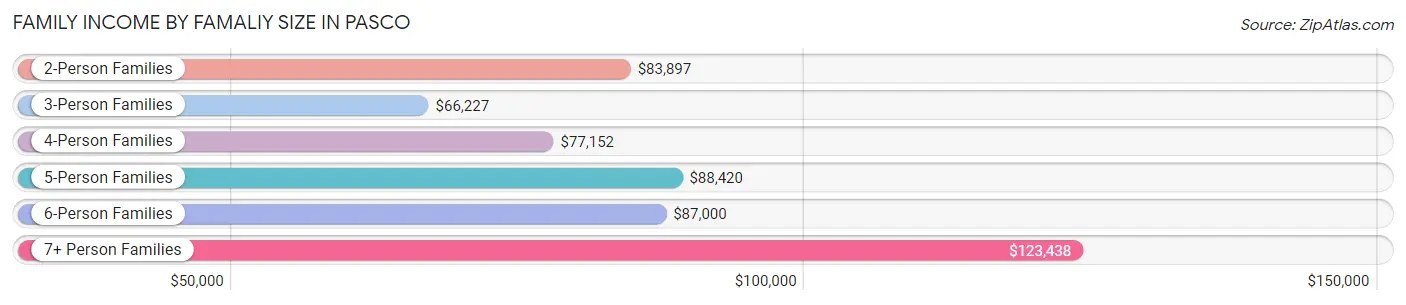
| Income Bracket | # Families | Median Income |
| 2-Person Families | 6,600 (36.3%) | $83,897 |
| 3-Person Families | 3,738 (20.6%) | $66,227 |
| 4-Person Families | 3,840 (21.1%) | $77,152 |
| 5-Person Families | 2,413 (13.3%) | $88,420 |
| 6-Person Families | 1,098 (6.0%) | $87,000 |
| 7+ Person Families | 489 (2.7%) | $123,438 |
| Total | 18,178 (100.0%) | $79,877 |
Family Income by Number of Earners in Pasco
The median family income in Pasco is $79,877, with families comprising 3+ earners (2,890) having the highest median family income of $133,333, while families with 1 earner (6,658) have the lowest median family income of $51,697, accounting for 15.9% and 36.6% of families, respectively.
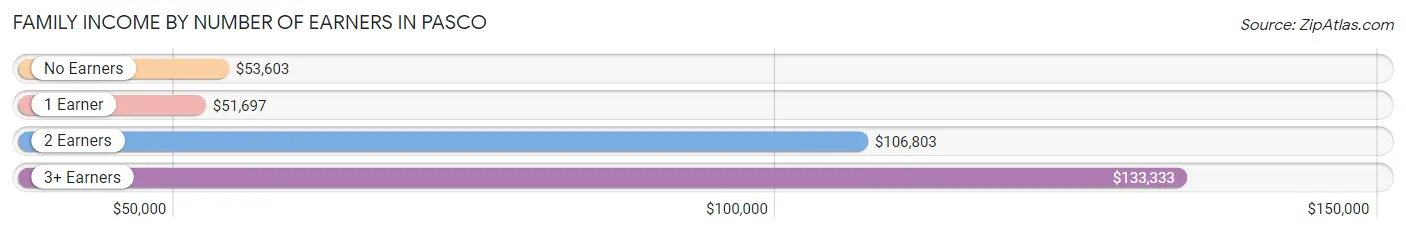
| Number of Earners | # Families | Median Income |
| No Earners | 1,969 (10.8%) | $53,603 |
| 1 Earner | 6,658 (36.6%) | $51,697 |
| 2 Earners | 6,661 (36.6%) | $106,803 |
| 3+ Earners | 2,890 (15.9%) | $133,333 |
| Total | 18,178 (100.0%) | $79,877 |
Household Income in Pasco
Household Income Brackets in Pasco
With 4,488 households falling in the category, the $50,000 to $74,999 income range is the most frequent in Pasco, accounting for 19.4% of all households. In contrast, only 601 households (2.6%) fall into the $10,000 to $14,999 income bracket, making it the least populous group.
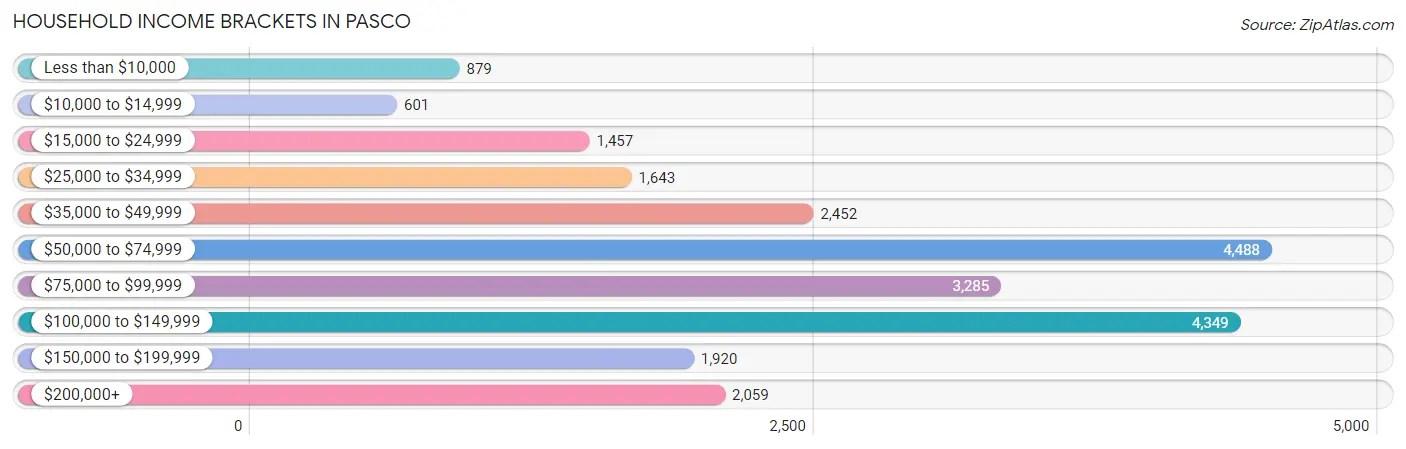
| Income Bracket | # Households | % Households |
| Less than $10,000 | 879 | 3.8% |
| $10,000 to $14,999 | 601 | 2.6% |
| $15,000 to $24,999 | 1,457 | 6.3% |
| $25,000 to $34,999 | 1,643 | 7.1% |
| $35,000 to $49,999 | 2,452 | 10.6% |
| $50,000 to $74,999 | 4,488 | 19.4% |
| $75,000 to $99,999 | 3,285 | 14.2% |
| $100,000 to $149,999 | 4,349 | 18.8% |
| $150,000 to $199,999 | 1,920 | 8.3% |
| $200,000+ | 2,059 | 8.9% |
Household Income by Householder Age in Pasco
The median household income in Pasco is $75,316, with the highest median household income of $89,922 found in the 45 to 64 years age bracket for the primary householder. A total of 7,209 households (31.2%) fall into this category. Meanwhile, the 65+ years age bracket for the primary householder has the lowest median household income of $61,263, with 4,324 households (18.7%) in this group.
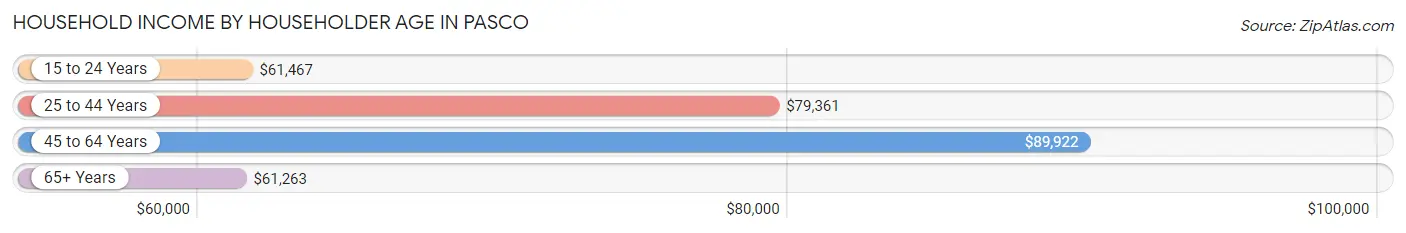
| Income Bracket | # Households | Median Income |
| 15 to 24 Years | 1,061 (4.6%) | $61,467 |
| 25 to 44 Years | 10,540 (45.6%) | $79,361 |
| 45 to 64 Years | 7,209 (31.2%) | $89,922 |
| 65+ Years | 4,324 (18.7%) | $61,263 |
| Total | 23,134 (100.0%) | $75,316 |
Poverty in Pasco
Income Below Poverty by Sex and Age in Pasco
With 11.8% poverty level for males and 14.4% for females among the residents of Pasco, 5 year old males and 25 to 34 year old females are the most vulnerable to poverty, with 382 males (40.0%) and 1,049 females (18.1%) in their respective age groups living below the poverty level.
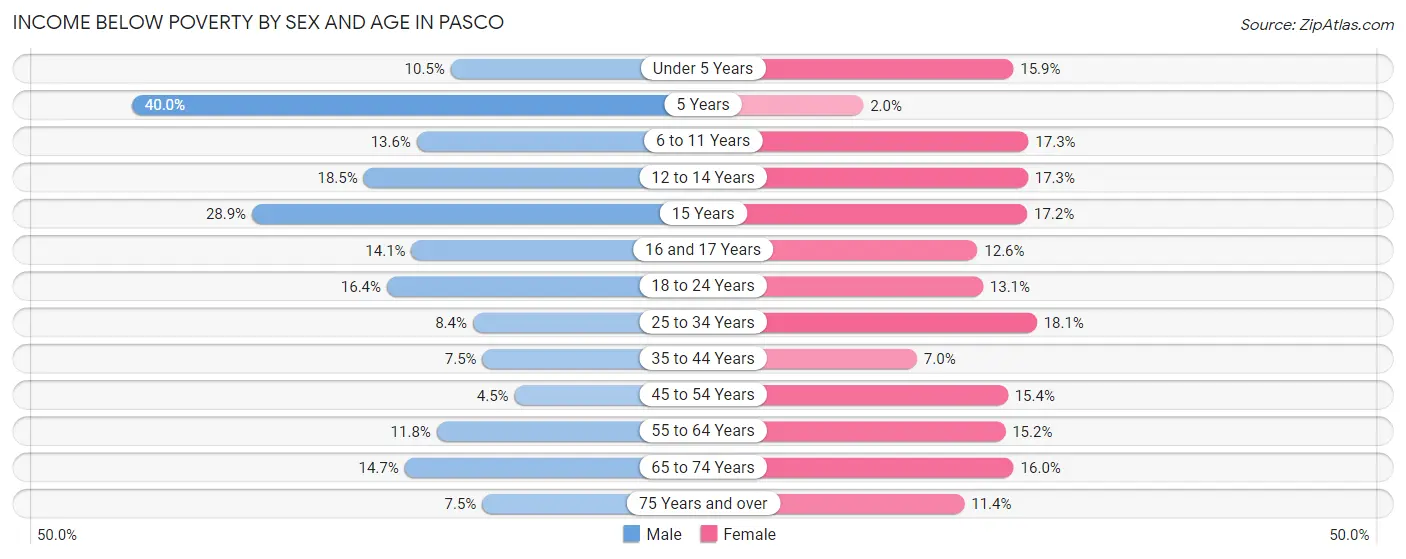
| Age Bracket | Male | Female |
| Under 5 Years | 349 (10.5%) | 480 (15.9%) |
| 5 Years | 382 (40.0%) | 11 (2.0%) |
| 6 to 11 Years | 517 (13.6%) | 747 (17.3%) |
| 12 to 14 Years | 385 (18.5%) | 394 (17.3%) |
| 15 Years | 137 (28.9%) | 115 (17.2%) |
| 16 and 17 Years | 222 (14.1%) | 174 (12.6%) |
| 18 to 24 Years | 630 (16.4%) | 504 (13.1%) |
| 25 to 34 Years | 524 (8.4%) | 1,049 (18.1%) |
| 35 to 44 Years | 412 (7.5%) | 344 (7.0%) |
| 45 to 54 Years | 185 (4.5%) | 632 (15.4%) |
| 55 to 64 Years | 369 (11.8%) | 472 (15.2%) |
| 65 to 74 Years | 342 (14.7%) | 376 (16.0%) |
| 75 Years and over | 80 (7.5%) | 164 (11.4%) |
| Total | 4,534 (11.8%) | 5,462 (14.4%) |
Income Above Poverty by Sex and Age in Pasco
According to the poverty statistics in Pasco, males aged 45 to 54 years and females aged 5 years are the age groups that are most secure financially, with 95.5% of males and 98.0% of females in these age groups living above the poverty line.
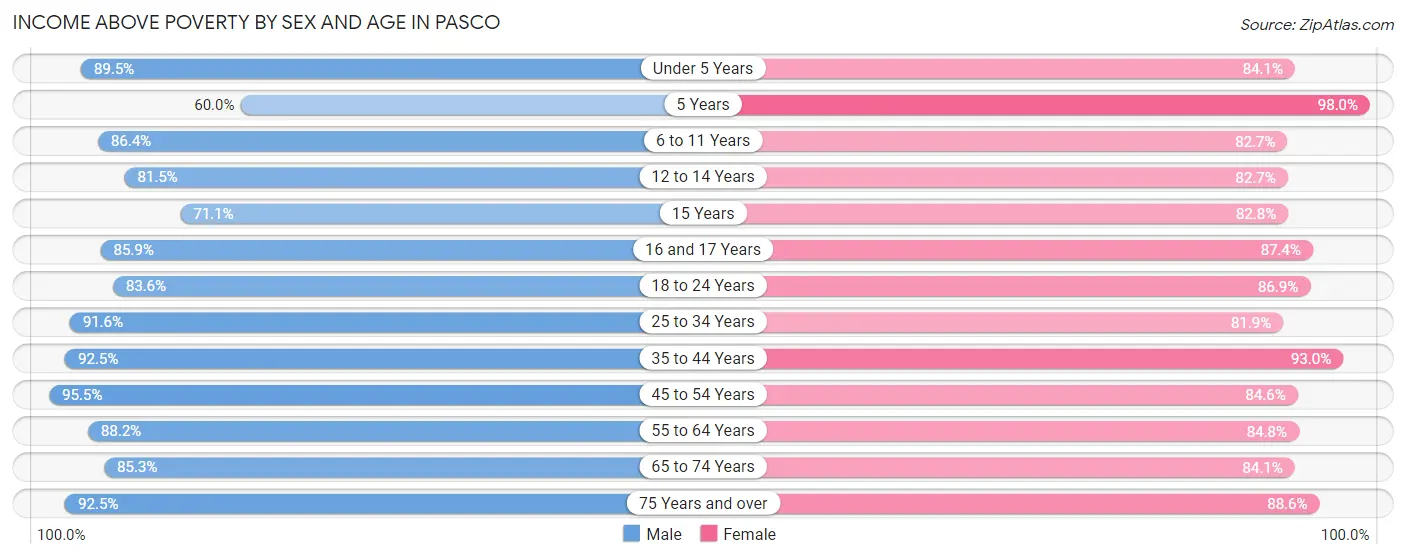
| Age Bracket | Male | Female |
| Under 5 Years | 2,989 (89.5%) | 2,535 (84.1%) |
| 5 Years | 572 (60.0%) | 542 (98.0%) |
| 6 to 11 Years | 3,282 (86.4%) | 3,566 (82.7%) |
| 12 to 14 Years | 1,692 (81.5%) | 1,889 (82.7%) |
| 15 Years | 337 (71.1%) | 554 (82.8%) |
| 16 and 17 Years | 1,353 (85.9%) | 1,209 (87.4%) |
| 18 to 24 Years | 3,217 (83.6%) | 3,345 (86.9%) |
| 25 to 34 Years | 5,711 (91.6%) | 4,750 (81.9%) |
| 35 to 44 Years | 5,077 (92.5%) | 4,590 (93.0%) |
| 45 to 54 Years | 3,889 (95.5%) | 3,473 (84.6%) |
| 55 to 64 Years | 2,769 (88.2%) | 2,640 (84.8%) |
| 65 to 74 Years | 1,978 (85.3%) | 1,981 (84.1%) |
| 75 Years and over | 982 (92.5%) | 1,278 (88.6%) |
| Total | 33,848 (88.2%) | 32,352 (85.6%) |
Income Below Poverty Among Married-Couple Families in Pasco
The poverty statistics for married-couple families in Pasco show that 5.4% or 649 of the total 11,925 families live below the poverty line. Families with 3 or 4 children have the highest poverty rate of 14.3%, comprising of 268 families. On the other hand, families with 5 or more children have the lowest poverty rate of 2.3%, which includes 4 families.
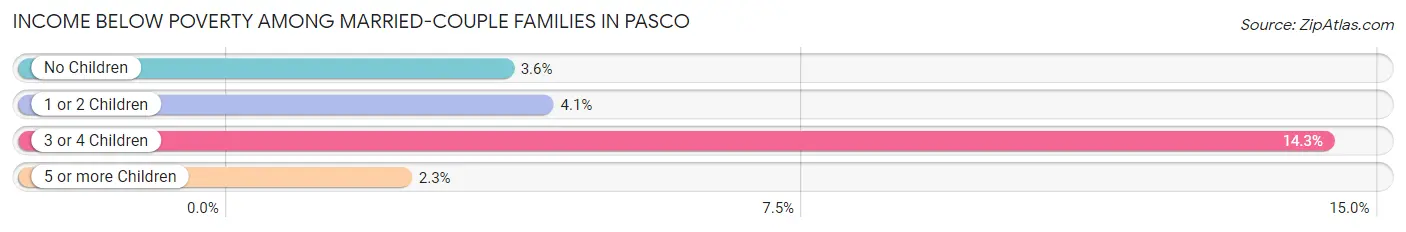
| Children | Above Poverty | Below Poverty |
| No Children | 5,541 (96.4%) | 207 (3.6%) |
| 1 or 2 Children | 3,959 (95.9%) | 170 (4.1%) |
| 3 or 4 Children | 1,604 (85.7%) | 268 (14.3%) |
| 5 or more Children | 172 (97.7%) | 4 (2.3%) |
| Total | 11,276 (94.6%) | 649 (5.4%) |
Income Below Poverty Among Single-Parent Households in Pasco
According to the poverty data in Pasco, 4.3% or 75 single-father households and 25.9% or 1,172 single-mother households are living below the poverty line. Among single-father households, those with no children have the highest poverty rate, with 49 households (12.8%) experiencing poverty. Likewise, among single-mother households, those with 5 or more children have the highest poverty rate, with 60 households (74.1%) falling below the poverty line.
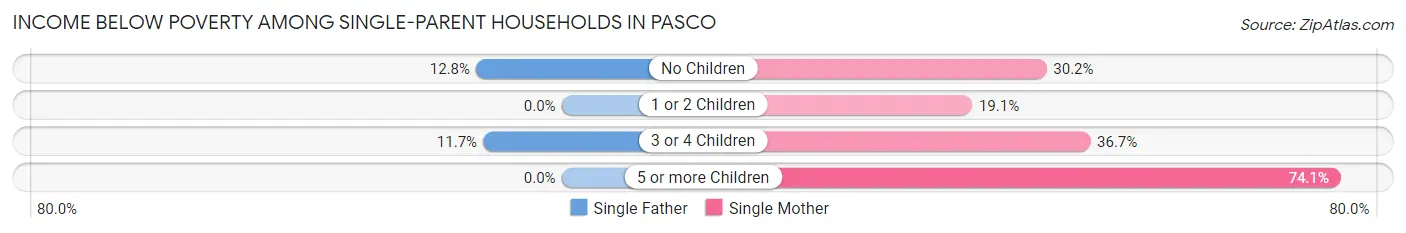
| Children | Single Father | Single Mother |
| No Children | 49 (12.8%) | 276 (30.2%) |
| 1 or 2 Children | 0 (0.0%) | 500 (19.1%) |
| 3 or 4 Children | 26 (11.7%) | 336 (36.7%) |
| 5 or more Children | 0 (0.0%) | 60 (74.1%) |
| Total | 75 (4.3%) | 1,172 (25.9%) |
Income Below Poverty Among Married-Couple vs Single-Parent Households in Pasco
The poverty data for Pasco shows that 649 of the married-couple family households (5.4%) and 1,247 of the single-parent households (19.9%) are living below the poverty level. Within the married-couple family households, those with 3 or 4 children have the highest poverty rate, with 268 households (14.3%) falling below the poverty line. Among the single-parent households, those with 5 or more children have the highest poverty rate, with 60 household (42.5%) living below poverty.
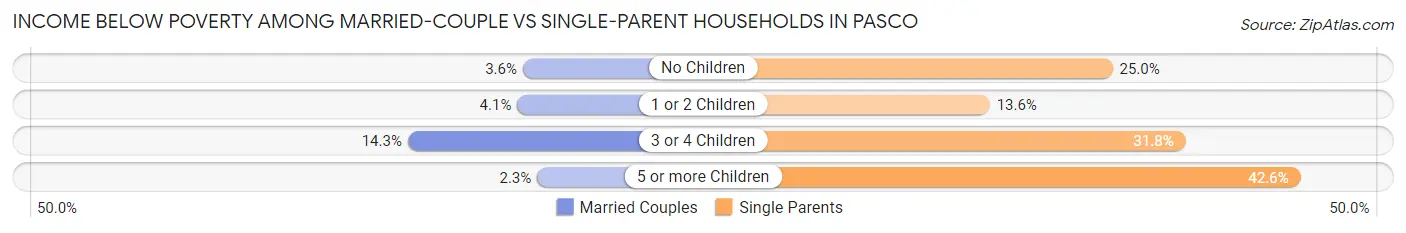
| Children | Married-Couple Families | Single-Parent Households |
| No Children | 207 (3.6%) | 325 (25.0%) |
| 1 or 2 Children | 170 (4.1%) | 500 (13.6%) |
| 3 or 4 Children | 268 (14.3%) | 362 (31.8%) |
| 5 or more Children | 4 (2.3%) | 60 (42.5%) |
| Total | 649 (5.4%) | 1,247 (19.9%) |
Race in Pasco
The most populous races in Pasco are Hispanic or Latino (42,938 | 55.6%), White / Caucasian (42,307 | 54.7%), and Some other Race (16,176 | 20.9%).
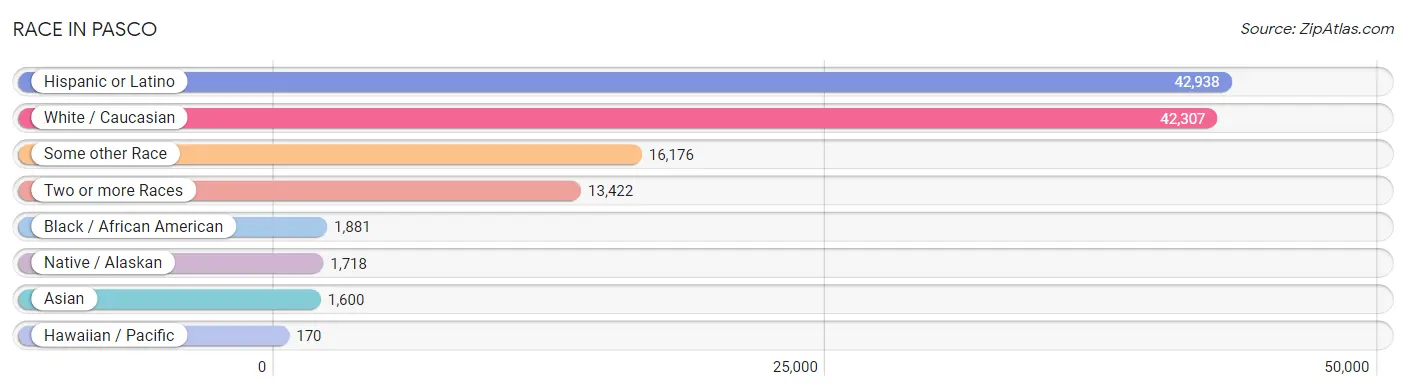
| Race | # Population | % Population |
| Asian | 1,600 | 2.1% |
| Black / African American | 1,881 | 2.4% |
| Hawaiian / Pacific | 170 | 0.2% |
| Hispanic or Latino | 42,938 | 55.6% |
| Native / Alaskan | 1,718 | 2.2% |
| White / Caucasian | 42,307 | 54.7% |
| Two or more Races | 13,422 | 17.4% |
| Some other Race | 16,176 | 20.9% |
| Total | 77,274 | 100.0% |
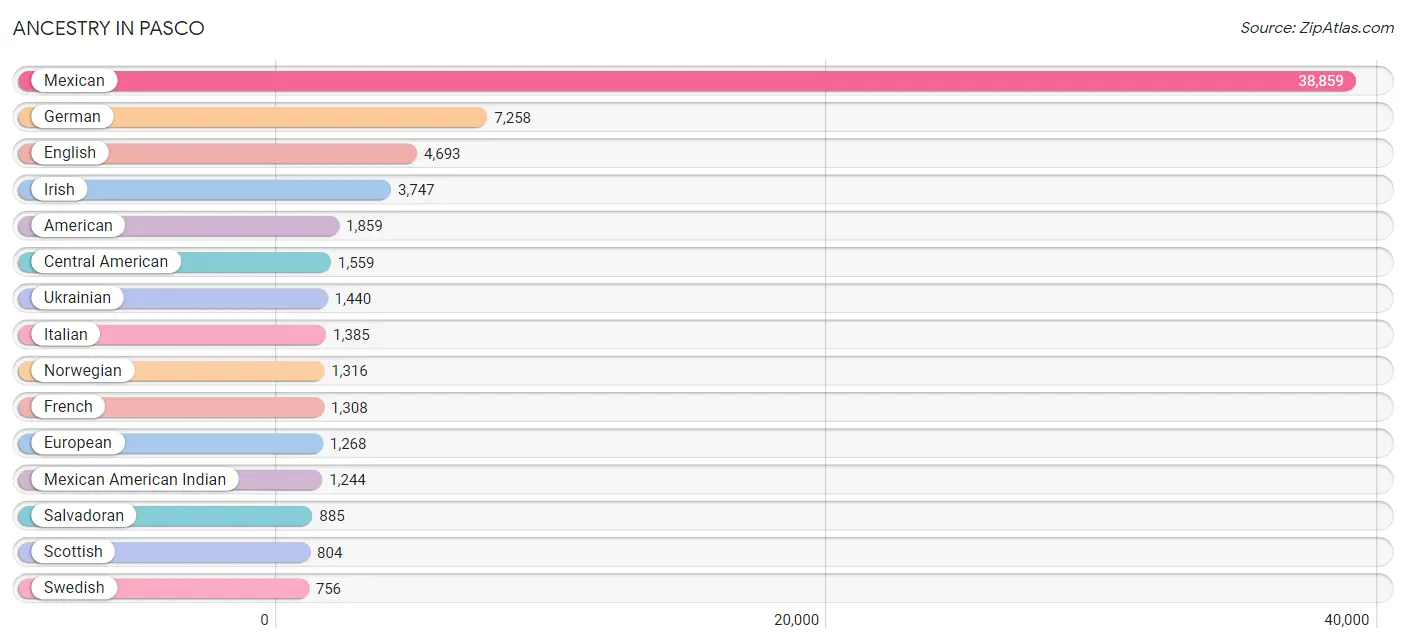
Ancestry in Pasco
The most populous ancestries reported in Pasco are Mexican (38,859 | 50.3%), German (7,258 | 9.4%), English (4,693 | 6.1%), Irish (3,747 | 4.9%), and American (1,859 | 2.4%), together accounting for 73.0% of all Pasco residents.
| Ancestry | # Population | % Population |
| African | 22 | 0.0% |
| Alaska Native | 14 | 0.0% |
| American | 1,859 | 2.4% |
| Apache | 4 | 0.0% |
| Arab | 103 | 0.1% |
| Australian | 16 | 0.0% |
| Austrian | 446 | 0.6% |
| Basque | 25 | 0.0% |
| Bhutanese | 127 | 0.2% |
| Blackfeet | 85 | 0.1% |
| Brazilian | 12 | 0.0% |
| British | 324 | 0.4% |
| Burmese | 364 | 0.5% |
| Canadian | 80 | 0.1% |
| Celtic | 11 | 0.0% |
| Central American | 1,559 | 2.0% |
| Central American Indian | 73 | 0.1% |
| Cherokee | 167 | 0.2% |
| Chilean | 147 | 0.2% |
| Chippewa | 23 | 0.0% |
| Choctaw | 9 | 0.0% |
| Colombian | 25 | 0.0% |
| Colville | 11 | 0.0% |
| Creek | 45 | 0.1% |
| Cuban | 144 | 0.2% |
| Czech | 235 | 0.3% |
| Czechoslovakian | 57 | 0.1% |
| Danish | 220 | 0.3% |
| Dominican | 5 | 0.0% |
| Dutch | 549 | 0.7% |
| Eastern European | 40 | 0.1% |
| Egyptian | 70 | 0.1% |
| English | 4,693 | 6.1% |
| European | 1,268 | 1.6% |
| Fijian | 24 | 0.0% |
| Finnish | 147 | 0.2% |
| French | 1,308 | 1.7% |
| French Canadian | 541 | 0.7% |
| German | 7,258 | 9.4% |
| Greek | 41 | 0.1% |
| Guamanian / Chamorro | 68 | 0.1% |
| Guatemalan | 573 | 0.7% |
| Honduran | 74 | 0.1% |
| Indian (Asian) | 494 | 0.6% |
| Indonesian | 642 | 0.8% |
| Inupiat | 30 | 0.0% |
| Iraqi | 12 | 0.0% |
| Irish | 3,747 | 4.9% |
| Iroquois | 224 | 0.3% |
| Italian | 1,385 | 1.8% |
| Japanese | 9 | 0.0% |
| Kenyan | 117 | 0.2% |
| Korean | 570 | 0.7% |
| Laotian | 11 | 0.0% |
| Lebanese | 21 | 0.0% |
| Lithuanian | 43 | 0.1% |
| Malaysian | 26 | 0.0% |
| Marshallese | 10 | 0.0% |
| Mexican | 38,859 | 50.3% |
| Mexican American Indian | 1,244 | 1.6% |
| Native Hawaiian | 258 | 0.3% |
| New Zealander | 16 | 0.0% |
| Nicaraguan | 27 | 0.0% |
| Nigerian | 29 | 0.0% |
| Northern European | 58 | 0.1% |
| Norwegian | 1,316 | 1.7% |
| Pakistani | 38 | 0.1% |
| Pennsylvania German | 32 | 0.0% |
| Peruvian | 21 | 0.0% |
| Polish | 296 | 0.4% |
| Portuguese | 129 | 0.2% |
| Potawatomi | 19 | 0.0% |
| Puerto Rican | 127 | 0.2% |
| Puget Sound Salish | 99 | 0.1% |
| Romanian | 86 | 0.1% |
| Russian | 296 | 0.4% |
| Salvadoran | 885 | 1.1% |
| Samoan | 20 | 0.0% |
| Scandinavian | 326 | 0.4% |
| Scotch-Irish | 397 | 0.5% |
| Scottish | 804 | 1.0% |
| Sioux | 39 | 0.1% |
| Slovak | 45 | 0.1% |
| Slovene | 23 | 0.0% |
| South African | 16 | 0.0% |
| South American | 193 | 0.3% |
| Spaniard | 412 | 0.5% |
| Spanish | 662 | 0.9% |
| Spanish American | 9 | 0.0% |
| Sri Lankan | 454 | 0.6% |
| Subsaharan African | 184 | 0.2% |
| Swedish | 756 | 1.0% |
| Swiss | 51 | 0.1% |
| Thai | 63 | 0.1% |
| Tsimshian | 9 | 0.0% |
| Turkish | 15 | 0.0% |
| Ukrainian | 1,440 | 1.9% |
| Welsh | 449 | 0.6% |
| Yaqui | 1 | 0.0% |
| Yugoslavian | 91 | 0.1% | View All 100 Rows |
Immigrants in Pasco
The most numerous immigrant groups reported in Pasco came from Latin America (14,257 | 18.4%), Central America (14,139 | 18.3%), Mexico (12,923 | 16.7%), Europe (1,338 | 1.7%), and Eastern Europe (1,113 | 1.4%), together accounting for 56.6% of all Pasco residents.
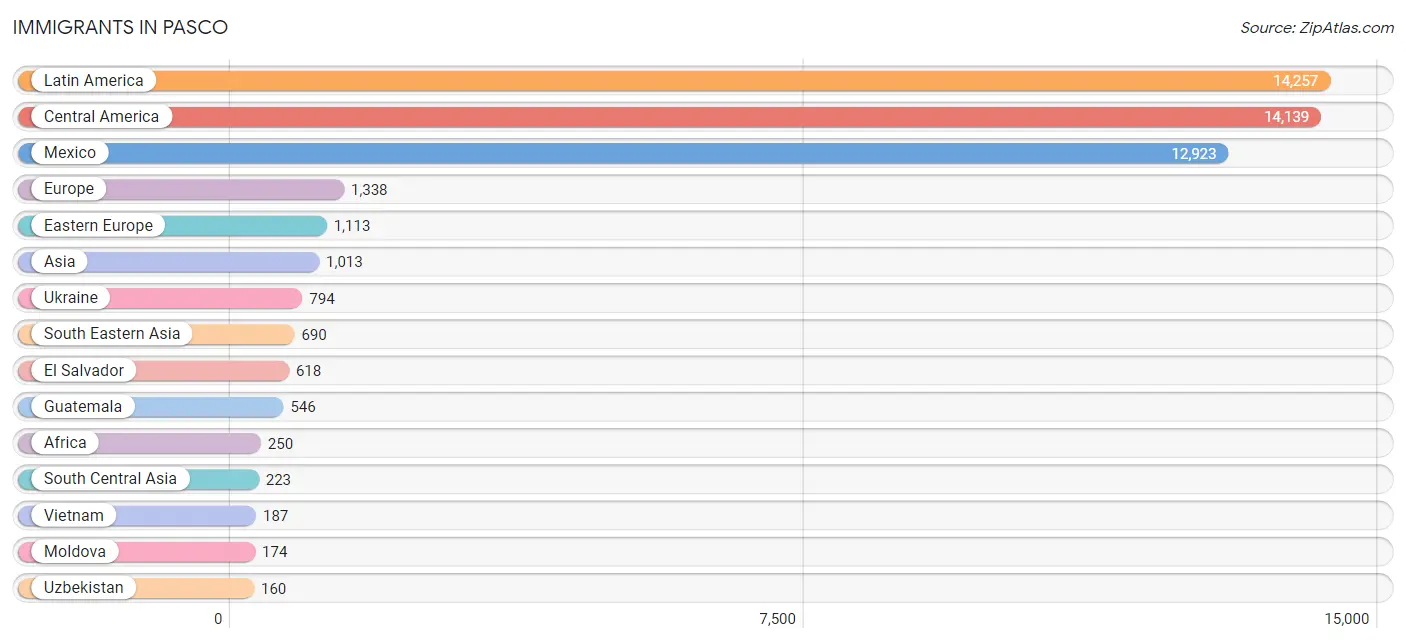
| Immigration Origin | # Population | % Population |
| Africa | 250 | 0.3% |
| Asia | 1,013 | 1.3% |
| Australia | 9 | 0.0% |
| Austria | 63 | 0.1% |
| Bosnia and Herzegovina | 46 | 0.1% |
| Cameroon | 51 | 0.1% |
| Canada | 132 | 0.2% |
| Caribbean | 72 | 0.1% |
| Central America | 14,139 | 18.3% |
| China | 12 | 0.0% |
| Colombia | 25 | 0.0% |
| Cuba | 67 | 0.1% |
| Dominican Republic | 5 | 0.0% |
| Eastern Africa | 117 | 0.2% |
| Eastern Asia | 79 | 0.1% |
| Eastern Europe | 1,113 | 1.4% |
| Egypt | 23 | 0.0% |
| El Salvador | 618 | 0.8% |
| England | 15 | 0.0% |
| Europe | 1,338 | 1.7% |
| Germany | 73 | 0.1% |
| Guatemala | 546 | 0.7% |
| Honduras | 25 | 0.0% |
| India | 16 | 0.0% |
| Ireland | 4 | 0.0% |
| Kazakhstan | 17 | 0.0% |
| Kenya | 117 | 0.2% |
| Korea | 67 | 0.1% |
| Laos | 39 | 0.1% |
| Latin America | 14,257 | 18.4% |
| Lebanon | 21 | 0.0% |
| Mexico | 12,923 | 16.7% |
| Micronesia | 10 | 0.0% |
| Middle Africa | 51 | 0.1% |
| Moldova | 174 | 0.2% |
| Nicaragua | 27 | 0.0% |
| Nigeria | 43 | 0.1% |
| Northern Africa | 23 | 0.0% |
| Northern Europe | 24 | 0.0% |
| Oceania | 34 | 0.0% |
| Pakistan | 12 | 0.0% |
| Peru | 21 | 0.0% |
| Philippines | 154 | 0.2% |
| Russia | 99 | 0.1% |
| South Africa | 16 | 0.0% |
| South America | 46 | 0.1% |
| South Central Asia | 223 | 0.3% |
| South Eastern Asia | 690 | 0.9% |
| Southern Europe | 65 | 0.1% |
| Spain | 65 | 0.1% |
| Thailand | 123 | 0.2% |
| Ukraine | 794 | 1.0% |
| Uzbekistan | 160 | 0.2% |
| Vietnam | 187 | 0.2% |
| Western Africa | 43 | 0.1% |
| Western Asia | 21 | 0.0% |
| Western Europe | 136 | 0.2% | View All 57 Rows |
Sex and Age in Pasco
Sex and Age in Pasco
The most populous age groups in Pasco are 10 to 14 Years (3,852 | 9.9%) for men and 10 to 14 Years (4,107 | 10.8%) for women.
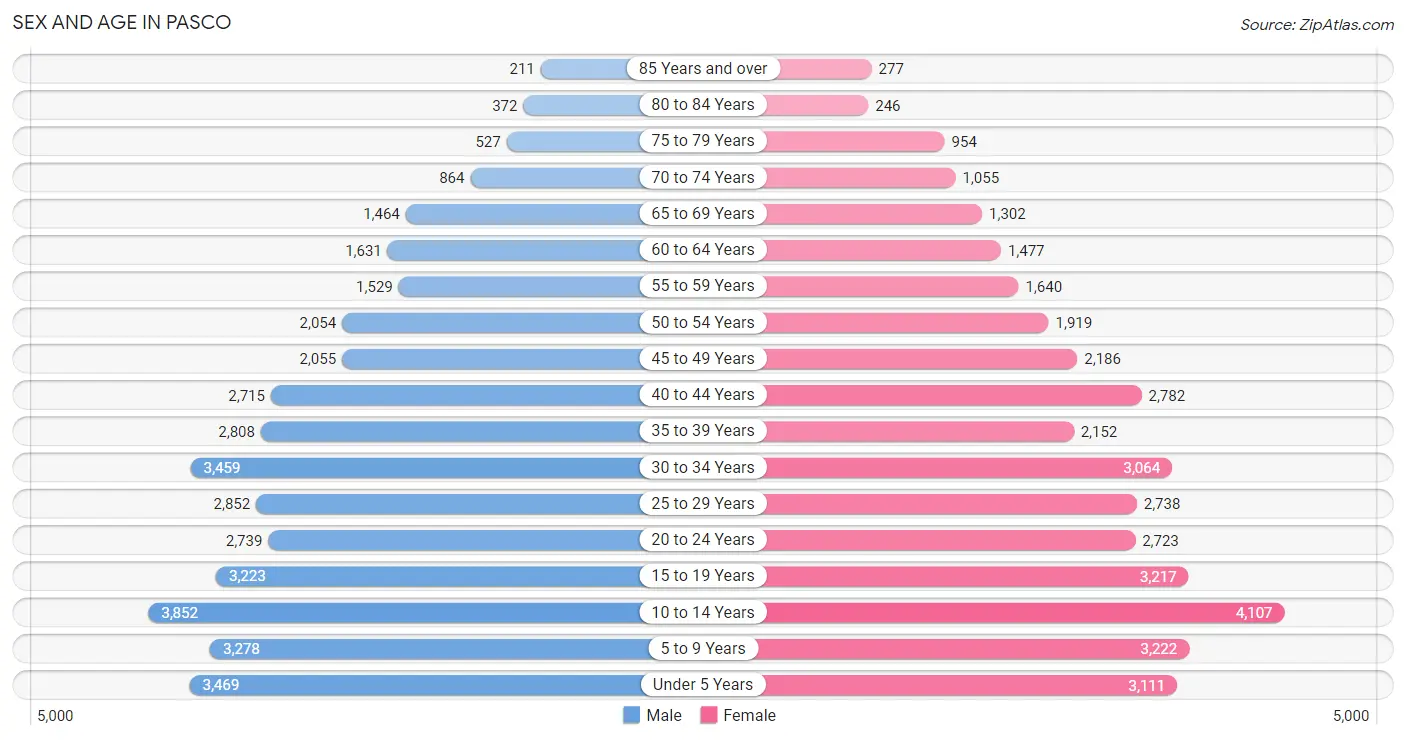
| Age Bracket | Male | Female |
| Under 5 Years | 3,469 (8.9%) | 3,111 (8.2%) |
| 5 to 9 Years | 3,278 (8.4%) | 3,222 (8.4%) |
| 10 to 14 Years | 3,852 (9.9%) | 4,107 (10.8%) |
| 15 to 19 Years | 3,223 (8.2%) | 3,217 (8.4%) |
| 20 to 24 Years | 2,739 (7.0%) | 2,723 (7.1%) |
| 25 to 29 Years | 2,852 (7.3%) | 2,738 (7.2%) |
| 30 to 34 Years | 3,459 (8.8%) | 3,064 (8.0%) |
| 35 to 39 Years | 2,808 (7.2%) | 2,152 (5.6%) |
| 40 to 44 Years | 2,715 (6.9%) | 2,782 (7.3%) |
| 45 to 49 Years | 2,055 (5.3%) | 2,186 (5.7%) |
| 50 to 54 Years | 2,054 (5.2%) | 1,919 (5.0%) |
| 55 to 59 Years | 1,529 (3.9%) | 1,640 (4.3%) |
| 60 to 64 Years | 1,631 (4.2%) | 1,477 (3.9%) |
| 65 to 69 Years | 1,464 (3.7%) | 1,302 (3.4%) |
| 70 to 74 Years | 864 (2.2%) | 1,055 (2.8%) |
| 75 to 79 Years | 527 (1.3%) | 954 (2.5%) |
| 80 to 84 Years | 372 (0.9%) | 246 (0.6%) |
| 85 Years and over | 211 (0.5%) | 277 (0.7%) |
| Total | 39,102 (100.0%) | 38,172 (100.0%) |
Families and Households in Pasco
Median Family Size in Pasco
The median family size in Pasco is 3.67 persons per family, with single female/mother families (4,525 | 24.9%) accounting for the largest median family size of 3.77 persons per family. On the other hand, single male/father families (1,728 | 9.5%) represent the smallest median family size with 3.50 persons per family.
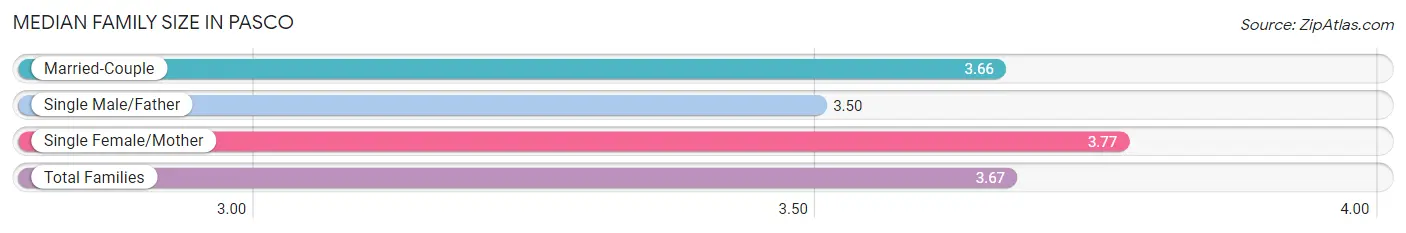
| Family Type | # Families | Family Size |
| Married-Couple | 11,925 (65.6%) | 3.66 |
| Single Male/Father | 1,728 (9.5%) | 3.50 |
| Single Female/Mother | 4,525 (24.9%) | 3.77 |
| Total Families | 18,178 (100.0%) | 3.67 |
Median Household Size in Pasco
The median household size in Pasco is 3.32 persons per household, with single female/mother households (4,525 | 19.6%) accounting for the largest median household size of 4.19 persons per household. non-family households (4,956 | 21.4%) represent the smallest median household size with 1.31 persons per household.
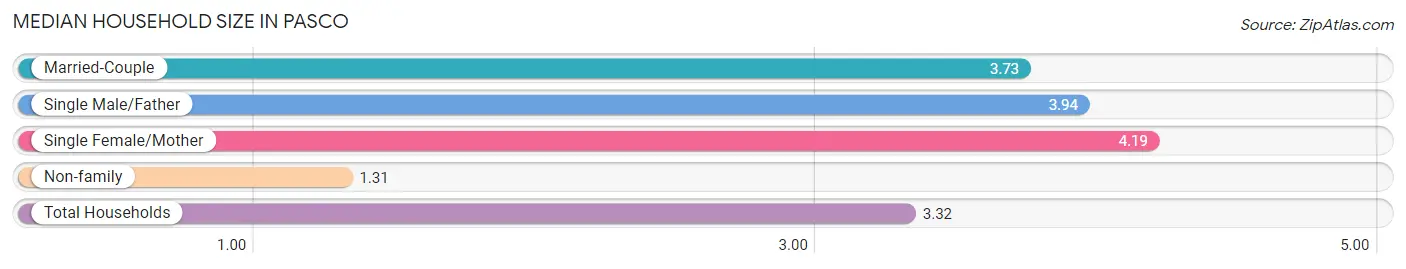
| Household Type | # Households | Household Size |
| Married-Couple | 11,925 (51.5%) | 3.73 |
| Single Male/Father | 1,728 (7.5%) | 3.94 |
| Single Female/Mother | 4,525 (19.6%) | 4.19 |
| Non-family | 4,956 (21.4%) | 1.31 |
| Total Households | 23,134 (100.0%) | 3.32 |
Household Size by Marriage Status in Pasco
Out of a total of 23,134 households in Pasco, 18,178 (78.6%) are family households, while 4,956 (21.4%) are nonfamily households. The most numerous type of family households are 2-person households, comprising 5,822, and the most common type of nonfamily households are 1-person households, comprising 3,859.
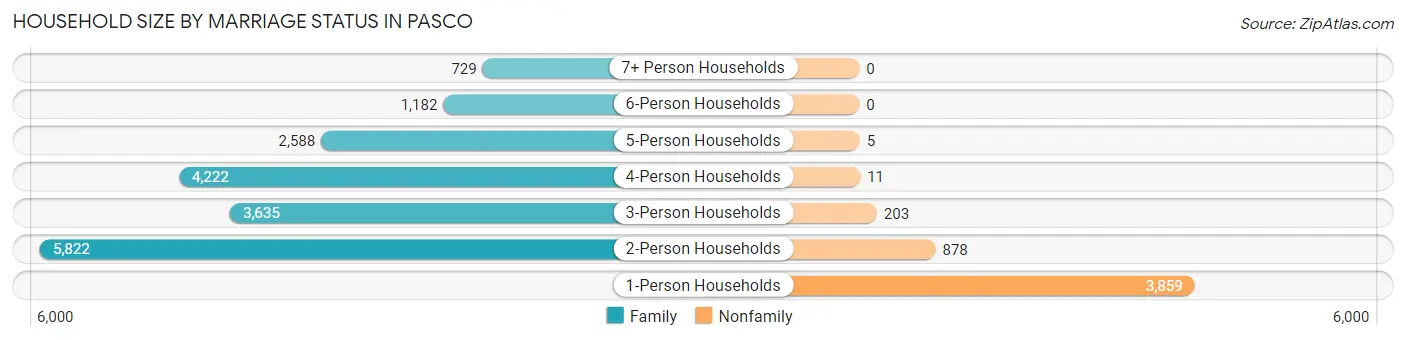
| Household Size | Family Households | Nonfamily Households |
| 1-Person Households | - | 3,859 (16.7%) |
| 2-Person Households | 5,822 (25.2%) | 878 (3.8%) |
| 3-Person Households | 3,635 (15.7%) | 203 (0.9%) |
| 4-Person Households | 4,222 (18.2%) | 11 (0.1%) |
| 5-Person Households | 2,588 (11.2%) | 5 (0.0%) |
| 6-Person Households | 1,182 (5.1%) | 0 (0.0%) |
| 7+ Person Households | 729 (3.2%) | 0 (0.0%) |
| Total | 18,178 (78.6%) | 4,956 (21.4%) |
Female Fertility in Pasco
Fertility by Age in Pasco
Average fertility rate in Pasco is 87.0 births per 1,000 women. Women in the age bracket of 20 to 34 years have the highest fertility rate with 168.0 births per 1,000 women. Women in the age bracket of 20 to 34 years acount for 86.3% of all women with births.
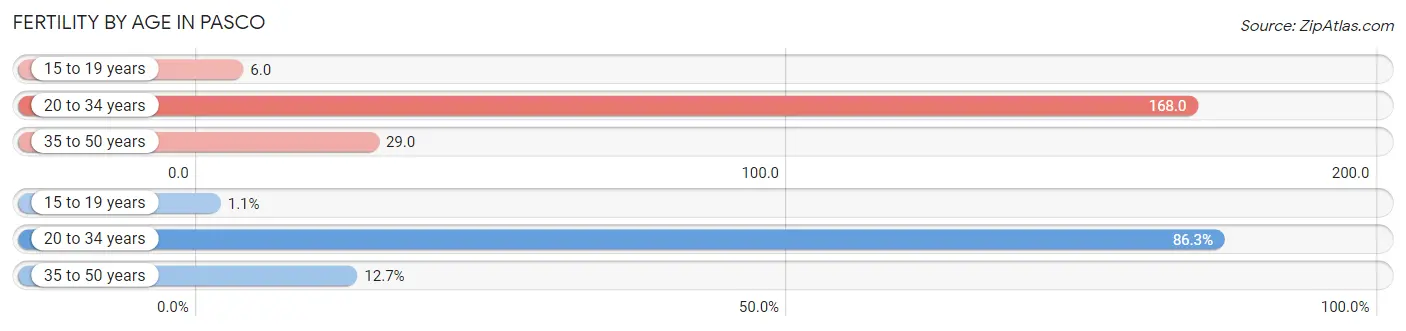
| Age Bracket | Women with Births | Births / 1,000 Women |
| 15 to 19 years | 18 (1.1%) | 6.0 |
| 20 to 34 years | 1,436 (86.3%) | 168.0 |
| 35 to 50 years | 211 (12.7%) | 29.0 |
| Total | 1,665 (100.0%) | 87.0 |
Fertility by Age by Marriage Status in Pasco
69.0% of women with births (1,665) in Pasco are married. The highest percentage of unmarried women with births falls into 15 to 19 years age bracket with 100.0% of them unmarried at the time of birth, while the lowest percentage of unmarried women with births belong to 35 to 50 years age bracket with 13.7% of them unmarried.
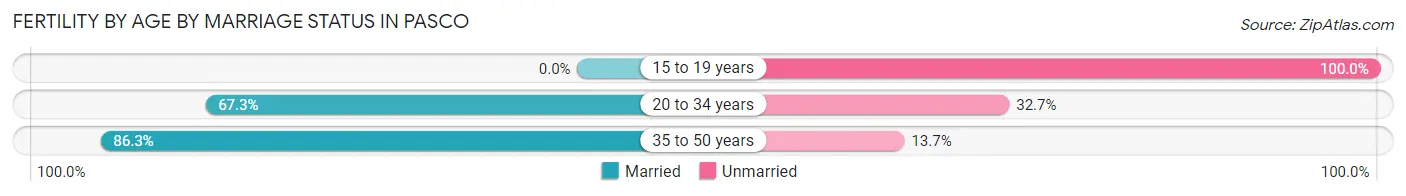
| Age Bracket | Married | Unmarried |
| 15 to 19 years | 0 (0.0%) | 18 (100.0%) |
| 20 to 34 years | 966 (67.3%) | 470 (32.7%) |
| 35 to 50 years | 182 (86.3%) | 29 (13.7%) |
| Total | 1,149 (69.0%) | 516 (31.0%) |
Fertility by Education in Pasco
Average fertility rate in Pasco is 87.0 births per 1,000 women. Women with the education attainment of graduate degree have the highest fertility rate of 195.0 births per 1,000 women, while women with the education attainment of less than high school have the lowest fertility at 51.0 births per 1,000 women. Women with the education attainment of high school diploma represent 36.5% of all women with births.
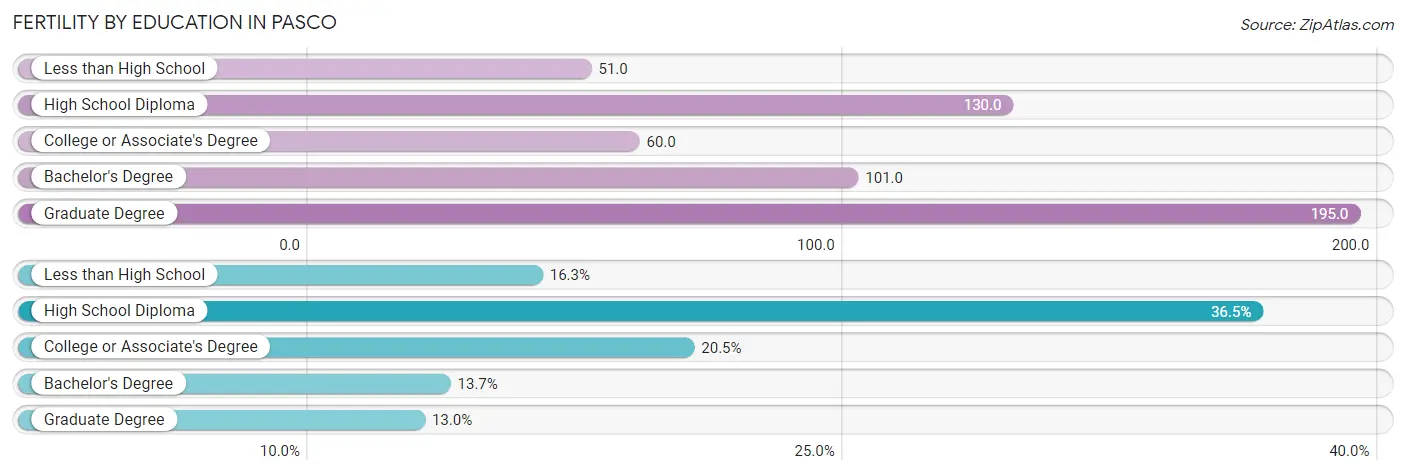
| Educational Attainment | Women with Births | Births / 1,000 Women |
| Less than High School | 271 (16.3%) | 51.0 |
| High School Diploma | 608 (36.5%) | 130.0 |
| College or Associate's Degree | 342 (20.5%) | 60.0 |
| Bachelor's Degree | 228 (13.7%) | 101.0 |
| Graduate Degree | 216 (13.0%) | 195.0 |
| Total | 1,665 (100.0%) | 87.0 |
Fertility by Education by Marriage Status in Pasco
31.0% of women with births in Pasco are unmarried. Women with the educational attainment of graduate degree are most likely to be married with 100.0% of them married at childbirth, while women with the educational attainment of less than high school are least likely to be married with 54.6% of them unmarried at childbirth.
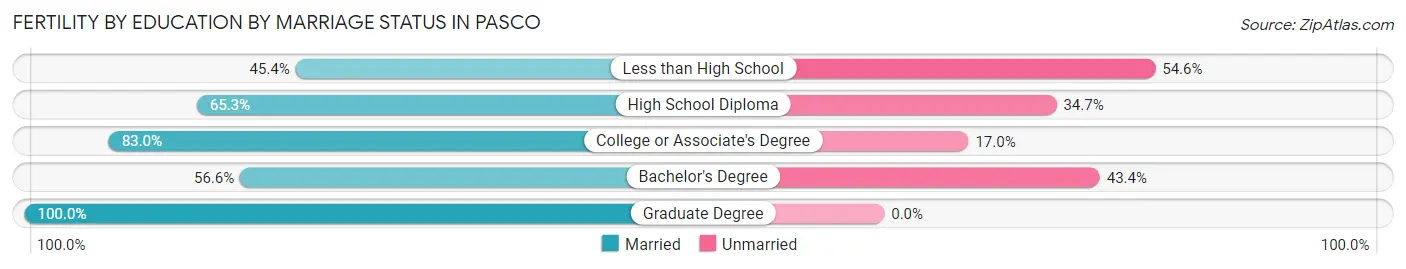
| Educational Attainment | Married | Unmarried |
| Less than High School | 123 (45.4%) | 148 (54.6%) |
| High School Diploma | 397 (65.3%) | 211 (34.7%) |
| College or Associate's Degree | 284 (83.0%) | 58 (17.0%) |
| Bachelor's Degree | 129 (56.6%) | 99 (43.4%) |
| Graduate Degree | 216 (100.0%) | 0 (0.0%) |
| Total | 1,149 (69.0%) | 516 (31.0%) |
Employment Characteristics in Pasco
Employment by Class of Employer in Pasco
Among the 33,954 employed individuals in Pasco, private company employees (23,508 | 69.2%), local government employees (2,227 | 6.6%), and not-for-profit organizations (2,174 | 6.4%) make up the most common classes of employment.
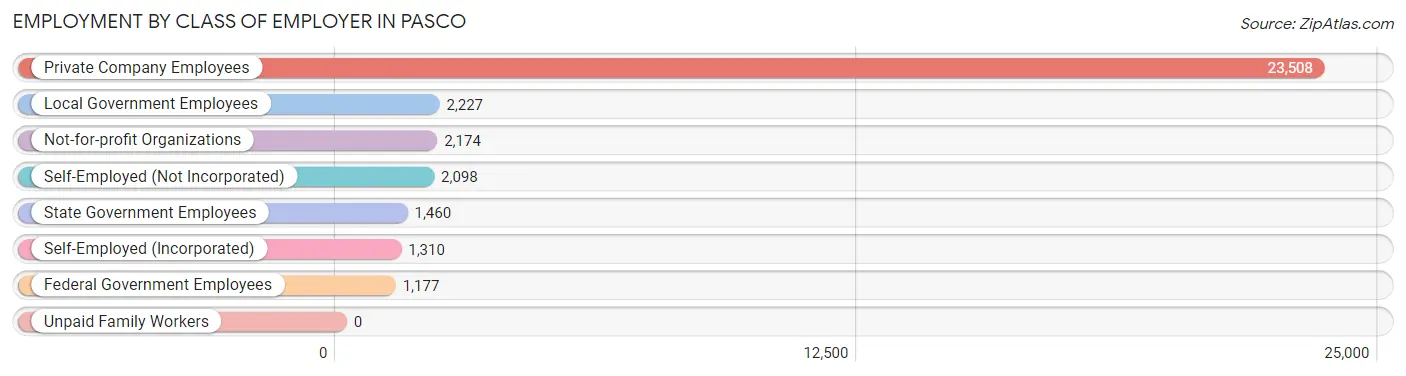
| Employer Class | # Employees | % Employees |
| Private Company Employees | 23,508 | 69.2% |
| Self-Employed (Incorporated) | 1,310 | 3.9% |
| Self-Employed (Not Incorporated) | 2,098 | 6.2% |
| Not-for-profit Organizations | 2,174 | 6.4% |
| Local Government Employees | 2,227 | 6.6% |
| State Government Employees | 1,460 | 4.3% |
| Federal Government Employees | 1,177 | 3.5% |
| Unpaid Family Workers | 0 | 0.0% |
| Total | 33,954 | 100.0% |
Employment Status by Age in Pasco
According to the labor force statistics for Pasco, out of the total population over 16 years of age (55,092), 67.7% or 37,297 individuals are in the labor force, with 5.8% or 2,163 of them unemployed. The age group with the highest labor force participation rate is 20 to 24 years, with 86.5% or 4,725 individuals in the labor force. Within the labor force, the 16 to 19 years age range has the highest percentage of unemployed individuals, with 24.4% or 430 of them being unemployed.
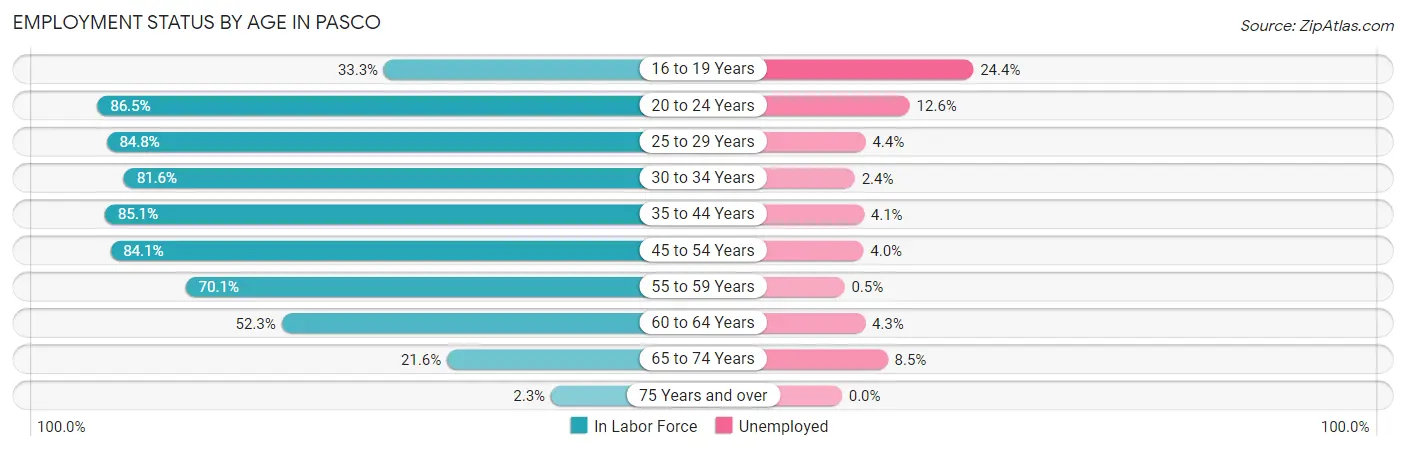
| Age Bracket | In Labor Force | Unemployed |
| 16 to 19 Years | 1,764 (33.3%) | 430 (24.4%) |
| 20 to 24 Years | 4,725 (86.5%) | 595 (12.6%) |
| 25 to 29 Years | 4,740 (84.8%) | 209 (4.4%) |
| 30 to 34 Years | 5,323 (81.6%) | 128 (2.4%) |
| 35 to 44 Years | 8,899 (85.1%) | 365 (4.1%) |
| 45 to 54 Years | 6,908 (84.1%) | 276 (4.0%) |
| 55 to 59 Years | 2,221 (70.1%) | 11 (0.5%) |
| 60 to 64 Years | 1,625 (52.3%) | 70 (4.3%) |
| 65 to 74 Years | 1,012 (21.6%) | 86 (8.5%) |
| 75 Years and over | 60 (2.3%) | 0 (0.0%) |
| Total | 37,297 (67.7%) | 2,163 (5.8%) |
Employment Status by Educational Attainment in Pasco
According to labor force statistics for Pasco, 80.2% of individuals (29,723) out of the total population between 25 and 64 years of age (37,061) are in the labor force, with 3.6% or 1,070 of them being unemployed. The group with the highest labor force participation rate are those with the educational attainment of bachelor's degree or higher, with 88.3% or 6,534 individuals in the labor force. Within the labor force, individuals with high school diploma education have the highest percentage of unemployment, with 5.7% or 434 of them being unemployed.
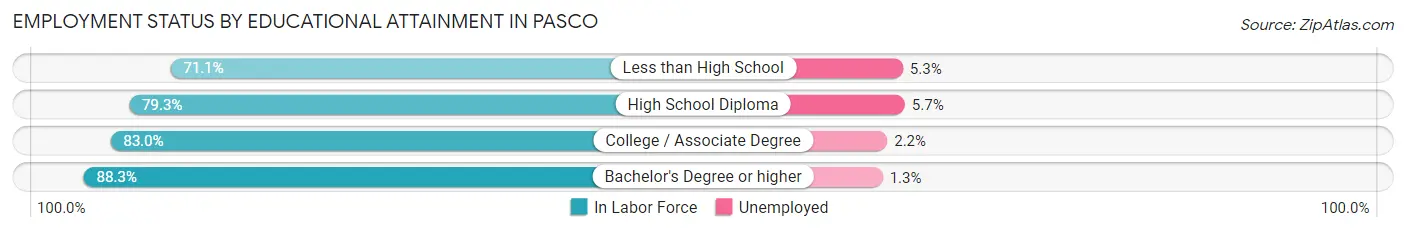
| Educational Attainment | In Labor Force | Unemployed |
| Less than High School | 6,486 (71.1%) | 484 (5.3%) |
| High School Diploma | 7,617 (79.3%) | 547 (5.7%) |
| College / Associate Degree | 9,074 (83.0%) | 241 (2.2%) |
| Bachelor's Degree or higher | 6,534 (88.3%) | 96 (1.3%) |
| Total | 29,723 (80.2%) | 1,334 (3.6%) |
Employment Occupations by Sex in Pasco
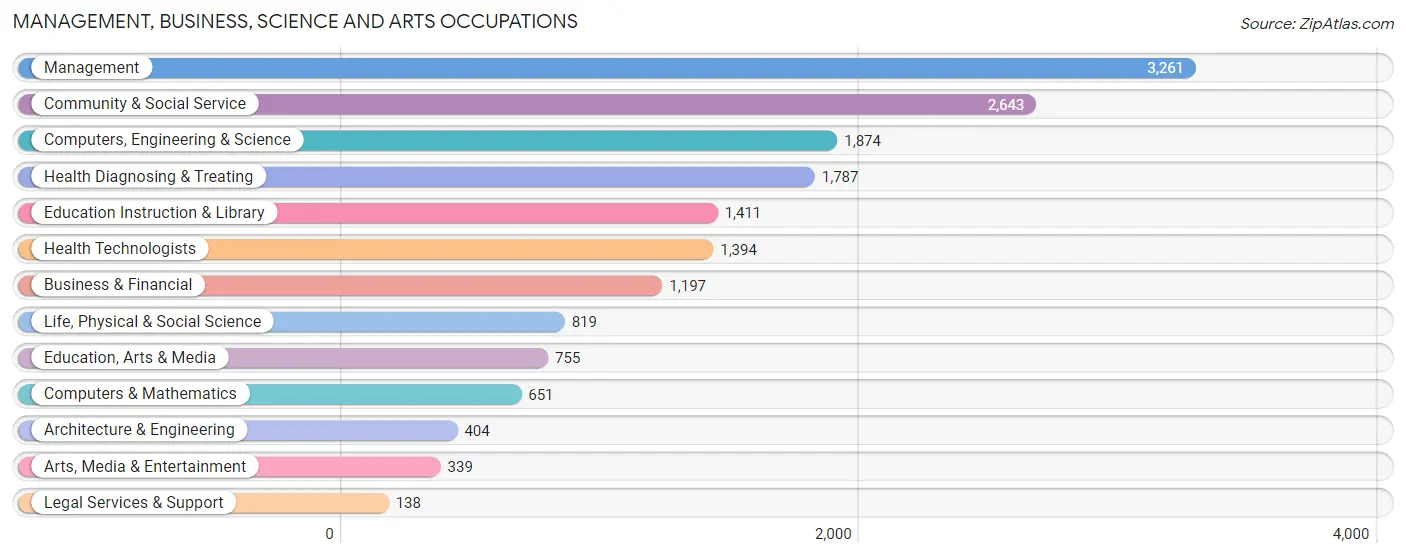
Management, Business, Science and Arts Occupations
The most common Management, Business, Science and Arts occupations in Pasco are Management (3,261 | 9.3%), Community & Social Service (2,643 | 7.5%), Computers, Engineering & Science (1,874 | 5.4%), Health Diagnosing & Treating (1,787 | 5.1%), and Education Instruction & Library (1,411 | 4.0%).
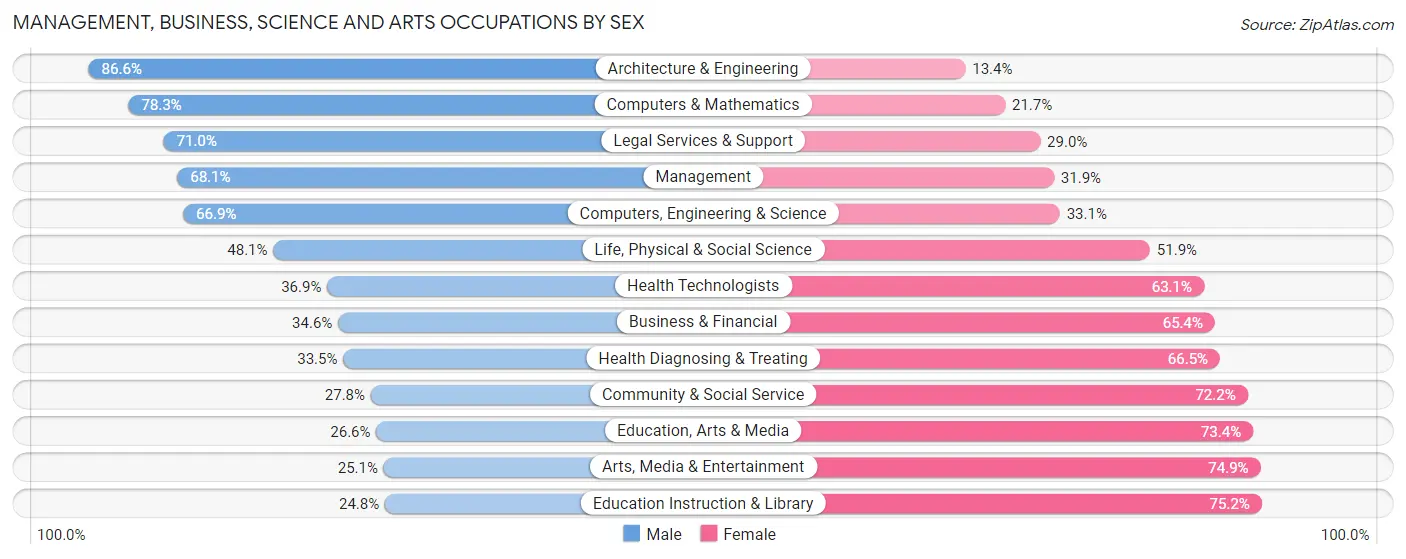
Management, Business, Science and Arts Occupations by Sex
Within the Management, Business, Science and Arts occupations in Pasco, the most male-oriented occupations are Architecture & Engineering (86.6%), Computers & Mathematics (78.3%), and Legal Services & Support (71.0%), while the most female-oriented occupations are Education Instruction & Library (75.2%), Arts, Media & Entertainment (74.9%), and Education, Arts & Media (73.4%).
| Occupation | Male | Female |
| Management | 2,222 (68.1%) | 1,039 (31.9%) |
| Business & Financial | 414 (34.6%) | 783 (65.4%) |
| Computers, Engineering & Science | 1,254 (66.9%) | 620 (33.1%) |
| Computers & Mathematics | 510 (78.3%) | 141 (21.7%) |
| Architecture & Engineering | 350 (86.6%) | 54 (13.4%) |
| Life, Physical & Social Science | 394 (48.1%) | 425 (51.9%) |
| Community & Social Service | 734 (27.8%) | 1,909 (72.2%) |
| Education, Arts & Media | 201 (26.6%) | 554 (73.4%) |
| Legal Services & Support | 98 (71.0%) | 40 (29.0%) |
| Education Instruction & Library | 350 (24.8%) | 1,061 (75.2%) |
| Arts, Media & Entertainment | 85 (25.1%) | 254 (74.9%) |
| Health Diagnosing & Treating | 599 (33.5%) | 1,188 (66.5%) |
| Health Technologists | 514 (36.9%) | 880 (63.1%) |
| Total (Category) | 5,223 (48.5%) | 5,539 (51.5%) |
| Total (Overall) | 19,249 (55.0%) | 15,744 (45.0%) |
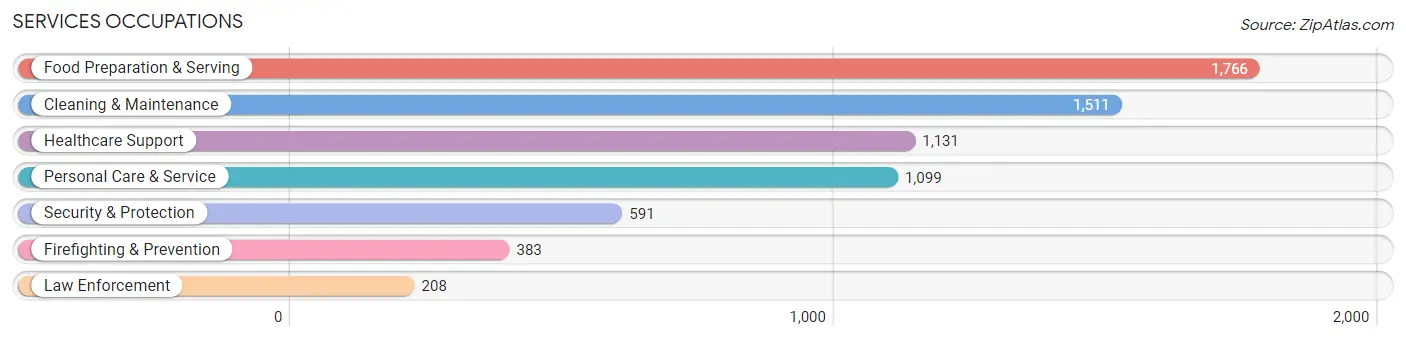
Services Occupations
The most common Services occupations in Pasco are Food Preparation & Serving (1,766 | 5.1%), Cleaning & Maintenance (1,511 | 4.3%), Healthcare Support (1,131 | 3.2%), Personal Care & Service (1,099 | 3.1%), and Security & Protection (591 | 1.7%).
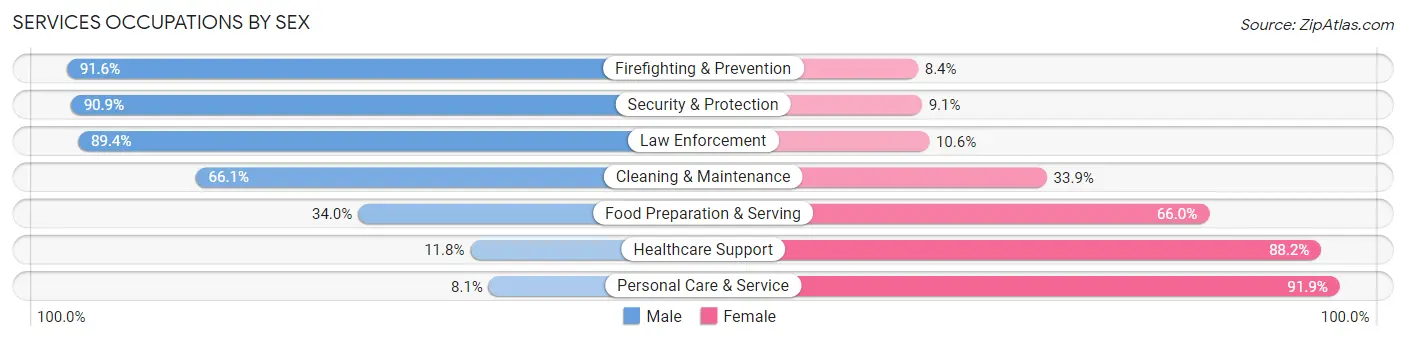
Services Occupations by Sex
Within the Services occupations in Pasco, the most male-oriented occupations are Firefighting & Prevention (91.6%), Security & Protection (90.9%), and Law Enforcement (89.4%), while the most female-oriented occupations are Personal Care & Service (91.9%), Healthcare Support (88.2%), and Food Preparation & Serving (66.0%).
| Occupation | Male | Female |
| Healthcare Support | 133 (11.8%) | 998 (88.2%) |
| Security & Protection | 537 (90.9%) | 54 (9.1%) |
| Firefighting & Prevention | 351 (91.6%) | 32 (8.4%) |
| Law Enforcement | 186 (89.4%) | 22 (10.6%) |
| Food Preparation & Serving | 600 (34.0%) | 1,166 (66.0%) |
| Cleaning & Maintenance | 999 (66.1%) | 512 (33.9%) |
| Personal Care & Service | 89 (8.1%) | 1,010 (91.9%) |
| Total (Category) | 2,358 (38.7%) | 3,740 (61.3%) |
| Total (Overall) | 19,249 (55.0%) | 15,744 (45.0%) |
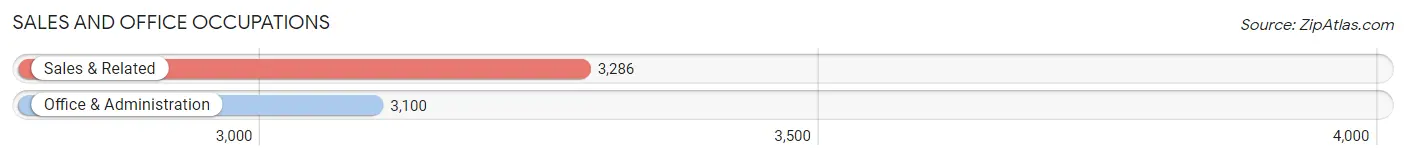
Sales and Office Occupations
The most common Sales and Office occupations in Pasco are Sales & Related (3,286 | 9.4%), and Office & Administration (3,100 | 8.9%).
Sales and Office Occupations by Sex
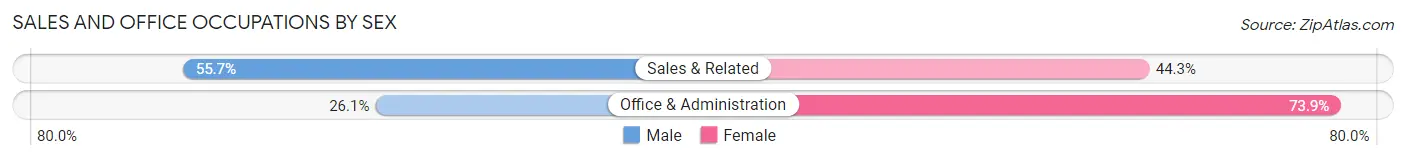
| Occupation | Male | Female |
| Sales & Related | 1,829 (55.7%) | 1,457 (44.3%) |
| Office & Administration | 808 (26.1%) | 2,292 (73.9%) |
| Total (Category) | 2,637 (41.3%) | 3,749 (58.7%) |
| Total (Overall) | 19,249 (55.0%) | 15,744 (45.0%) |
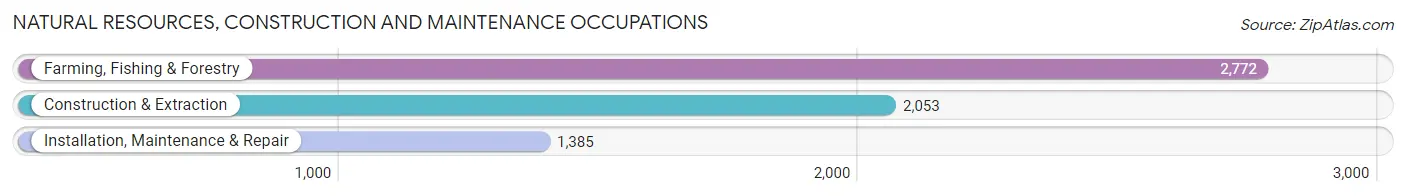
Natural Resources, Construction and Maintenance Occupations
The most common Natural Resources, Construction and Maintenance occupations in Pasco are Farming, Fishing & Forestry (2,772 | 7.9%), Construction & Extraction (2,053 | 5.9%), and Installation, Maintenance & Repair (1,385 | 4.0%).
Natural Resources, Construction and Maintenance Occupations by Sex
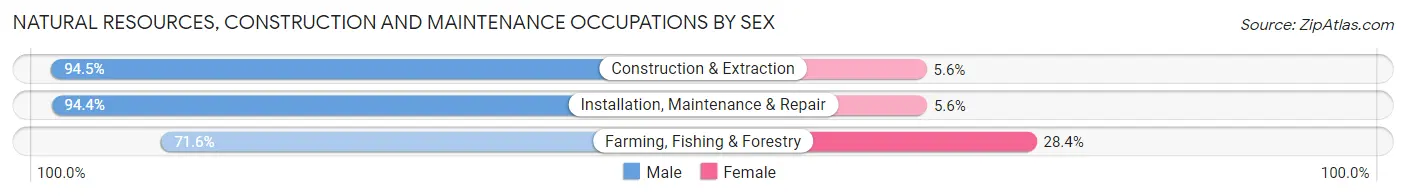
| Occupation | Male | Female |
| Farming, Fishing & Forestry | 1,984 (71.6%) | 788 (28.4%) |
| Construction & Extraction | 1,939 (94.5%) | 114 (5.6%) |
| Installation, Maintenance & Repair | 1,307 (94.4%) | 78 (5.6%) |
| Total (Category) | 5,230 (84.2%) | 980 (15.8%) |
| Total (Overall) | 19,249 (55.0%) | 15,744 (45.0%) |
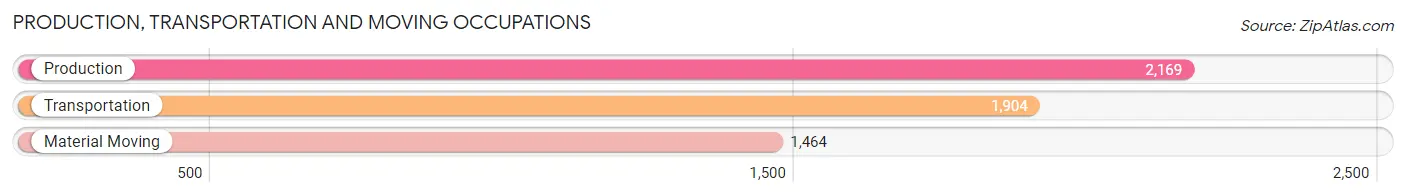
Production, Transportation and Moving Occupations
The most common Production, Transportation and Moving occupations in Pasco are Production (2,169 | 6.2%), Transportation (1,904 | 5.4%), and Material Moving (1,464 | 4.2%).
Production, Transportation and Moving Occupations by Sex
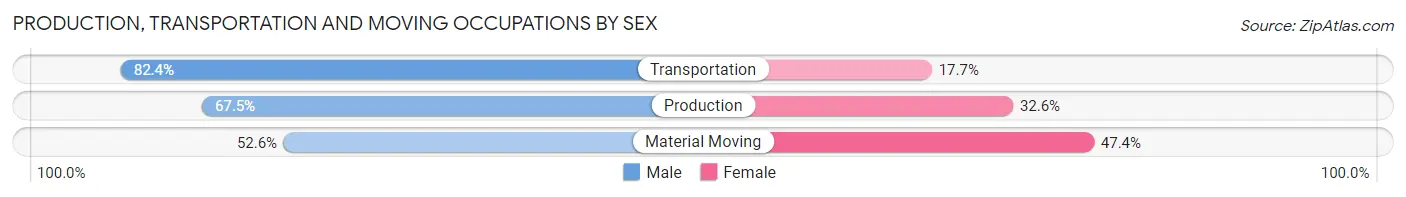
| Occupation | Male | Female |
| Production | 1,463 (67.4%) | 706 (32.6%) |
| Transportation | 1,568 (82.4%) | 336 (17.6%) |
| Material Moving | 770 (52.6%) | 694 (47.4%) |
| Total (Category) | 3,801 (68.6%) | 1,736 (31.4%) |
| Total (Overall) | 19,249 (55.0%) | 15,744 (45.0%) |
Employment Industries by Sex in Pasco
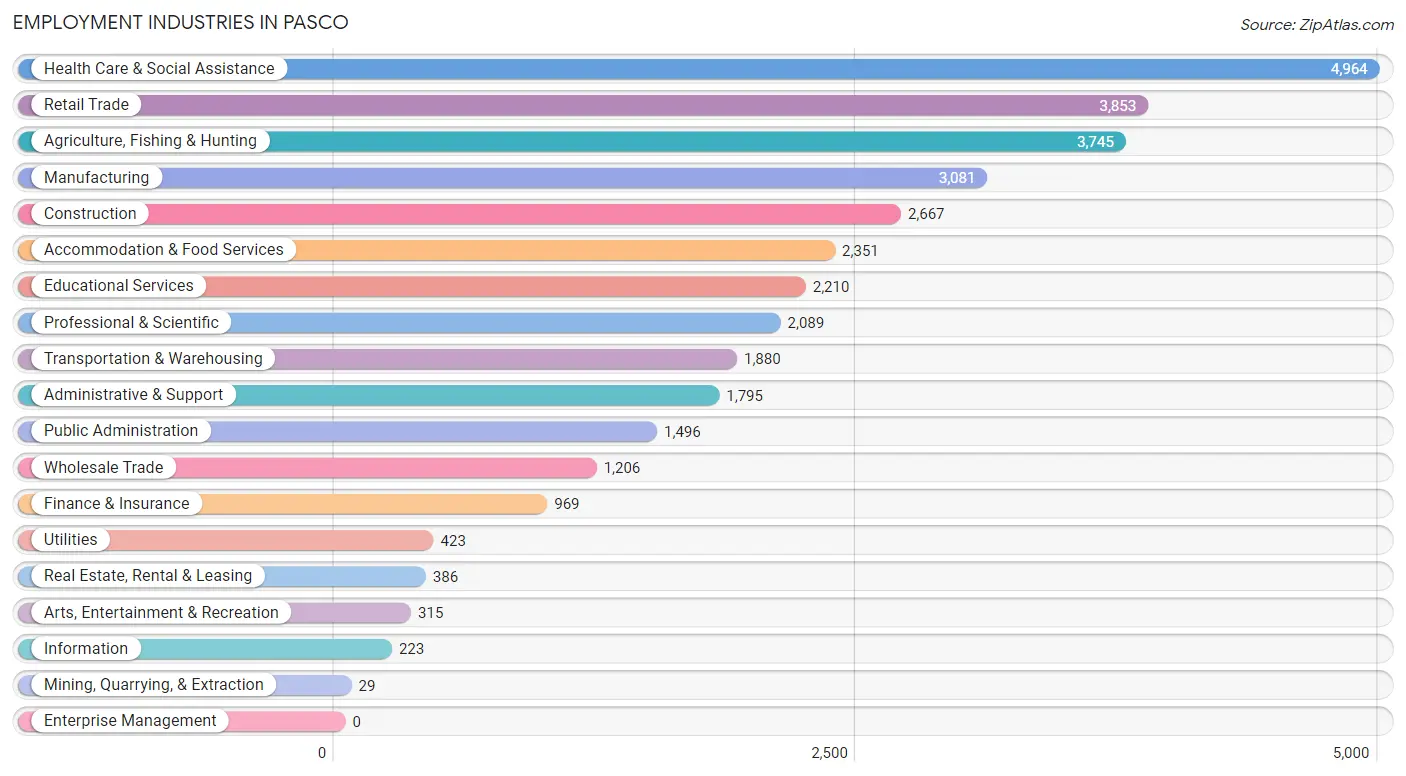
Employment Industries in Pasco
The major employment industries in Pasco include Health Care & Social Assistance (4,964 | 14.2%), Retail Trade (3,853 | 11.0%), Agriculture, Fishing & Hunting (3,745 | 10.7%), Manufacturing (3,081 | 8.8%), and Construction (2,667 | 7.6%).
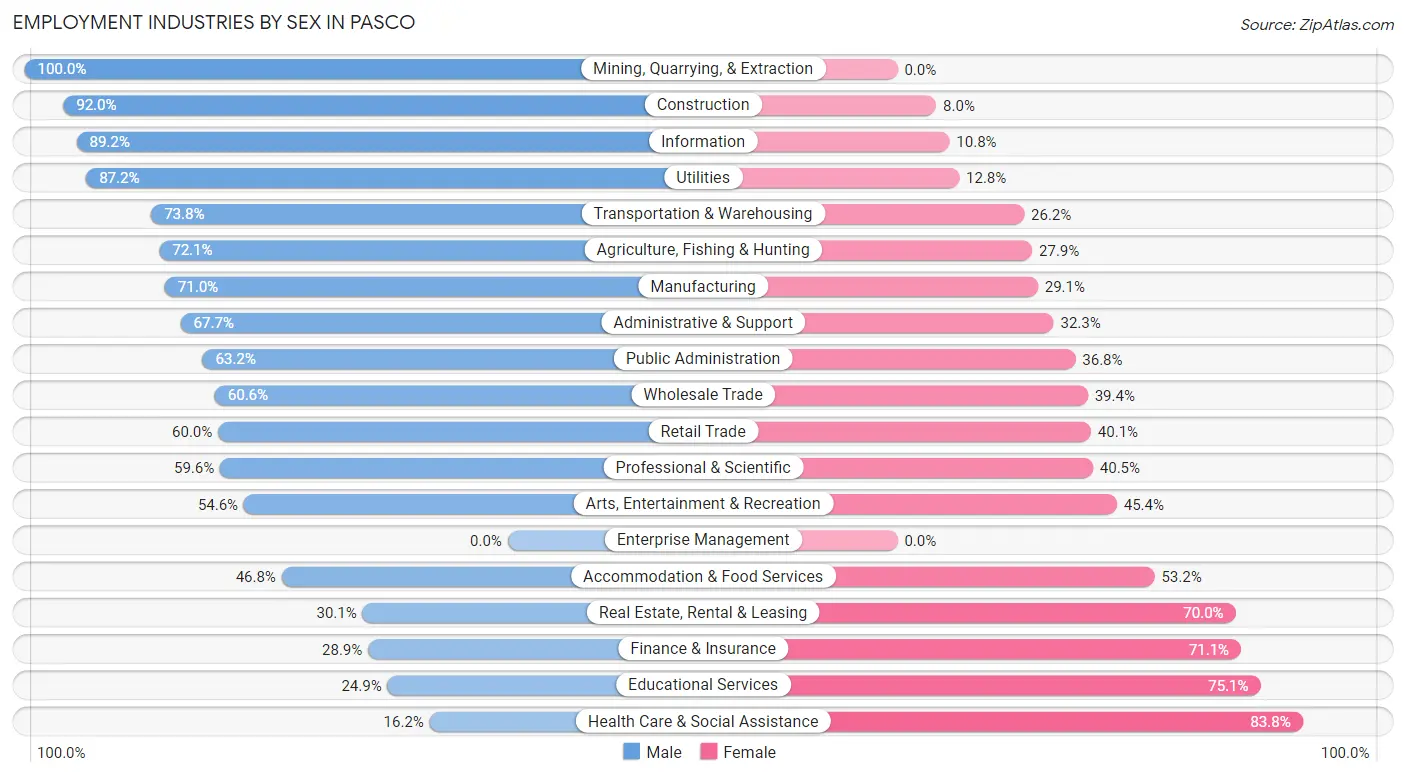
Employment Industries by Sex in Pasco
The Pasco industries that see more men than women are Mining, Quarrying, & Extraction (100.0%), Construction (92.0%), and Information (89.2%), whereas the industries that tend to have a higher number of women are Health Care & Social Assistance (83.8%), Educational Services (75.1%), and Finance & Insurance (71.1%).
| Industry | Male | Female |
| Agriculture, Fishing & Hunting | 2,701 (72.1%) | 1,044 (27.9%) |
| Mining, Quarrying, & Extraction | 29 (100.0%) | 0 (0.0%) |
| Construction | 2,453 (92.0%) | 214 (8.0%) |
| Manufacturing | 2,186 (71.0%) | 895 (29.0%) |
| Wholesale Trade | 731 (60.6%) | 475 (39.4%) |
| Retail Trade | 2,310 (60.0%) | 1,543 (40.1%) |
| Transportation & Warehousing | 1,387 (73.8%) | 493 (26.2%) |
| Utilities | 369 (87.2%) | 54 (12.8%) |
| Information | 199 (89.2%) | 24 (10.8%) |
| Finance & Insurance | 280 (28.9%) | 689 (71.1%) |
| Real Estate, Rental & Leasing | 116 (30.0%) | 270 (70.0%) |
| Professional & Scientific | 1,244 (59.6%) | 845 (40.5%) |
| Enterprise Management | 0 (0.0%) | 0 (0.0%) |
| Administrative & Support | 1,215 (67.7%) | 580 (32.3%) |
| Educational Services | 550 (24.9%) | 1,660 (75.1%) |
| Health Care & Social Assistance | 802 (16.2%) | 4,162 (83.8%) |
| Arts, Entertainment & Recreation | 172 (54.6%) | 143 (45.4%) |
| Accommodation & Food Services | 1,100 (46.8%) | 1,251 (53.2%) |
| Public Administration | 945 (63.2%) | 551 (36.8%) |
| Total | 19,249 (55.0%) | 15,744 (45.0%) |
Education in Pasco
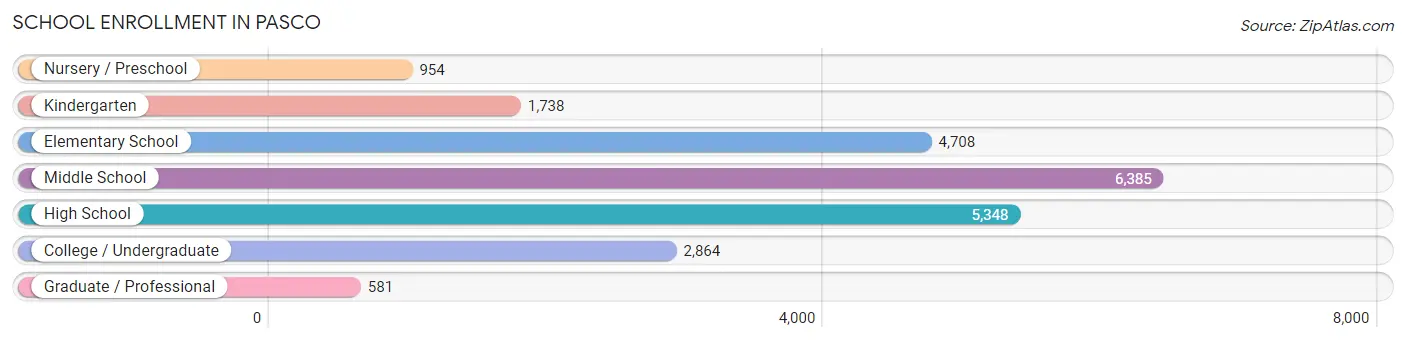
School Enrollment in Pasco
The most common levels of schooling among the 22,578 students in Pasco are middle school (6,385 | 28.3%), high school (5,348 | 23.7%), and elementary school (4,708 | 20.8%).
| School Level | # Students | % Students |
| Nursery / Preschool | 954 | 4.2% |
| Kindergarten | 1,738 | 7.7% |
| Elementary School | 4,708 | 20.8% |
| Middle School | 6,385 | 28.3% |
| High School | 5,348 | 23.7% |
| College / Undergraduate | 2,864 | 12.7% |
| Graduate / Professional | 581 | 2.6% |
| Total | 22,578 | 100.0% |
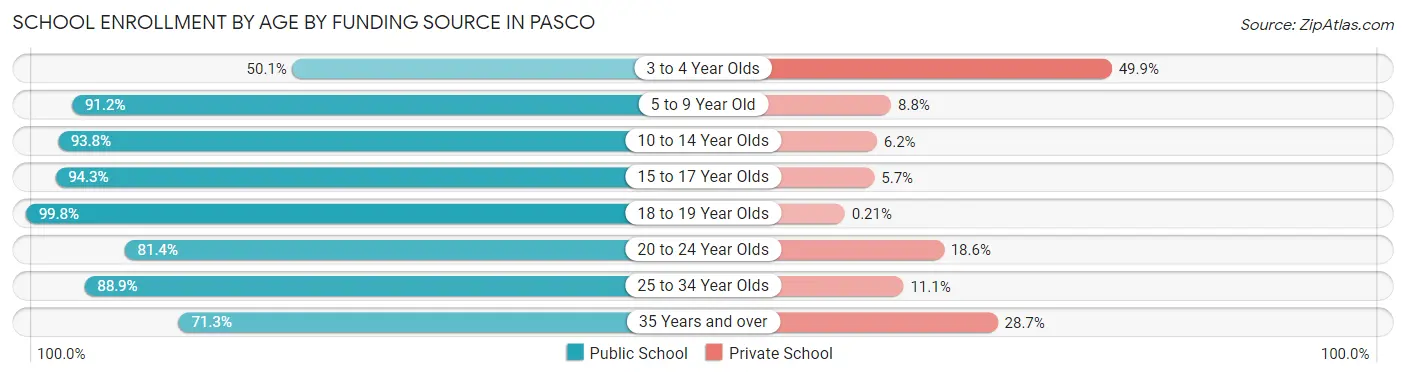
School Enrollment by Age by Funding Source in Pasco
Out of a total of 22,578 students who are enrolled in schools in Pasco, 2,145 (9.5%) attend a private institution, while the remaining 20,433 (90.5%) are enrolled in public schools. The age group of 3 to 4 year olds has the highest likelihood of being enrolled in private schools, with 350 (49.9% in the age bracket) enrolled. Conversely, the age group of 18 to 19 year olds has the lowest likelihood of being enrolled in a private school, with 1,428 (99.8% in the age bracket) attending a public institution.
| Age Bracket | Public School | Private School |
| 3 to 4 Year Olds | 351 (50.1%) | 350 (49.9%) |
| 5 to 9 Year Old | 5,337 (91.2%) | 517 (8.8%) |
| 10 to 14 Year Olds | 7,162 (93.8%) | 472 (6.2%) |
| 15 to 17 Year Olds | 3,845 (94.3%) | 233 (5.7%) |
| 18 to 19 Year Olds | 1,428 (99.8%) | 3 (0.2%) |
| 20 to 24 Year Olds | 991 (81.4%) | 227 (18.6%) |
| 25 to 34 Year Olds | 702 (88.9%) | 88 (11.1%) |
| 35 Years and over | 622 (71.3%) | 250 (28.7%) |
| Total | 20,433 (90.5%) | 2,145 (9.5%) |
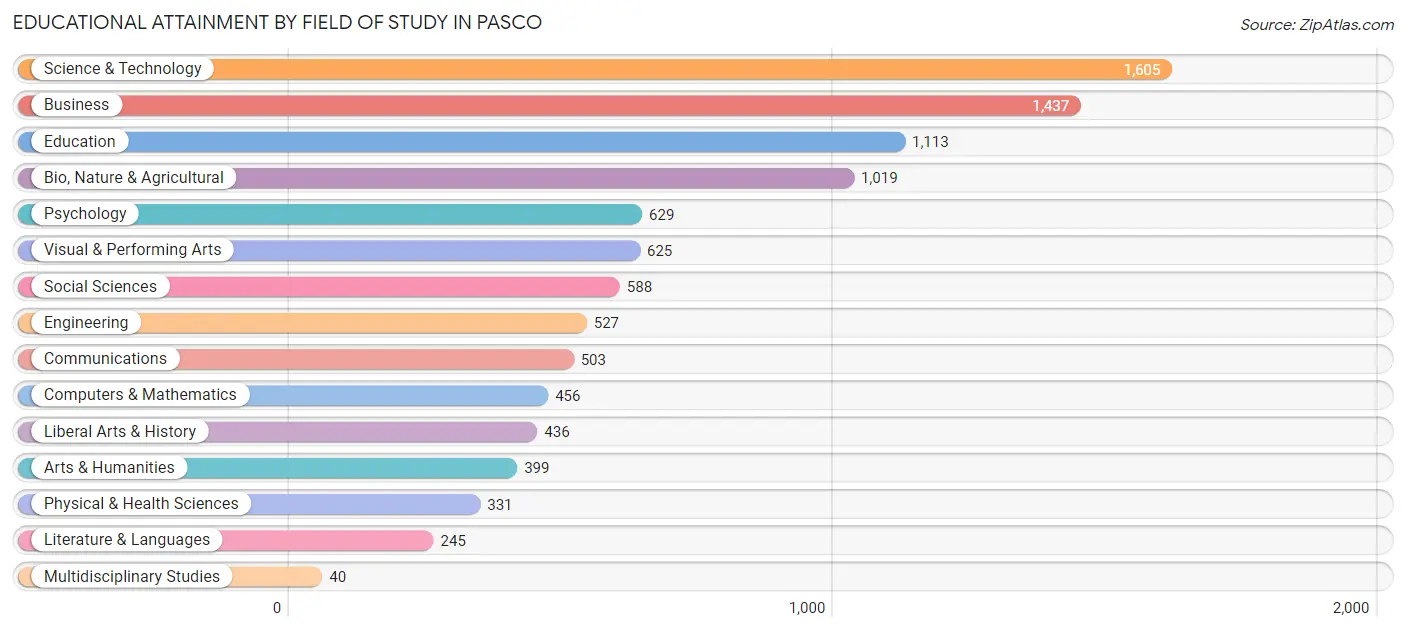
Educational Attainment by Field of Study in Pasco
Science & technology (1,605 | 16.1%), business (1,437 | 14.4%), education (1,113 | 11.2%), bio, nature & agricultural (1,019 | 10.2%), and psychology (629 | 6.3%) are the most common fields of study among 9,953 individuals in Pasco who have obtained a bachelor's degree or higher.
| Field of Study | # Graduates | % Graduates |
| Computers & Mathematics | 456 | 4.6% |
| Bio, Nature & Agricultural | 1,019 | 10.2% |
| Physical & Health Sciences | 331 | 3.3% |
| Psychology | 629 | 6.3% |
| Social Sciences | 588 | 5.9% |
| Engineering | 527 | 5.3% |
| Multidisciplinary Studies | 40 | 0.4% |
| Science & Technology | 1,605 | 16.1% |
| Business | 1,437 | 14.4% |
| Education | 1,113 | 11.2% |
| Literature & Languages | 245 | 2.5% |
| Liberal Arts & History | 436 | 4.4% |
| Visual & Performing Arts | 625 | 6.3% |
| Communications | 503 | 5.1% |
| Arts & Humanities | 399 | 4.0% |
| Total | 9,953 | 100.0% |
Transportation & Commute in Pasco
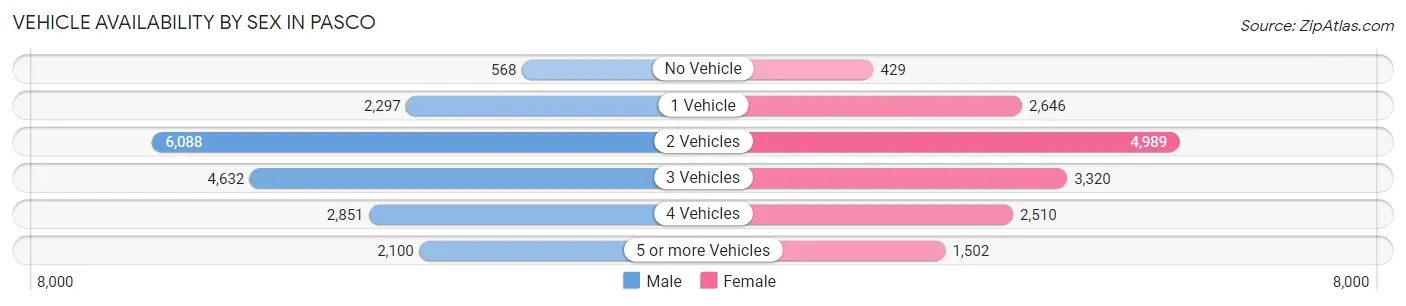
Vehicle Availability by Sex in Pasco
The most prevalent vehicle ownership categories in Pasco are males with 2 vehicles (6,088, accounting for 32.8%) and females with 2 vehicles (4,989, making up 39.5%).
| Vehicles Available | Male | Female |
| No Vehicle | 568 (3.1%) | 429 (2.8%) |
| 1 Vehicle | 2,297 (12.4%) | 2,646 (17.2%) |
| 2 Vehicles | 6,088 (32.8%) | 4,989 (32.4%) |
| 3 Vehicles | 4,632 (25.0%) | 3,320 (21.6%) |
| 4 Vehicles | 2,851 (15.4%) | 2,510 (16.3%) |
| 5 or more Vehicles | 2,100 (11.3%) | 1,502 (9.8%) |
| Total | 18,536 (100.0%) | 15,396 (100.0%) |
Commute Time in Pasco
The most frequently occuring commute durations in Pasco are 15 to 19 minutes (8,656 commuters, 27.0%), 10 to 14 minutes (4,792 commuters, 15.0%), and 20 to 24 minutes (4,709 commuters, 14.7%).
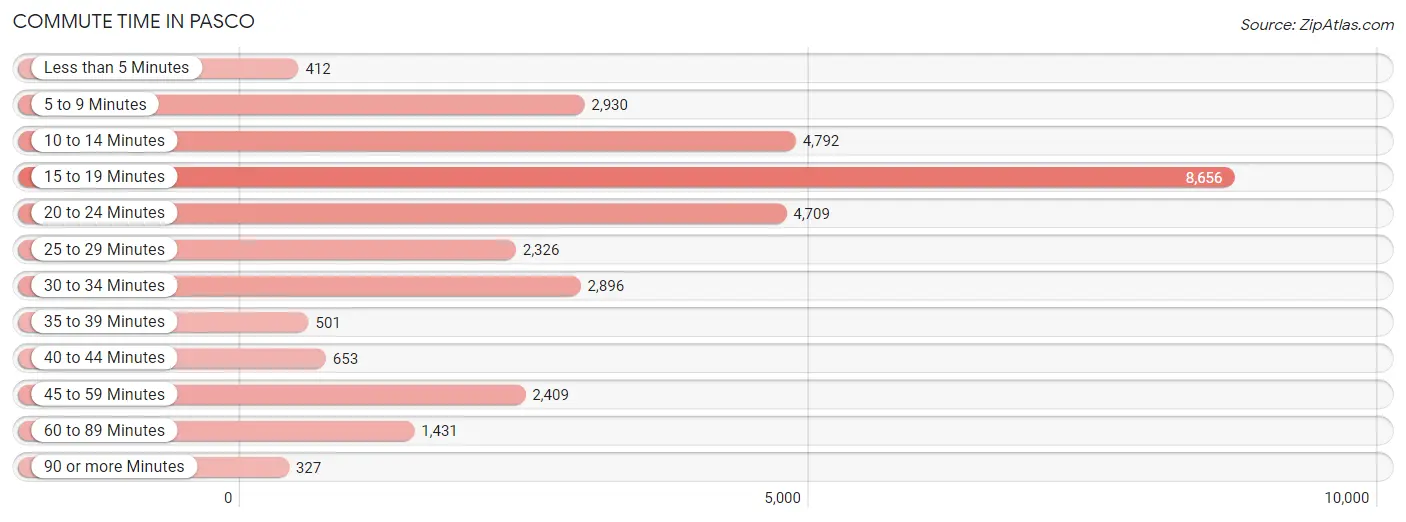
| Commute Time | # Commuters | % Commuters |
| Less than 5 Minutes | 412 | 1.3% |
| 5 to 9 Minutes | 2,930 | 9.1% |
| 10 to 14 Minutes | 4,792 | 15.0% |
| 15 to 19 Minutes | 8,656 | 27.0% |
| 20 to 24 Minutes | 4,709 | 14.7% |
| 25 to 29 Minutes | 2,326 | 7.3% |
| 30 to 34 Minutes | 2,896 | 9.0% |
| 35 to 39 Minutes | 501 | 1.6% |
| 40 to 44 Minutes | 653 | 2.0% |
| 45 to 59 Minutes | 2,409 | 7.5% |
| 60 to 89 Minutes | 1,431 | 4.5% |
| 90 or more Minutes | 327 | 1.0% |
Commute Time by Sex in Pasco
The most common commute times in Pasco are 15 to 19 minutes (4,108 commuters, 23.3%) for males and 15 to 19 minutes (4,548 commuters, 31.6%) for females.
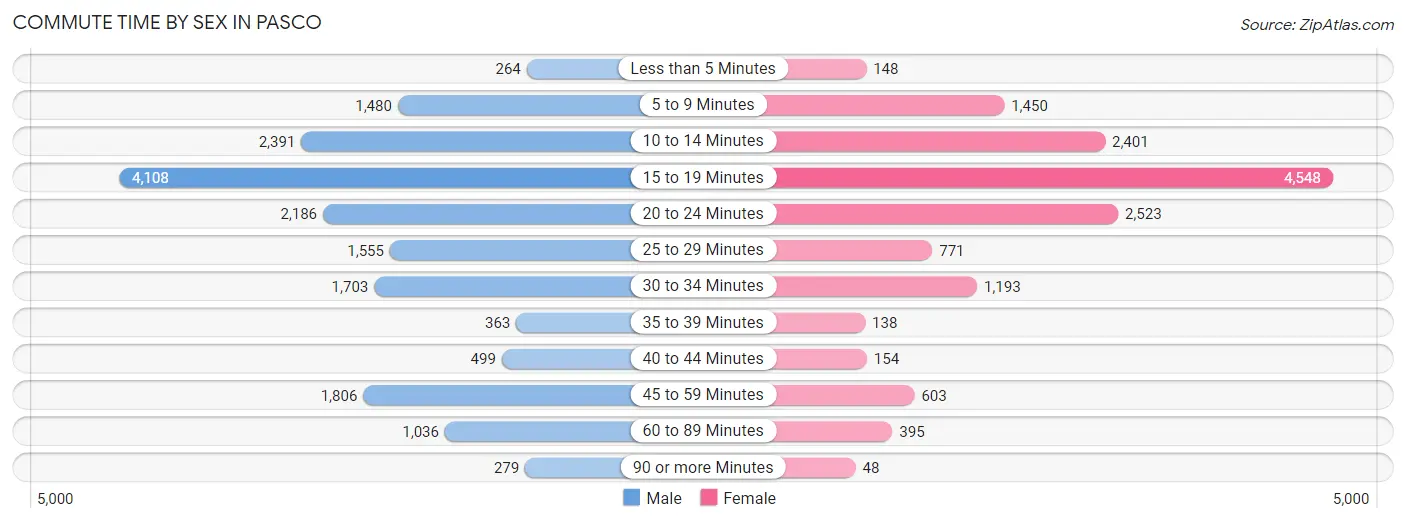
| Commute Time | Male | Female |
| Less than 5 Minutes | 264 (1.5%) | 148 (1.0%) |
| 5 to 9 Minutes | 1,480 (8.4%) | 1,450 (10.1%) |
| 10 to 14 Minutes | 2,391 (13.5%) | 2,401 (16.7%) |
| 15 to 19 Minutes | 4,108 (23.3%) | 4,548 (31.6%) |
| 20 to 24 Minutes | 2,186 (12.4%) | 2,523 (17.5%) |
| 25 to 29 Minutes | 1,555 (8.8%) | 771 (5.4%) |
| 30 to 34 Minutes | 1,703 (9.6%) | 1,193 (8.3%) |
| 35 to 39 Minutes | 363 (2.1%) | 138 (1.0%) |
| 40 to 44 Minutes | 499 (2.8%) | 154 (1.1%) |
| 45 to 59 Minutes | 1,806 (10.2%) | 603 (4.2%) |
| 60 to 89 Minutes | 1,036 (5.9%) | 395 (2.8%) |
| 90 or more Minutes | 279 (1.6%) | 48 (0.3%) |
Time of Departure to Work by Sex in Pasco
The most frequent times of departure to work in Pasco are 7:00 AM to 7:29 AM (2,416, 13.7%) for males and 7:00 AM to 7:29 AM (2,511, 17.5%) for females.
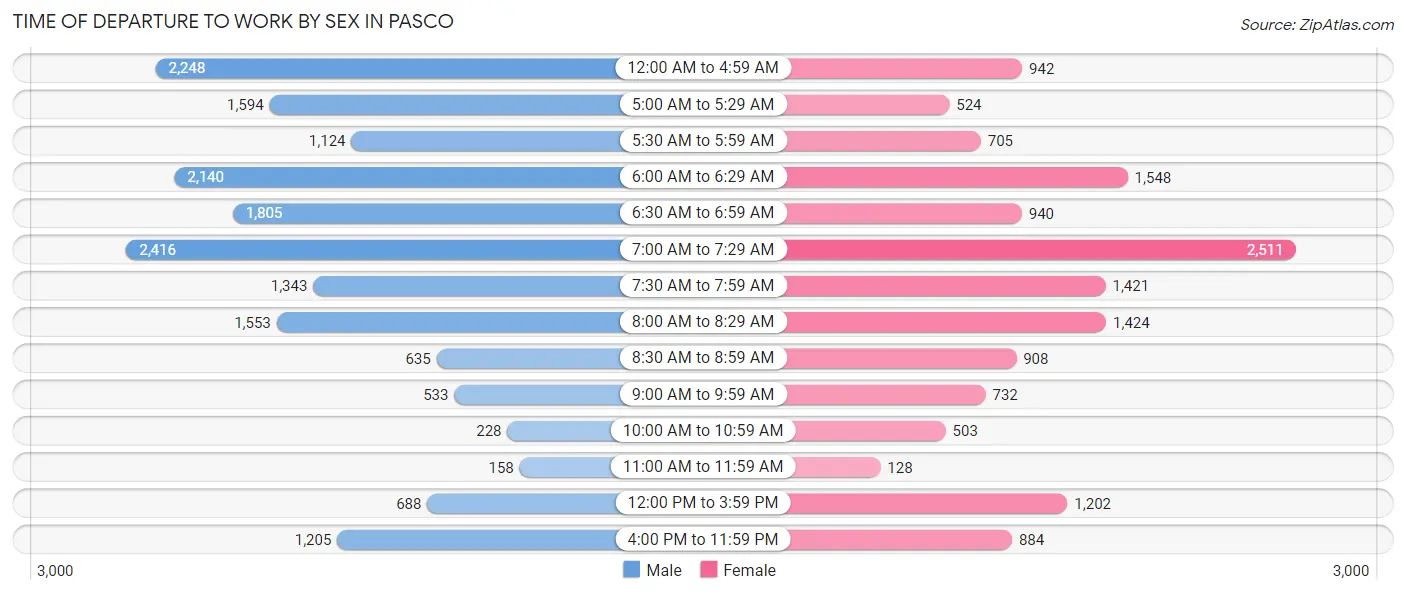
| Time of Departure | Male | Female |
| 12:00 AM to 4:59 AM | 2,248 (12.7%) | 942 (6.6%) |
| 5:00 AM to 5:29 AM | 1,594 (9.0%) | 524 (3.6%) |
| 5:30 AM to 5:59 AM | 1,124 (6.4%) | 705 (4.9%) |
| 6:00 AM to 6:29 AM | 2,140 (12.1%) | 1,548 (10.8%) |
| 6:30 AM to 6:59 AM | 1,805 (10.2%) | 940 (6.5%) |
| 7:00 AM to 7:29 AM | 2,416 (13.7%) | 2,511 (17.5%) |
| 7:30 AM to 7:59 AM | 1,343 (7.6%) | 1,421 (9.9%) |
| 8:00 AM to 8:29 AM | 1,553 (8.8%) | 1,424 (9.9%) |
| 8:30 AM to 8:59 AM | 635 (3.6%) | 908 (6.3%) |
| 9:00 AM to 9:59 AM | 533 (3.0%) | 732 (5.1%) |
| 10:00 AM to 10:59 AM | 228 (1.3%) | 503 (3.5%) |
| 11:00 AM to 11:59 AM | 158 (0.9%) | 128 (0.9%) |
| 12:00 PM to 3:59 PM | 688 (3.9%) | 1,202 (8.4%) |
| 4:00 PM to 11:59 PM | 1,205 (6.8%) | 884 (6.1%) |
| Total | 17,670 (100.0%) | 14,372 (100.0%) |
Housing Occupancy in Pasco
Occupancy by Ownership in Pasco
Of the total 23,134 dwellings in Pasco, owner-occupied units account for 15,946 (68.9%), while renter-occupied units make up 7,188 (31.1%).
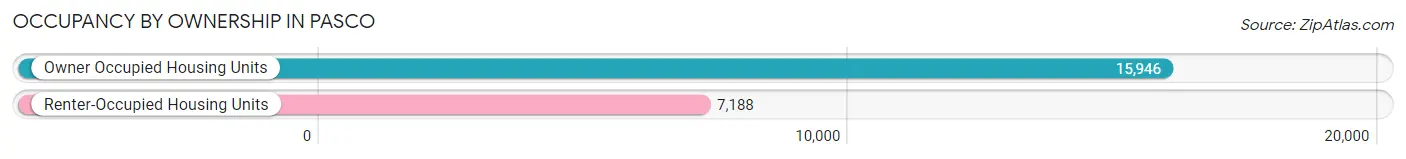
| Occupancy | # Housing Units | % Housing Units |
| Owner Occupied Housing Units | 15,946 | 68.9% |
| Renter-Occupied Housing Units | 7,188 | 31.1% |
| Total Occupied Housing Units | 23,134 | 100.0% |
Occupancy by Household Size in Pasco
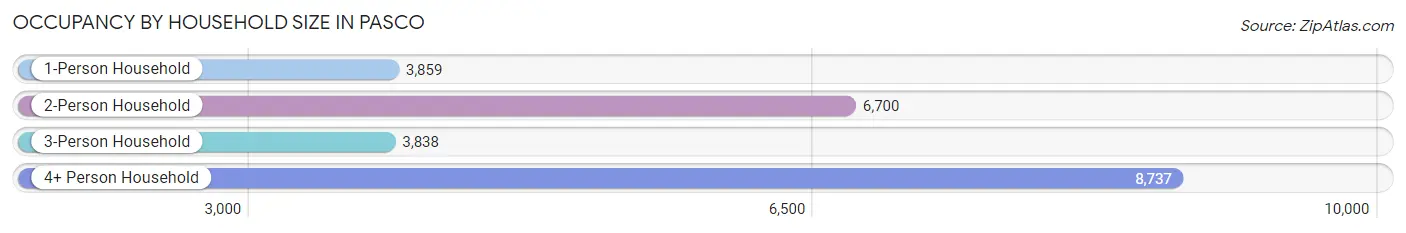
| Household Size | # Housing Units | % Housing Units |
| 1-Person Household | 3,859 | 16.7% |
| 2-Person Household | 6,700 | 29.0% |
| 3-Person Household | 3,838 | 16.6% |
| 4+ Person Household | 8,737 | 37.8% |
| Total Housing Units | 23,134 | 100.0% |
Occupancy by Ownership by Household Size in Pasco
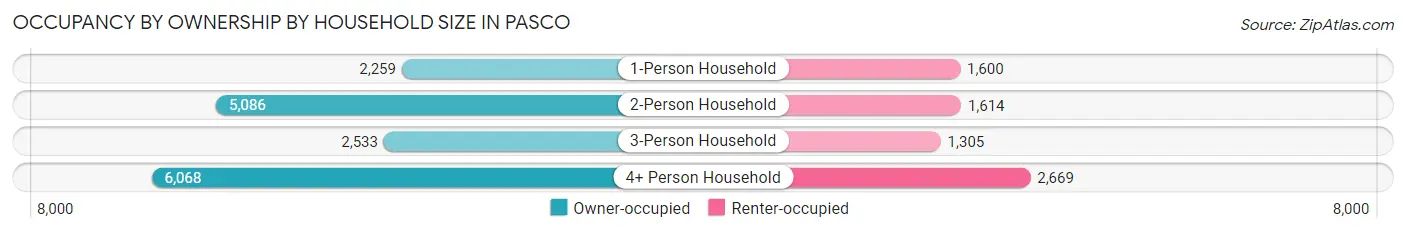
| Household Size | Owner-occupied | Renter-occupied |
| 1-Person Household | 2,259 (58.5%) | 1,600 (41.5%) |
| 2-Person Household | 5,086 (75.9%) | 1,614 (24.1%) |
| 3-Person Household | 2,533 (66.0%) | 1,305 (34.0%) |
| 4+ Person Household | 6,068 (69.5%) | 2,669 (30.5%) |
| Total Housing Units | 15,946 (68.9%) | 7,188 (31.1%) |
Occupancy by Educational Attainment in Pasco
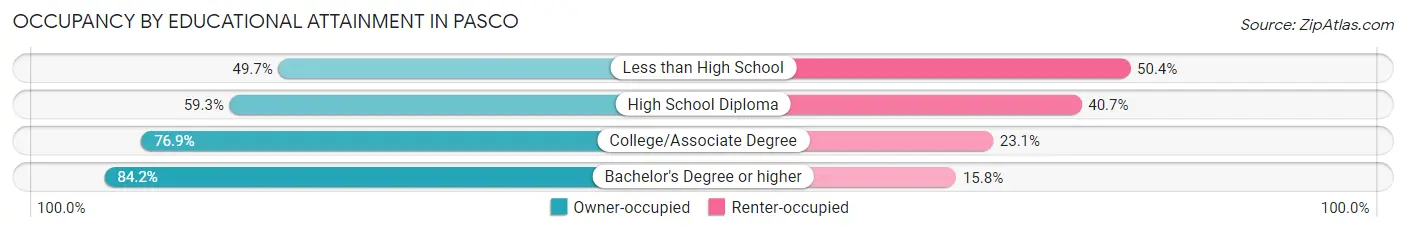
| Household Size | Owner-occupied | Renter-occupied |
| Less than High School | 2,356 (49.6%) | 2,389 (50.3%) |
| High School Diploma | 3,185 (59.3%) | 2,183 (40.7%) |
| College/Associate Degree | 5,843 (76.9%) | 1,758 (23.1%) |
| Bachelor's Degree or higher | 4,562 (84.2%) | 858 (15.8%) |
Occupancy by Age of Householder in Pasco
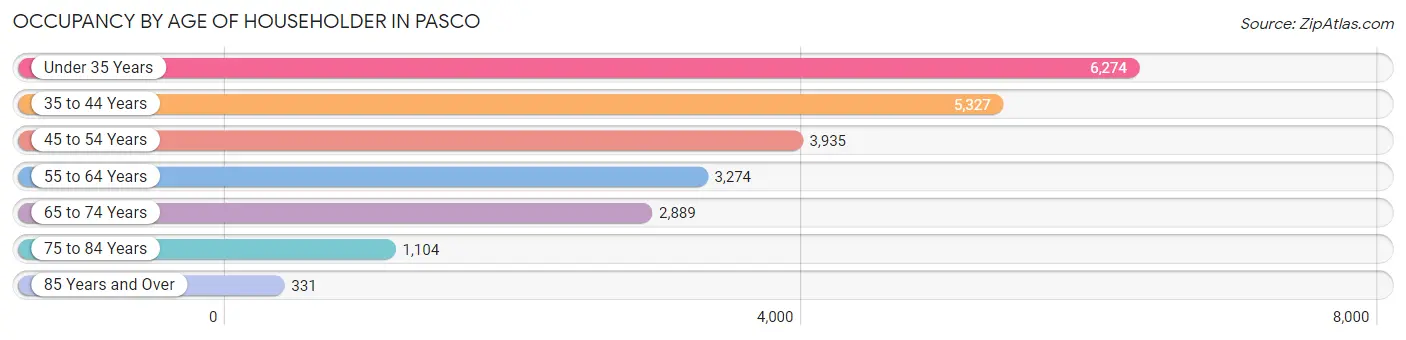
| Age Bracket | # Households | % Households |
| Under 35 Years | 6,274 | 27.1% |
| 35 to 44 Years | 5,327 | 23.0% |
| 45 to 54 Years | 3,935 | 17.0% |
| 55 to 64 Years | 3,274 | 14.1% |
| 65 to 74 Years | 2,889 | 12.5% |
| 75 to 84 Years | 1,104 | 4.8% |
| 85 Years and Over | 331 | 1.4% |
| Total | 23,134 | 100.0% |
Housing Finances in Pasco
Median Income by Occupancy in Pasco
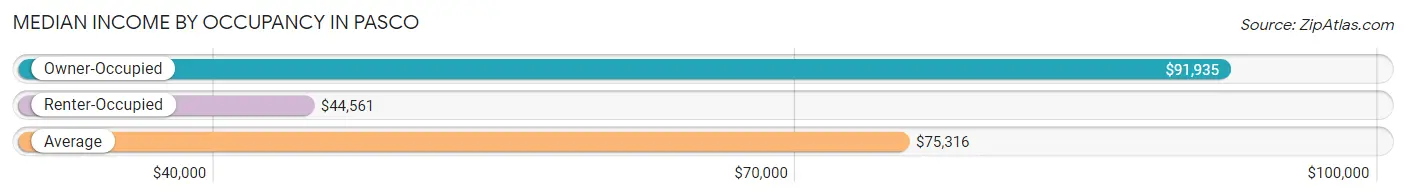
| Occupancy Type | # Households | Median Income |
| Owner-Occupied | 15,946 (68.9%) | $91,935 |
| Renter-Occupied | 7,188 (31.1%) | $44,561 |
| Average | 23,134 (100.0%) | $75,316 |
Occupancy by Householder Income Bracket in Pasco
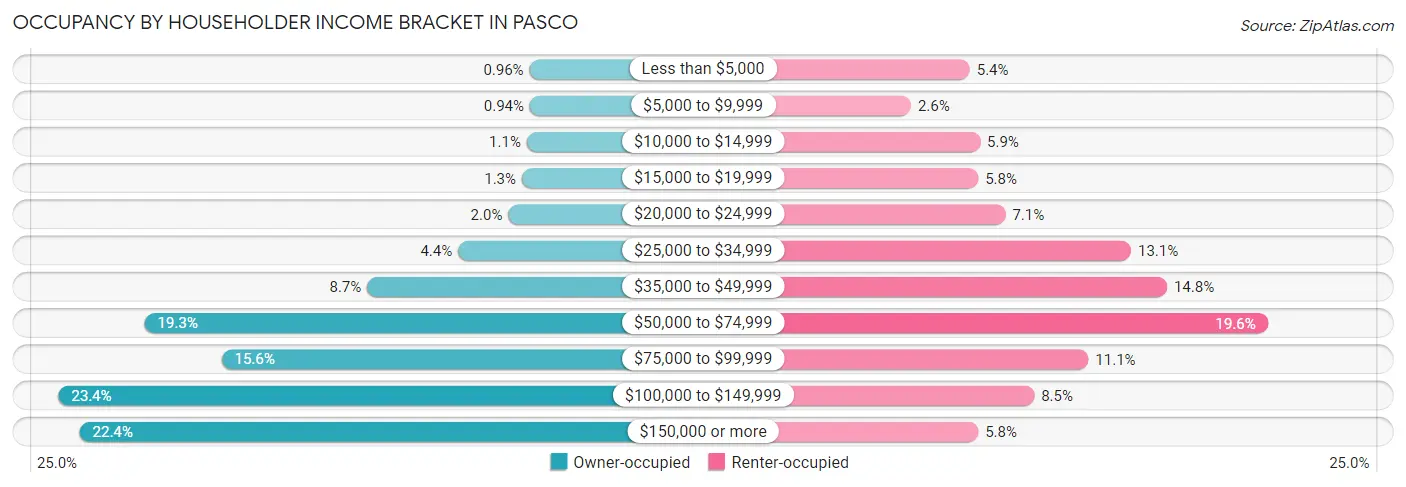
| Income Bracket | Owner-occupied | Renter-occupied |
| Less than $5,000 | 153 (1.0%) | 391 (5.4%) |
| $5,000 to $9,999 | 150 (0.9%) | 190 (2.6%) |
| $10,000 to $14,999 | 174 (1.1%) | 426 (5.9%) |
| $15,000 to $19,999 | 210 (1.3%) | 420 (5.8%) |
| $20,000 to $24,999 | 314 (2.0%) | 513 (7.1%) |
| $25,000 to $34,999 | 695 (4.4%) | 943 (13.1%) |
| $35,000 to $49,999 | 1,385 (8.7%) | 1,066 (14.8%) |
| $50,000 to $74,999 | 3,076 (19.3%) | 1,410 (19.6%) |
| $75,000 to $99,999 | 2,490 (15.6%) | 797 (11.1%) |
| $100,000 to $149,999 | 3,730 (23.4%) | 612 (8.5%) |
| $150,000 or more | 3,569 (22.4%) | 420 (5.8%) |
| Total | 15,946 (100.0%) | 7,188 (100.0%) |
Monthly Housing Cost Tiers in Pasco
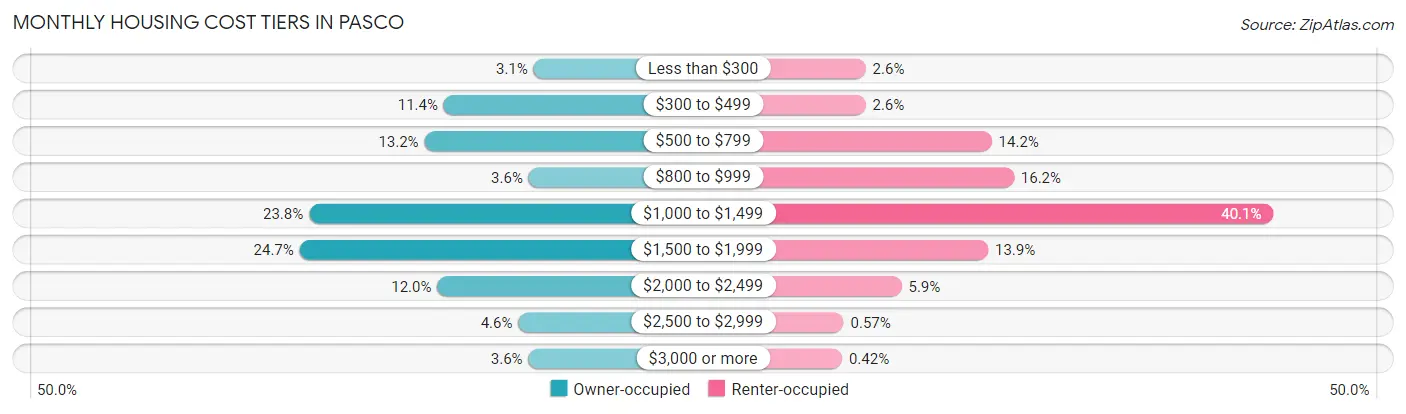
| Monthly Cost | Owner-occupied | Renter-occupied |
| Less than $300 | 501 (3.1%) | 187 (2.6%) |
| $300 to $499 | 1,819 (11.4%) | 186 (2.6%) |
| $500 to $799 | 2,104 (13.2%) | 1,021 (14.2%) |
| $800 to $999 | 572 (3.6%) | 1,167 (16.2%) |
| $1,000 to $1,499 | 3,797 (23.8%) | 2,884 (40.1%) |
| $1,500 to $1,999 | 3,935 (24.7%) | 997 (13.9%) |
| $2,000 to $2,499 | 1,915 (12.0%) | 424 (5.9%) |
| $2,500 to $2,999 | 726 (4.5%) | 41 (0.6%) |
| $3,000 or more | 577 (3.6%) | 30 (0.4%) |
| Total | 15,946 (100.0%) | 7,188 (100.0%) |
Physical Housing Characteristics in Pasco
Housing Structures in Pasco
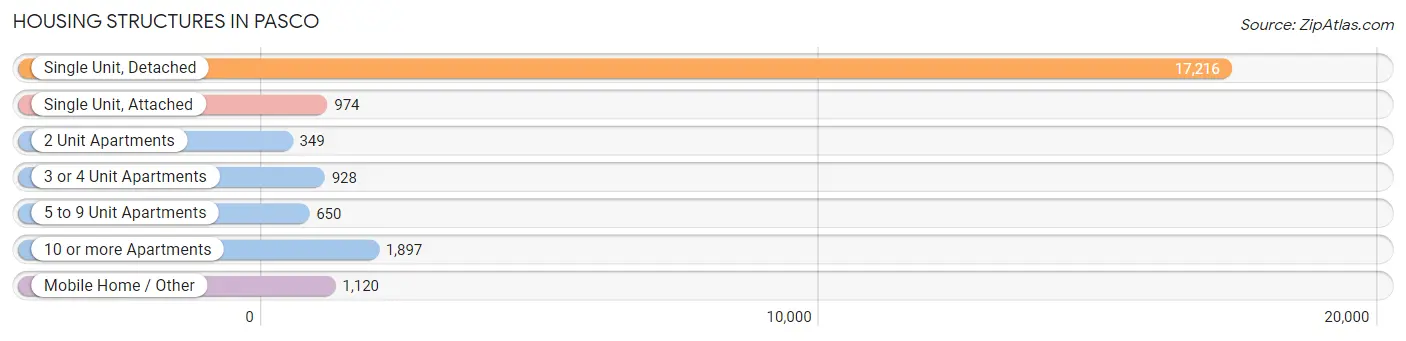
| Structure Type | # Housing Units | % Housing Units |
| Single Unit, Detached | 17,216 | 74.4% |
| Single Unit, Attached | 974 | 4.2% |
| 2 Unit Apartments | 349 | 1.5% |
| 3 or 4 Unit Apartments | 928 | 4.0% |
| 5 to 9 Unit Apartments | 650 | 2.8% |
| 10 or more Apartments | 1,897 | 8.2% |
| Mobile Home / Other | 1,120 | 4.8% |
| Total | 23,134 | 100.0% |
Housing Structures by Occupancy in Pasco
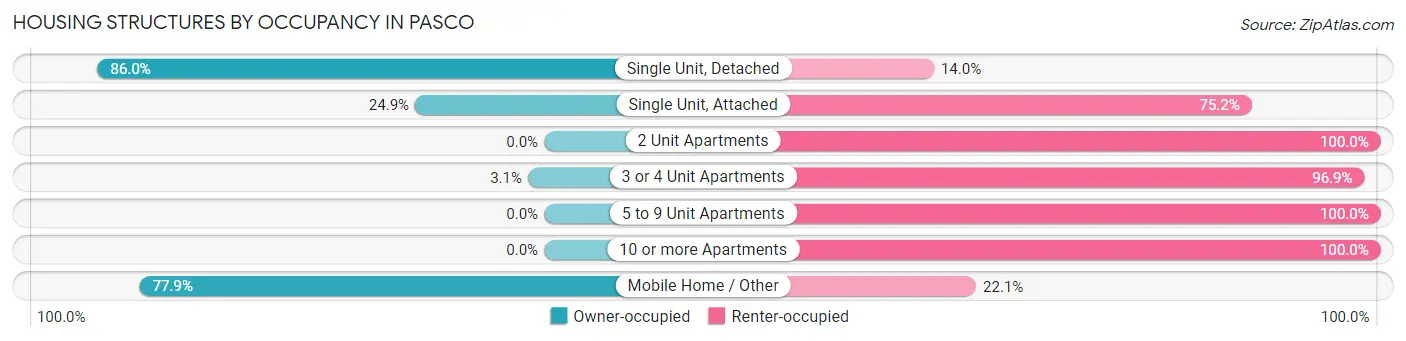
| Structure Type | Owner-occupied | Renter-occupied |
| Single Unit, Detached | 14,803 (86.0%) | 2,413 (14.0%) |
| Single Unit, Attached | 242 (24.8%) | 732 (75.1%) |
| 2 Unit Apartments | 0 (0.0%) | 349 (100.0%) |
| 3 or 4 Unit Apartments | 29 (3.1%) | 899 (96.9%) |
| 5 to 9 Unit Apartments | 0 (0.0%) | 650 (100.0%) |
| 10 or more Apartments | 0 (0.0%) | 1,897 (100.0%) |
| Mobile Home / Other | 872 (77.9%) | 248 (22.1%) |
| Total | 15,946 (68.9%) | 7,188 (31.1%) |
Housing Structures by Number of Rooms in Pasco
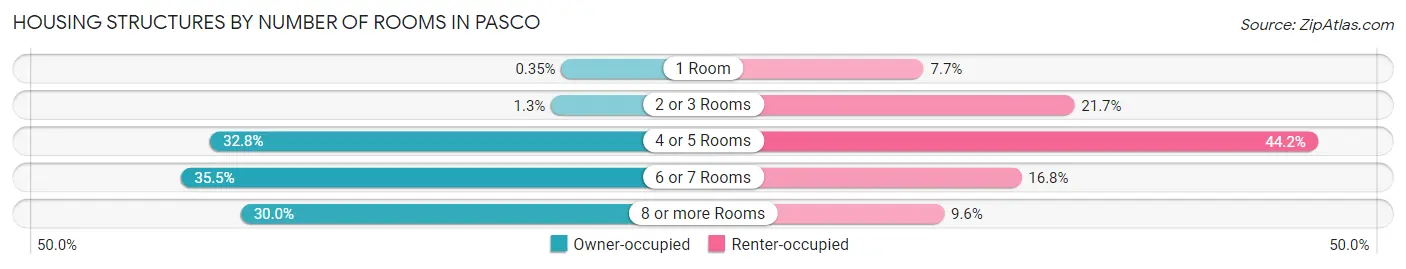
| Number of Rooms | Owner-occupied | Renter-occupied |
| 1 Room | 56 (0.4%) | 556 (7.7%) |
| 2 or 3 Rooms | 208 (1.3%) | 1,558 (21.7%) |
| 4 or 5 Rooms | 5,236 (32.8%) | 3,176 (44.2%) |
| 6 or 7 Rooms | 5,661 (35.5%) | 1,206 (16.8%) |
| 8 or more Rooms | 4,785 (30.0%) | 692 (9.6%) |
| Total | 15,946 (100.0%) | 7,188 (100.0%) |
Housing Structure by Heating Type in Pasco
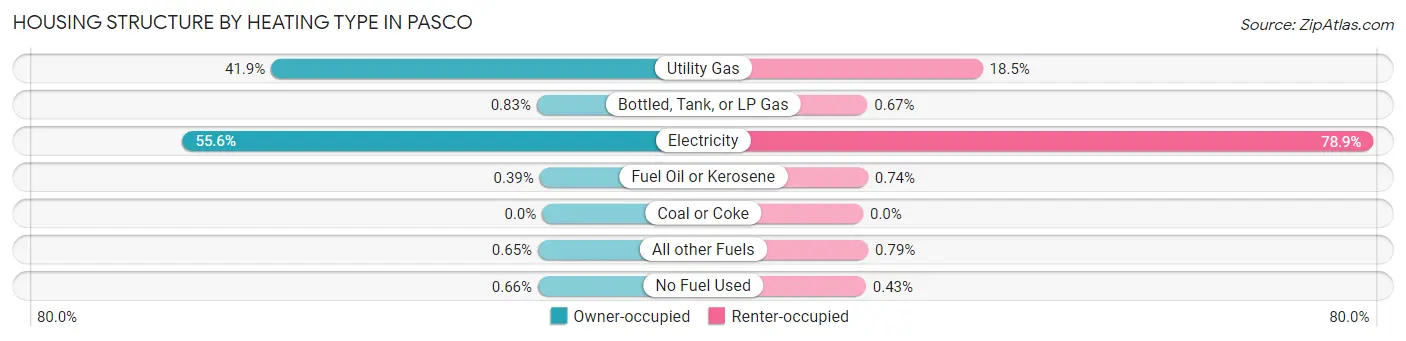
| Heating Type | Owner-occupied | Renter-occupied |
| Utility Gas | 6,681 (41.9%) | 1,329 (18.5%) |
| Bottled, Tank, or LP Gas | 132 (0.8%) | 48 (0.7%) |
| Electricity | 8,862 (55.6%) | 5,670 (78.9%) |
| Fuel Oil or Kerosene | 62 (0.4%) | 53 (0.7%) |
| Coal or Coke | 0 (0.0%) | 0 (0.0%) |
| All other Fuels | 104 (0.6%) | 57 (0.8%) |
| No Fuel Used | 105 (0.7%) | 31 (0.4%) |
| Total | 15,946 (100.0%) | 7,188 (100.0%) |
Household Vehicle Usage in Pasco
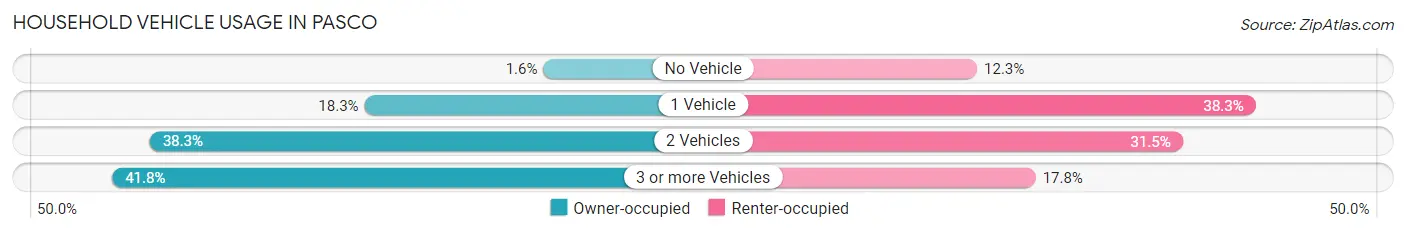
| Vehicles per Household | Owner-occupied | Renter-occupied |
| No Vehicle | 252 (1.6%) | 887 (12.3%) |
| 1 Vehicle | 2,915 (18.3%) | 2,755 (38.3%) |
| 2 Vehicles | 6,110 (38.3%) | 2,266 (31.5%) |
| 3 or more Vehicles | 6,669 (41.8%) | 1,280 (17.8%) |
| Total | 15,946 (100.0%) | 7,188 (100.0%) |
Real Estate & Mortgages in Pasco
Real Estate and Mortgage Overview in Pasco
| Characteristic | Without Mortgage | With Mortgage |
| Housing Units | 4,434 | 11,512 |
| Median Property Value | $259,700 | $321,500 |
| Median Household Income | $71,648 | $2,795 |
| Monthly Housing Costs | $495 | $577 |
| Real Estate Taxes | $2,258 | $172 |
Property Value by Mortgage Status in Pasco
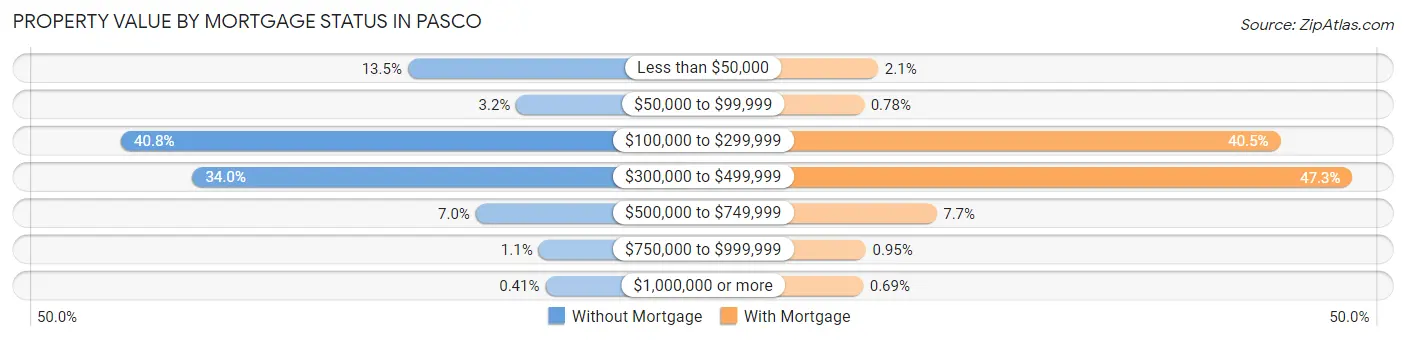
| Property Value | Without Mortgage | With Mortgage |
| Less than $50,000 | 599 (13.5%) | 245 (2.1%) |
| $50,000 to $99,999 | 141 (3.2%) | 90 (0.8%) |
| $100,000 to $299,999 | 1,809 (40.8%) | 4,658 (40.5%) |
| $300,000 to $499,999 | 1,508 (34.0%) | 5,446 (47.3%) |
| $500,000 to $749,999 | 312 (7.0%) | 885 (7.7%) |
| $750,000 to $999,999 | 47 (1.1%) | 109 (0.9%) |
| $1,000,000 or more | 18 (0.4%) | 79 (0.7%) |
| Total | 4,434 (100.0%) | 11,512 (100.0%) |
Household Income by Mortgage Status in Pasco
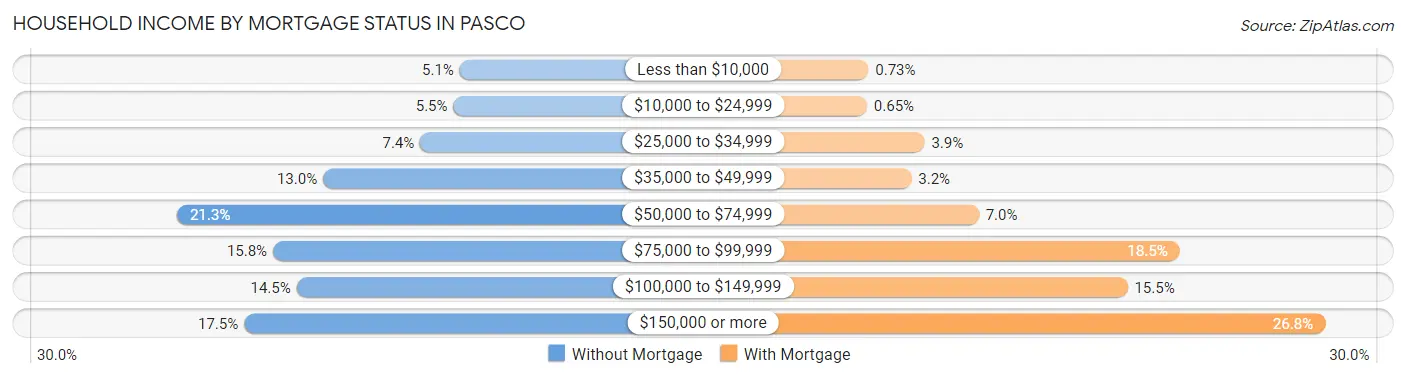
| Household Income | Without Mortgage | With Mortgage |
| Less than $10,000 | 228 (5.1%) | 84 (0.7%) |
| $10,000 to $24,999 | 244 (5.5%) | 75 (0.6%) |
| $25,000 to $34,999 | 328 (7.4%) | 454 (3.9%) |
| $35,000 to $49,999 | 574 (13.0%) | 367 (3.2%) |
| $50,000 to $74,999 | 944 (21.3%) | 811 (7.0%) |
| $75,000 to $99,999 | 701 (15.8%) | 2,132 (18.5%) |
| $100,000 to $149,999 | 641 (14.5%) | 1,789 (15.5%) |
| $150,000 or more | 774 (17.5%) | 3,089 (26.8%) |
| Total | 4,434 (100.0%) | 11,512 (100.0%) |
Property Value to Household Income Ratio in Pasco
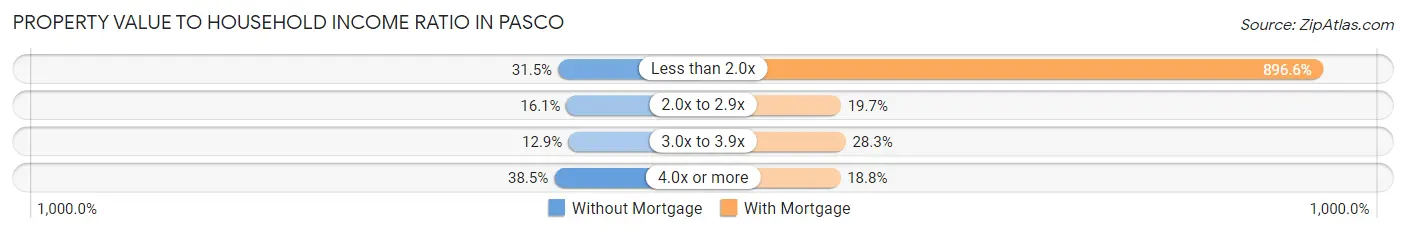
| Value-to-Income Ratio | Without Mortgage | With Mortgage |
| Less than 2.0x | 1,395 (31.5%) | 103,219 (896.6%) |
| 2.0x to 2.9x | 714 (16.1%) | 2,263 (19.7%) |
| 3.0x to 3.9x | 572 (12.9%) | 3,253 (28.3%) |
| 4.0x or more | 1,705 (38.5%) | 2,160 (18.8%) |
| Total | 4,434 (100.0%) | 11,512 (100.0%) |
Real Estate Taxes by Mortgage Status in Pasco
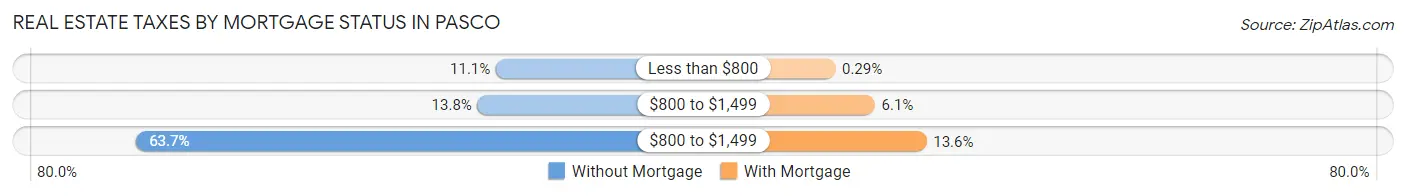
| Property Taxes | Without Mortgage | With Mortgage |
| Less than $800 | 492 (11.1%) | 33 (0.3%) |
| $800 to $1,499 | 612 (13.8%) | 699 (6.1%) |
| $800 to $1,499 | 2,824 (63.7%) | 1,568 (13.6%) |
| Total | 4,434 (100.0%) | 11,512 (100.0%) |
Health & Disability in Pasco
Health Insurance Coverage by Age in Pasco
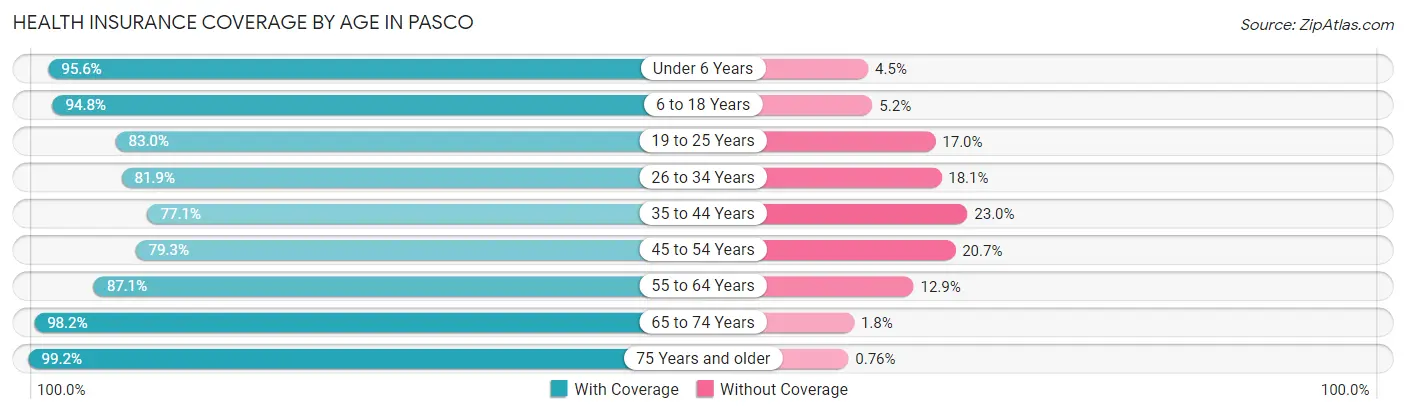
| Age Bracket | With Coverage | Without Coverage |
| Under 6 Years | 7,831 (95.6%) | 365 (4.4%) |
| 6 to 18 Years | 17,227 (94.8%) | 953 (5.2%) |
| 19 to 25 Years | 6,201 (83.0%) | 1,268 (17.0%) |
| 26 to 34 Years | 9,066 (81.9%) | 2,002 (18.1%) |
| 35 to 44 Years | 7,950 (77.0%) | 2,368 (23.0%) |
| 45 to 54 Years | 6,487 (79.3%) | 1,692 (20.7%) |
| 55 to 64 Years | 5,443 (87.1%) | 807 (12.9%) |
| 65 to 74 Years | 4,593 (98.2%) | 84 (1.8%) |
| 75 Years and older | 2,485 (99.2%) | 19 (0.8%) |
| Total | 67,283 (87.6%) | 9,558 (12.4%) |
Health Insurance Coverage by Citizenship Status in Pasco
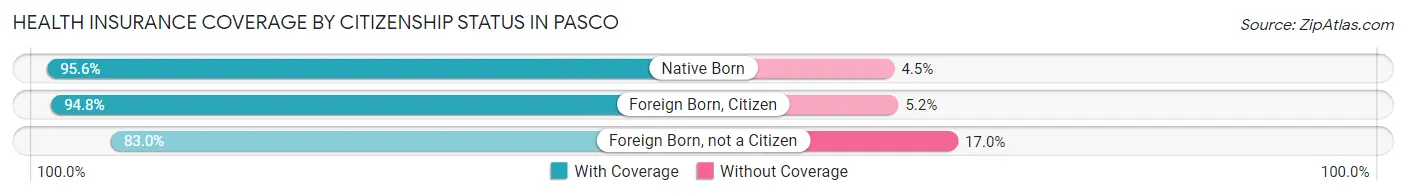
| Citizenship Status | With Coverage | Without Coverage |
| Native Born | 7,831 (95.6%) | 365 (4.4%) |
| Foreign Born, Citizen | 17,227 (94.8%) | 953 (5.2%) |
| Foreign Born, not a Citizen | 6,201 (83.0%) | 1,268 (17.0%) |
Health Insurance Coverage by Household Income in Pasco
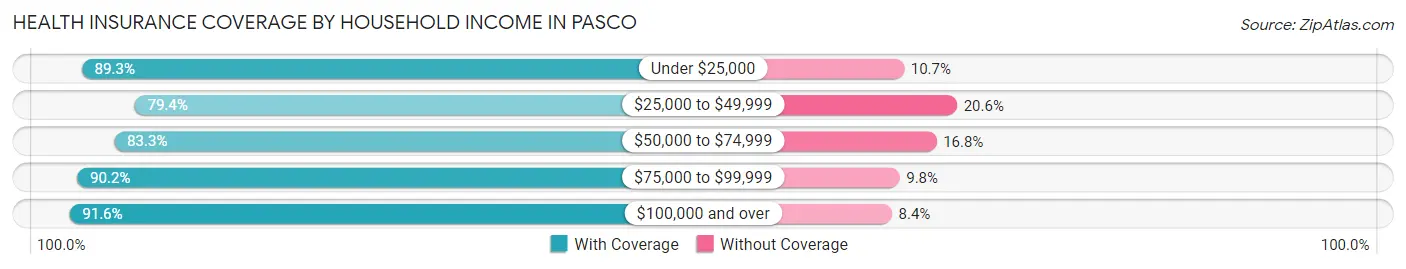
| Household Income | With Coverage | Without Coverage |
| Under $25,000 | 5,903 (89.3%) | 706 (10.7%) |
| $25,000 to $49,999 | 9,893 (79.4%) | 2,567 (20.6%) |
| $50,000 to $74,999 | 12,688 (83.3%) | 2,553 (16.8%) |
| $75,000 to $99,999 | 10,921 (90.2%) | 1,191 (9.8%) |
| $100,000 and over | 27,663 (91.6%) | 2,534 (8.4%) |
Public vs Private Health Insurance Coverage by Age in Pasco
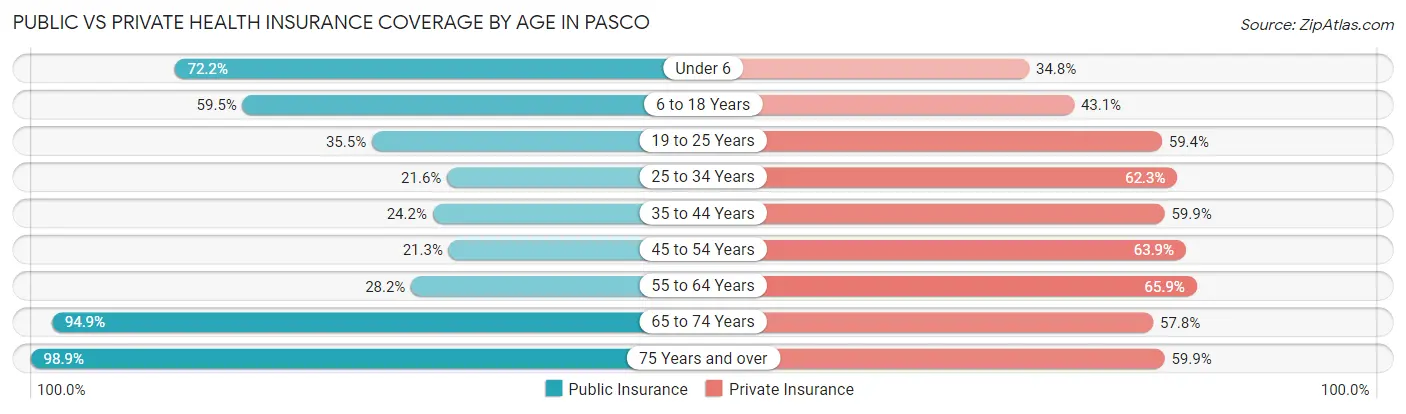
| Age Bracket | Public Insurance | Private Insurance |
| Under 6 | 5,914 (72.2%) | 2,849 (34.8%) |
| 6 to 18 Years | 10,823 (59.5%) | 7,834 (43.1%) |
| 19 to 25 Years | 2,653 (35.5%) | 4,436 (59.4%) |
| 25 to 34 Years | 2,387 (21.6%) | 6,892 (62.3%) |
| 35 to 44 Years | 2,501 (24.2%) | 6,180 (59.9%) |
| 45 to 54 Years | 1,740 (21.3%) | 5,223 (63.9%) |
| 55 to 64 Years | 1,765 (28.2%) | 4,116 (65.9%) |
| 65 to 74 Years | 4,440 (94.9%) | 2,702 (57.8%) |
| 75 Years and over | 2,476 (98.9%) | 1,500 (59.9%) |
| Total | 34,699 (45.2%) | 41,732 (54.3%) |
Disability Status by Sex by Age in Pasco
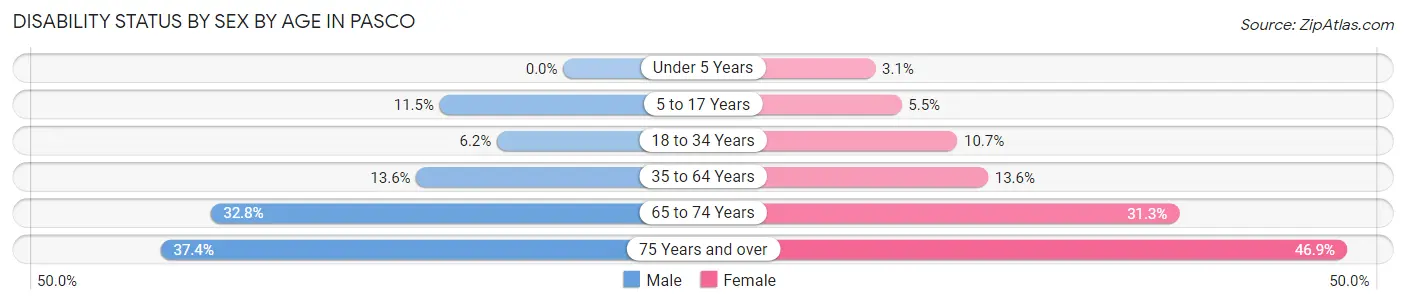
| Age Bracket | Male | Female |
| Under 5 Years | 0 (0.0%) | 96 (3.1%) |
| 5 to 17 Years | 1,053 (11.5%) | 519 (5.5%) |
| 18 to 34 Years | 621 (6.1%) | 1,035 (10.7%) |
| 35 to 64 Years | 1,718 (13.6%) | 1,646 (13.6%) |
| 65 to 74 Years | 760 (32.8%) | 738 (31.3%) |
| 75 Years and over | 397 (37.4%) | 676 (46.9%) |
Disability Class by Sex by Age in Pasco
Disability Class: Hearing Difficulty
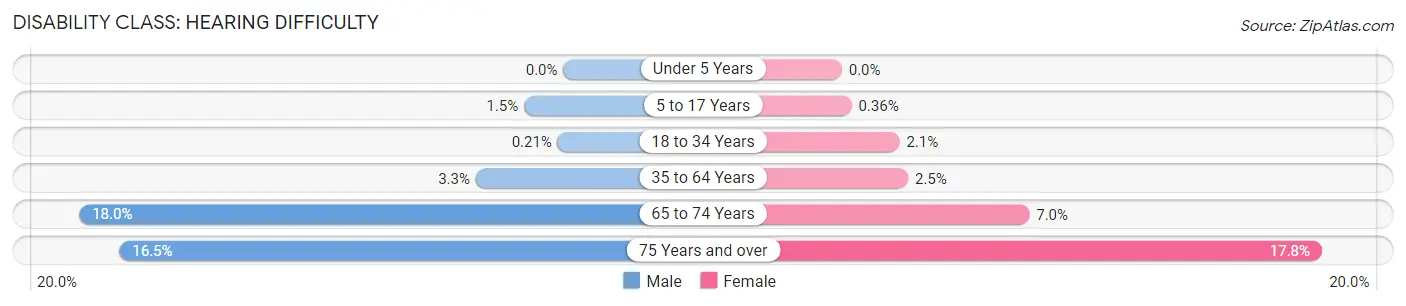
| Age Bracket | Male | Female |
| Under 5 Years | 0 (0.0%) | 0 (0.0%) |
| 5 to 17 Years | 134 (1.5%) | 34 (0.4%) |
| 18 to 34 Years | 21 (0.2%) | 207 (2.1%) |
| 35 to 64 Years | 409 (3.3%) | 299 (2.5%) |
| 65 to 74 Years | 417 (18.0%) | 164 (7.0%) |
| 75 Years and over | 175 (16.5%) | 257 (17.8%) |
Disability Class: Vision Difficulty
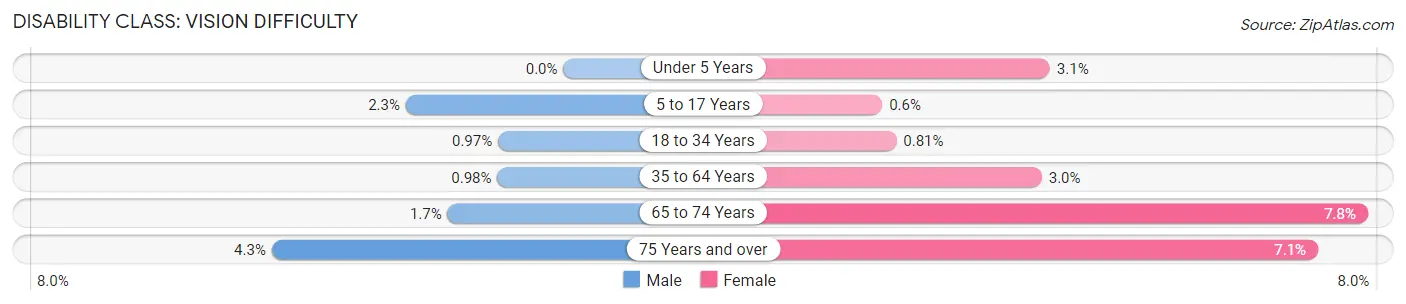
| Age Bracket | Male | Female |
| Under 5 Years | 0 (0.0%) | 96 (3.1%) |
| 5 to 17 Years | 215 (2.3%) | 56 (0.6%) |
| 18 to 34 Years | 98 (1.0%) | 78 (0.8%) |
| 35 to 64 Years | 124 (1.0%) | 361 (3.0%) |
| 65 to 74 Years | 40 (1.7%) | 184 (7.8%) |
| 75 Years and over | 46 (4.3%) | 102 (7.1%) |
Disability Class: Cognitive Difficulty
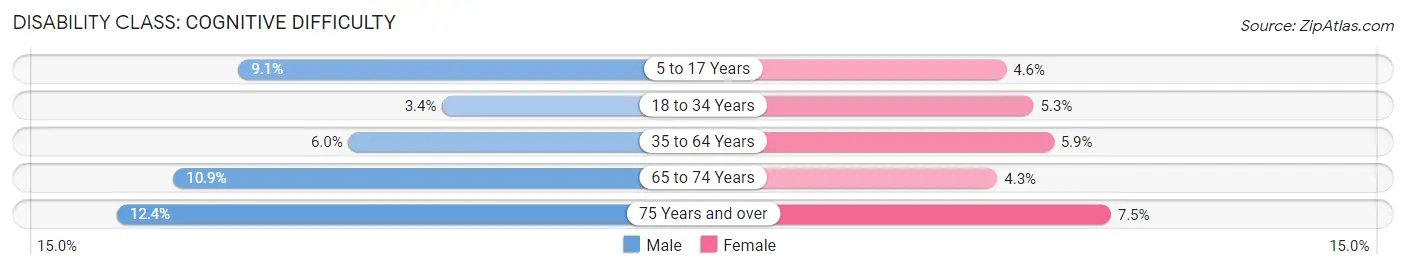
| Age Bracket | Male | Female |
| 5 to 17 Years | 831 (9.0%) | 430 (4.6%) |
| 18 to 34 Years | 340 (3.4%) | 517 (5.3%) |
| 35 to 64 Years | 753 (6.0%) | 717 (5.9%) |
| 65 to 74 Years | 252 (10.9%) | 102 (4.3%) |
| 75 Years and over | 132 (12.4%) | 108 (7.5%) |
Disability Class: Ambulatory Difficulty
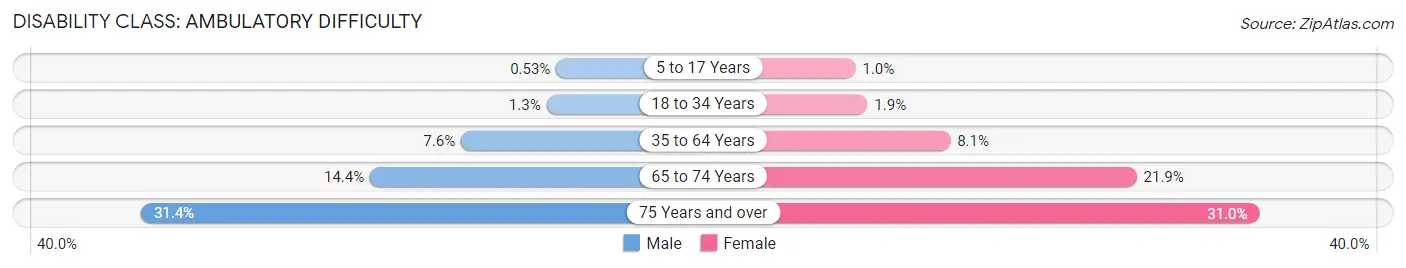
| Age Bracket | Male | Female |
| 5 to 17 Years | 49 (0.5%) | 96 (1.0%) |
| 18 to 34 Years | 126 (1.3%) | 184 (1.9%) |
| 35 to 64 Years | 957 (7.6%) | 978 (8.1%) |
| 65 to 74 Years | 333 (14.3%) | 516 (21.9%) |
| 75 Years and over | 333 (31.4%) | 447 (31.0%) |
Disability Class: Self-Care Difficulty
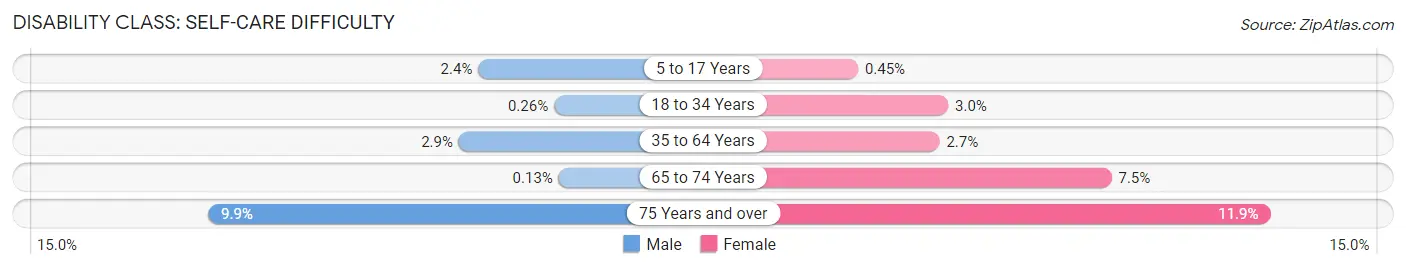
| Age Bracket | Male | Female |
| 5 to 17 Years | 218 (2.4%) | 42 (0.4%) |
| 18 to 34 Years | 26 (0.3%) | 286 (3.0%) |
| 35 to 64 Years | 366 (2.9%) | 330 (2.7%) |
| 65 to 74 Years | 3 (0.1%) | 177 (7.5%) |
| 75 Years and over | 105 (9.9%) | 172 (11.9%) |
Technology Access in Pasco
Computing Device Access in Pasco
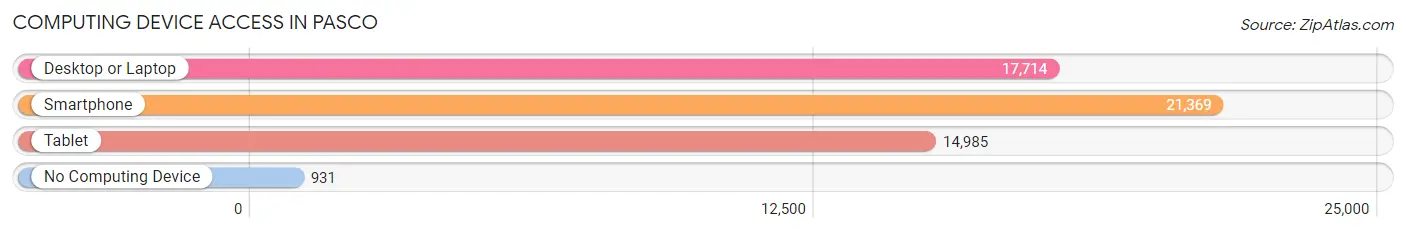
| Device Type | # Households | % Households |
| Desktop or Laptop | 17,714 | 76.6% |
| Smartphone | 21,369 | 92.4% |
| Tablet | 14,985 | 64.8% |
| No Computing Device | 931 | 4.0% |
| Total | 23,134 | 100.0% |
Internet Access in Pasco
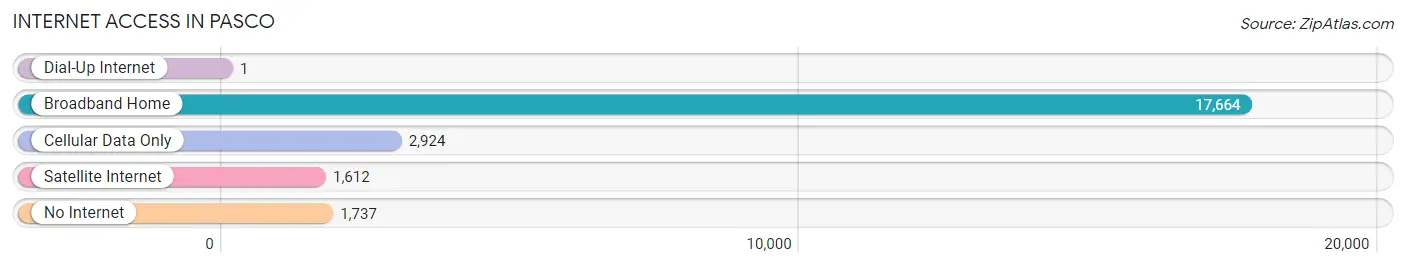
| Internet Type | # Households | % Households |
| Dial-Up Internet | 1 | 0.0% |
| Broadband Home | 17,664 | 76.4% |
| Cellular Data Only | 2,924 | 12.6% |
| Satellite Internet | 1,612 | 7.0% |
| No Internet | 1,737 | 7.5% |
| Total | 23,134 | 100.0% |
Pasco Summary
Pasco, Washington is a city located in Franklin County in the southeastern part of the state. It is situated at the confluence of the Columbia and Snake Rivers, and is part of the Tri-Cities metropolitan area, which also includes the cities of Kennewick and Richland. The city has a population of 68,845 as of 2019, making it the third-largest city in the state.
History
The area that is now Pasco was originally inhabited by the Yakama, Umatilla, and Walla Walla Native American tribes. The first European settlers arrived in the area in the early 1800s, and the city was officially incorporated in 1891. The city was named after Ceran de Hault de Lassus de St. Vrain, who was a French-Canadian fur trader who had settled in the area in the late 1700s.
The city grew rapidly in the early 20th century, due to the construction of the Grand Coulee Dam and the Hanford Nuclear Reservation. The city was also a major hub for the Union Pacific Railroad, and the city's economy was largely based on agriculture and the railroad.
Geography
Pasco is located in southeastern Washington, at the confluence of the Columbia and Snake Rivers. The city is situated in the Columbia Basin, which is a large, flat area of land that is surrounded by mountains. The city is located in the Columbia Plateau, which is a region of rolling hills and valleys. The city is located at an elevation of 486 feet above sea level.
The climate in Pasco is semi-arid, with hot summers and cold winters. The average annual temperature is around 50 degrees Fahrenheit, and the average annual precipitation is around 10 inches.
Economy
Pasco's economy is largely based on agriculture, manufacturing, and services. The city is home to several large agricultural companies, including Lamb Weston, a potato processing company, and Columbia Fruit Packers, a fruit processing company. The city is also home to several manufacturing companies, including a Boeing plant and a Tyson Foods plant.
The city is also home to several service-based businesses, including healthcare, retail, and hospitality. The city is home to several hospitals, including Trios Health and Lourdes Medical Center. The city is also home to several retail stores, including Walmart, Target, and Kohl's.
Demographics
As of 2019, the population of Pasco was 68,845. The city has a diverse population, with the largest ethnic groups being Hispanic (44.3%), White (37.2%), and Asian (7.2%). The median household income in the city is $45,845, and the median home value is $179,400. The city has a poverty rate of 17.3%, and the unemployment rate is 5.2%.
Conclusion
Pasco, Washington is a city located in Franklin County in the southeastern part of the state. It is situated at the confluence of the Columbia and Snake Rivers, and is part of the Tri-Cities metropolitan area. The city has a population of 68,845 as of 2019, and its economy is largely based on agriculture, manufacturing, and services. The city has a diverse population, with the largest ethnic groups being Hispanic, White, and Asian. The median household income in the city is $45,845, and the median home value is $179,400. The city has a poverty rate of 17.3%, and the unemployment rate is 5.2%.
Common Questions
What is Per Capita Income in Pasco?
Per Capita income in Pasco is $30,242.
What is the Median Family Income in Pasco?
Median Family Income in Pasco is $79,877.
What is the Median Household income in Pasco?
Median Household Income in Pasco is $75,316.
What is Income or Wage Gap in Pasco?
Income or Wage Gap in Pasco is 29.4%.
Women in Pasco earn 70.6 cents for every dollar earned by a man.
What is Family Income Deficit in Pasco?
Family Income Deficit in Pasco is $12,044.
Families that are below poverty line in Pasco earn $12,044 less on average than the poverty threshold level.
What is Inequality or Gini Index in Pasco?
Inequality or Gini Index in Pasco is 0.41.
What is the Total Population of Pasco?
Total Population of Pasco is 77,274.
What is the Total Male Population of Pasco?
Total Male Population of Pasco is 39,102.
What is the Total Female Population of Pasco?
Total Female Population of Pasco is 38,172.
What is the Ratio of Males per 100 Females in Pasco?
There are 102.44 Males per 100 Females in Pasco.
What is the Ratio of Females per 100 Males in Pasco?
There are 97.62 Females per 100 Males in Pasco.
What is the Median Population Age in Pasco?
Median Population Age in Pasco is 30.1 Years.
What is the Average Family Size in Pasco
Average Family Size in Pasco is 3.7 People.
What is the Average Household Size in Pasco
Average Household Size in Pasco is 3.3 People.
How Large is the Labor Force in Pasco?
There are 37,297 People in the Labor Forcein in Pasco.
What is the Percentage of People in the Labor Force in Pasco?
67.7% of People are in the Labor Force in Pasco.
What is the Unemployment Rate in Pasco?
Unemployment Rate in Pasco is 5.8%.