Entiat, WA Map & Demographics
Entiat Map
Entiat Overview
$38,019
PER CAPITA INCOME
$86,063
AVG FAMILY INCOME
$75,978
AVG HOUSEHOLD INCOME
6.0%
WAGE / INCOME GAP [ % ]
94.0¢/ $1
WAGE / INCOME GAP [ $ ]
0.43
INEQUALITY / GINI INDEX
1,038
TOTAL POPULATION
503
MALE POPULATION
535
FEMALE POPULATION
94.02
MALES / 100 FEMALES
106.36
FEMALES / 100 MALES
42.3
MEDIAN AGE
3.2
AVG FAMILY SIZE
2.6
AVG HOUSEHOLD SIZE
600
LABOR FORCE [ PEOPLE ]
64.4%
PERCENT IN LABOR FORCE
5.5%
UNEMPLOYMENT RATE
Entiat Zip Codes
Entiat Area Codes
Income in Entiat
Income Overview in Entiat
Per Capita Income in Entiat is $38,019, while median incomes of families and households are $86,063 and $75,978 respectively.
| Characteristic | Number | Measure |
| Per Capita Income | 1,038 | $38,019 |
| Median Family Income | 251 | $86,063 |
| Mean Family Income | 251 | $117,172 |
| Median Household Income | 396 | $75,978 |
| Mean Household Income | 396 | $95,271 |
| Income Deficit | 251 | $0 |
| Wage / Income Gap (%) | 1,038 | 5.95% |
| Wage / Income Gap ($) | 1,038 | 94.05¢ per $1 |
| Gini / Inequality Index | 1,038 | 0.43 |
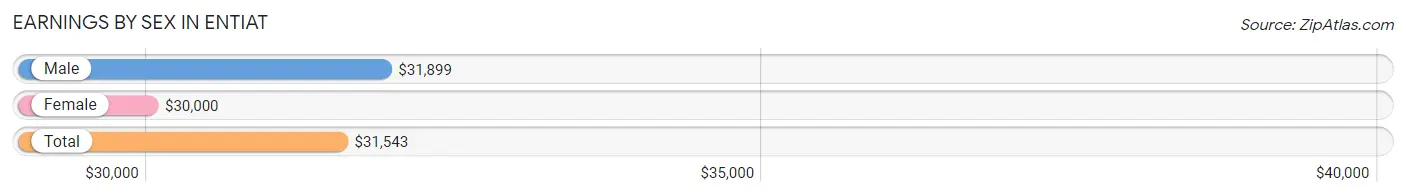
Earnings by Sex in Entiat
Average Earnings in Entiat are $31,543, $31,899 for men and $30,000 for women, a difference of 5.9%.
| Sex | Number | Average Earnings |
| Male | 311 (51.9%) | $31,899 |
| Female | 288 (48.1%) | $30,000 |
| Total | 599 (100.0%) | $31,543 |
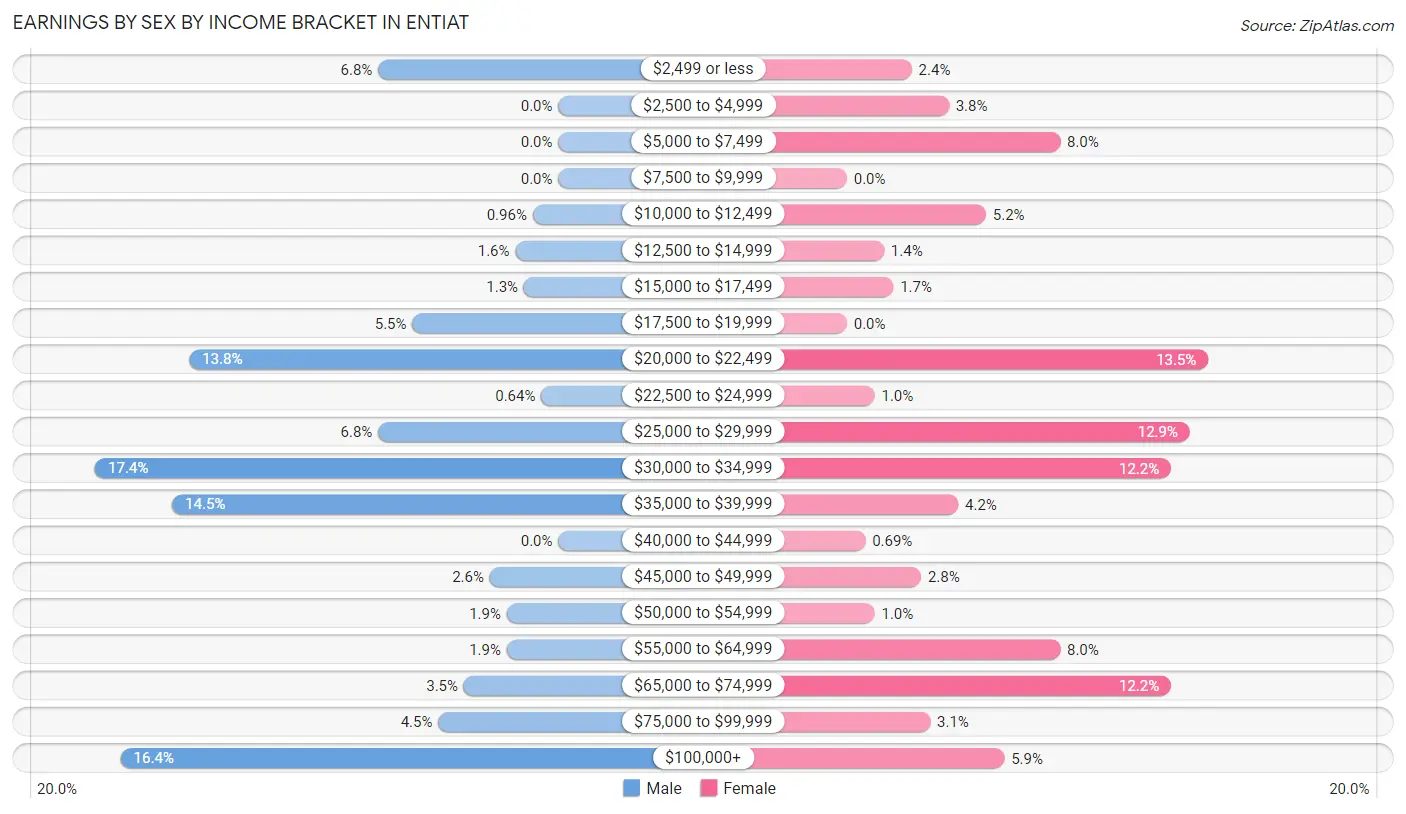
Earnings by Sex by Income Bracket in Entiat
The most common earnings brackets in Entiat are $30,000 to $34,999 for men (54 | 17.4%) and $20,000 to $22,499 for women (39 | 13.5%).
| Income | Male | Female |
| $2,499 or less | 21 (6.8%) | 7 (2.4%) |
| $2,500 to $4,999 | 0 (0.0%) | 11 (3.8%) |
| $5,000 to $7,499 | 0 (0.0%) | 23 (8.0%) |
| $7,500 to $9,999 | 0 (0.0%) | 0 (0.0%) |
| $10,000 to $12,499 | 3 (1.0%) | 15 (5.2%) |
| $12,500 to $14,999 | 5 (1.6%) | 4 (1.4%) |
| $15,000 to $17,499 | 4 (1.3%) | 5 (1.7%) |
| $17,500 to $19,999 | 17 (5.5%) | 0 (0.0%) |
| $20,000 to $22,499 | 43 (13.8%) | 39 (13.5%) |
| $22,500 to $24,999 | 2 (0.6%) | 3 (1.0%) |
| $25,000 to $29,999 | 21 (6.8%) | 37 (12.9%) |
| $30,000 to $34,999 | 54 (17.4%) | 35 (12.1%) |
| $35,000 to $39,999 | 45 (14.5%) | 12 (4.2%) |
| $40,000 to $44,999 | 0 (0.0%) | 2 (0.7%) |
| $45,000 to $49,999 | 8 (2.6%) | 8 (2.8%) |
| $50,000 to $54,999 | 6 (1.9%) | 3 (1.0%) |
| $55,000 to $64,999 | 6 (1.9%) | 23 (8.0%) |
| $65,000 to $74,999 | 11 (3.5%) | 35 (12.1%) |
| $75,000 to $99,999 | 14 (4.5%) | 9 (3.1%) |
| $100,000+ | 51 (16.4%) | 17 (5.9%) |
| Total | 311 (100.0%) | 288 (100.0%) |
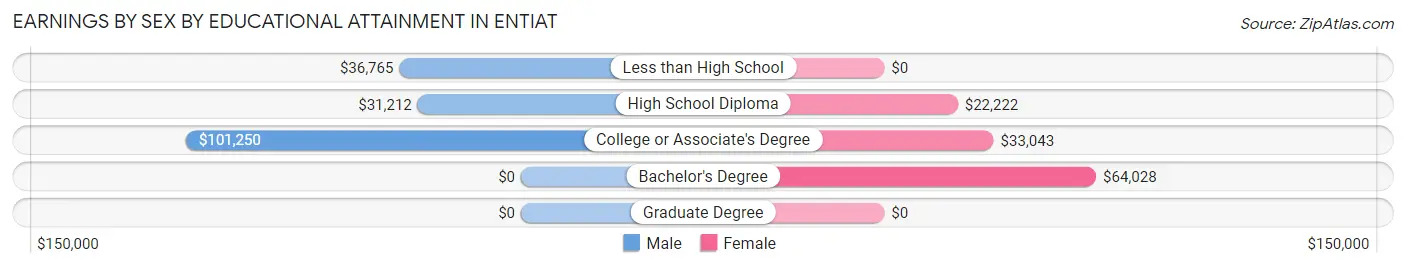
Earnings by Sex by Educational Attainment in Entiat
Average earnings in Entiat are $37,778 for men and $32,772 for women, a difference of 13.3%. Men with an educational attainment of college or associate's degree enjoy the highest average annual earnings of $101,250, while those with high school diploma education earn the least with $31,212. Women with an educational attainment of bachelor's degree earn the most with the average annual earnings of $64,028, while those with high school diploma education have the smallest earnings of $22,222.
| Educational Attainment | Male Income | Female Income |
| Less than High School | $36,765 | $0 |
| High School Diploma | $31,212 | $22,222 |
| College or Associate's Degree | $101,250 | $33,043 |
| Bachelor's Degree | - | - |
| Graduate Degree | - | - |
| Total | $37,778 | $32,772 |
Family Income in Entiat
Family Income Brackets in Entiat
According to the Entiat family income data, there are 58 families falling into the $100,000 to $149,999 income range, which is the most common income bracket and makes up 23.1% of all families. Conversely, the $10,000 to $14,999 income bracket is the least frequent group with only 1 families (0.4%) belonging to this category.
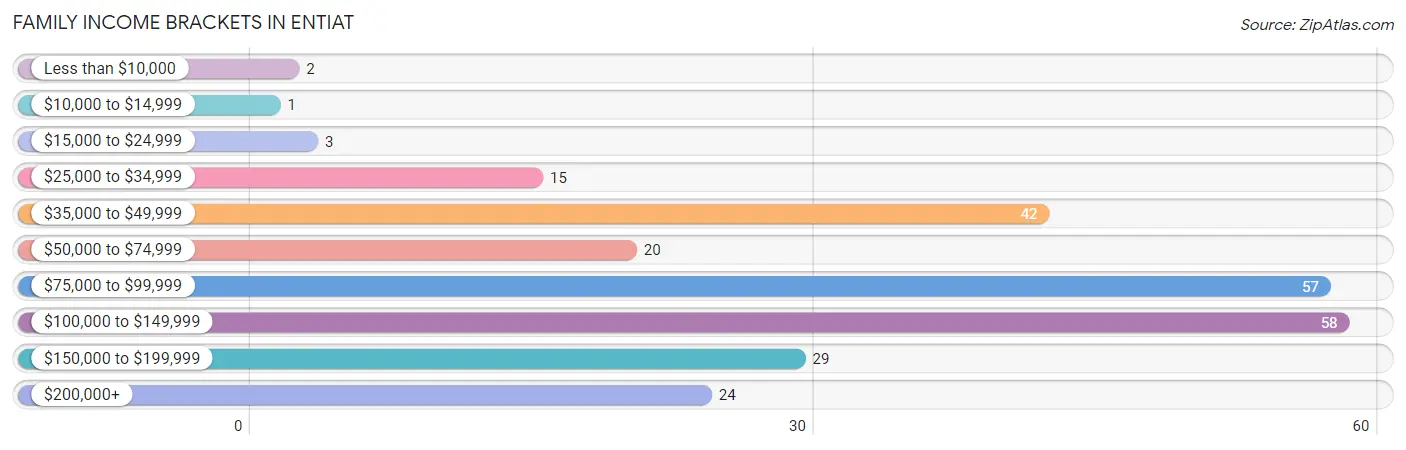
| Income Bracket | # Families | % Families |
| Less than $10,000 | 2 | 0.8% |
| $10,000 to $14,999 | 1 | 0.4% |
| $15,000 to $24,999 | 3 | 1.2% |
| $25,000 to $34,999 | 15 | 6.0% |
| $35,000 to $49,999 | 42 | 16.7% |
| $50,000 to $74,999 | 20 | 8.0% |
| $75,000 to $99,999 | 57 | 22.7% |
| $100,000 to $149,999 | 58 | 23.1% |
| $150,000 to $199,999 | 29 | 11.6% |
| $200,000+ | 24 | 9.6% |
Family Income by Famaliy Size in Entiat
4-person families (42 | 16.7%) account for the highest median family income in Entiat with $103,333 per family, while 2-person families (120 | 47.8%) have the highest median income of $42,969 per family member.
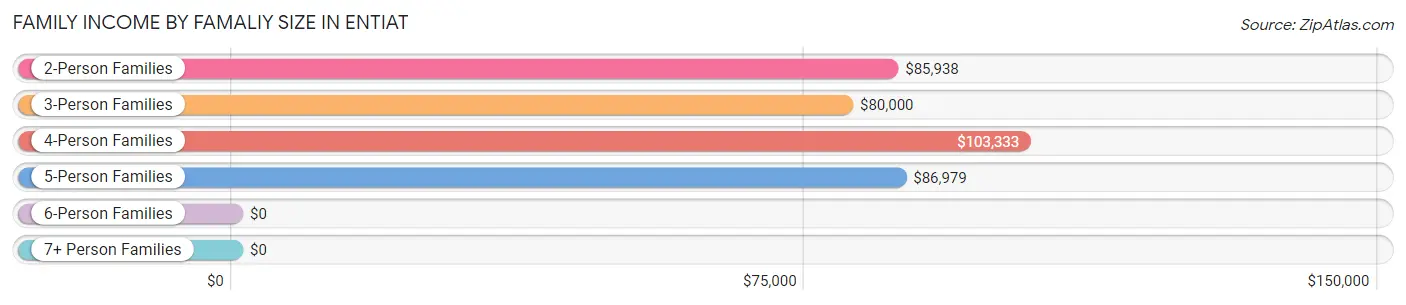
| Income Bracket | # Families | Median Income |
| 2-Person Families | 120 (47.8%) | $85,938 |
| 3-Person Families | 66 (26.3%) | $80,000 |
| 4-Person Families | 42 (16.7%) | $103,333 |
| 5-Person Families | 19 (7.6%) | $86,979 |
| 6-Person Families | 4 (1.6%) | $0 |
| 7+ Person Families | 0 (0.0%) | $0 |
| Total | 251 (100.0%) | $86,063 |
Family Income by Number of Earners in Entiat
The median family income in Entiat is $86,063, with families comprising 2 earners (78) having the highest median family income of $144,000, while families with no earners (52) have the lowest median family income of $46,667, accounting for 31.1% and 20.7% of families, respectively.
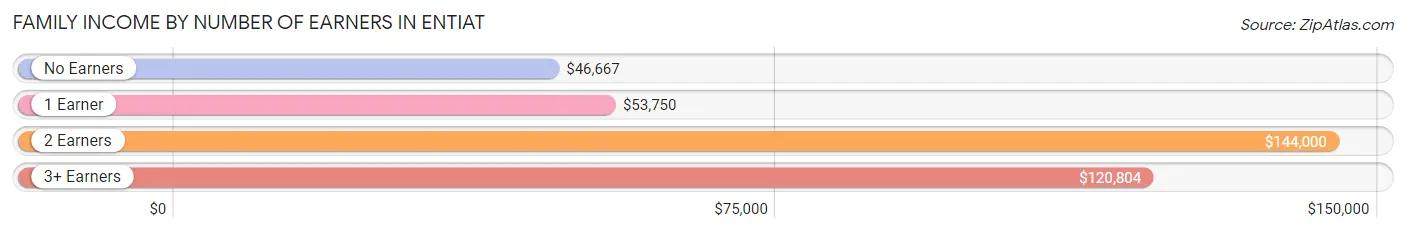
| Number of Earners | # Families | Median Income |
| No Earners | 52 (20.7%) | $46,667 |
| 1 Earner | 66 (26.3%) | $53,750 |
| 2 Earners | 78 (31.1%) | $144,000 |
| 3+ Earners | 55 (21.9%) | $120,804 |
| Total | 251 (100.0%) | $86,063 |
Household Income in Entiat
Household Income Brackets in Entiat
With 80 households falling in the category, the $75,000 to $99,999 income range is the most frequent in Entiat, accounting for 20.2% of all households. In contrast, only 4 households (1.0%) fall into the $10,000 to $14,999 income bracket, making it the least populous group.
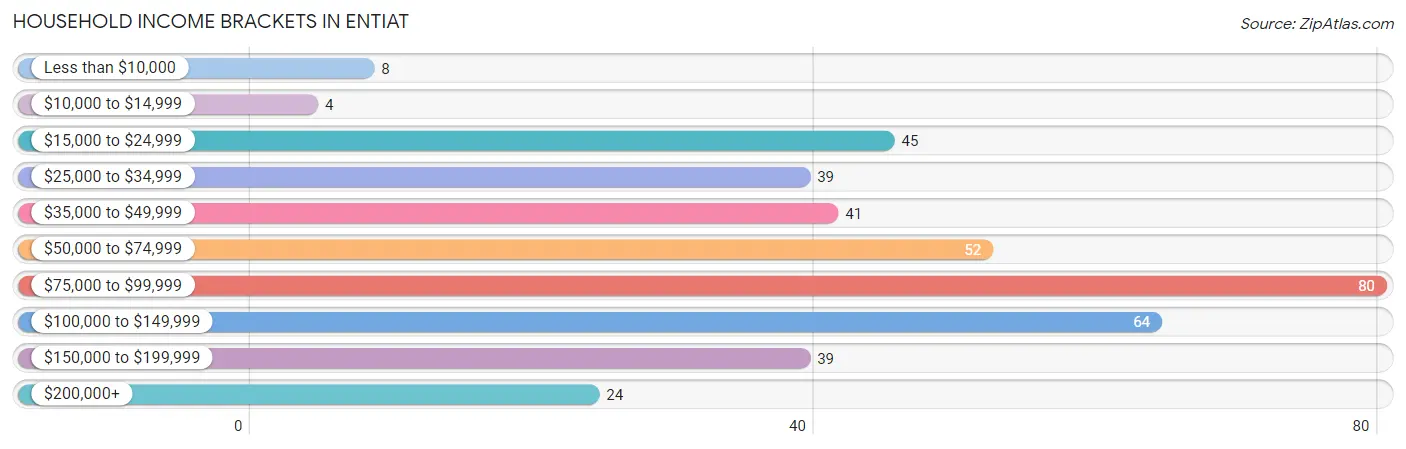
| Income Bracket | # Households | % Households |
| Less than $10,000 | 8 | 2.0% |
| $10,000 to $14,999 | 4 | 1.0% |
| $15,000 to $24,999 | 45 | 11.4% |
| $25,000 to $34,999 | 39 | 9.8% |
| $35,000 to $49,999 | 41 | 10.4% |
| $50,000 to $74,999 | 52 | 13.1% |
| $75,000 to $99,999 | 80 | 20.2% |
| $100,000 to $149,999 | 64 | 16.2% |
| $150,000 to $199,999 | 39 | 9.8% |
| $200,000+ | 24 | 6.1% |
Household Income by Householder Age in Entiat
The median household income in Entiat is $75,978, with the highest median household income of $104,844 found in the 45 to 64 years age bracket for the primary householder. A total of 141 households (35.6%) fall into this category. Meanwhile, the 15 to 24 years age bracket for the primary householder has the lowest median household income of $0, with 14 households (3.5%) in this group.
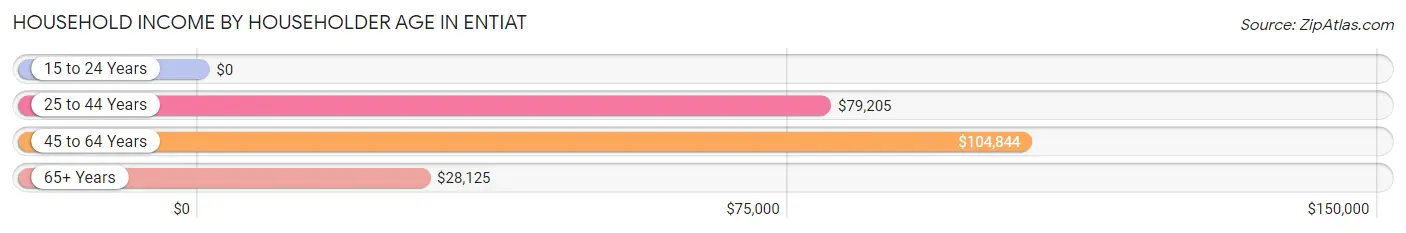
| Income Bracket | # Households | Median Income |
| 15 to 24 Years | 14 (3.5%) | $0 |
| 25 to 44 Years | 91 (23.0%) | $79,205 |
| 45 to 64 Years | 141 (35.6%) | $104,844 |
| 65+ Years | 150 (37.9%) | $28,125 |
| Total | 396 (100.0%) | $75,978 |
Poverty in Entiat
Income Below Poverty by Sex and Age in Entiat
With 3.0% poverty level for males and 4.7% for females among the residents of Entiat, 75 year old and over males and 18 to 24 year old females are the most vulnerable to poverty, with 9 males (36.0%) and 13 females (22.8%) in their respective age groups living below the poverty level.
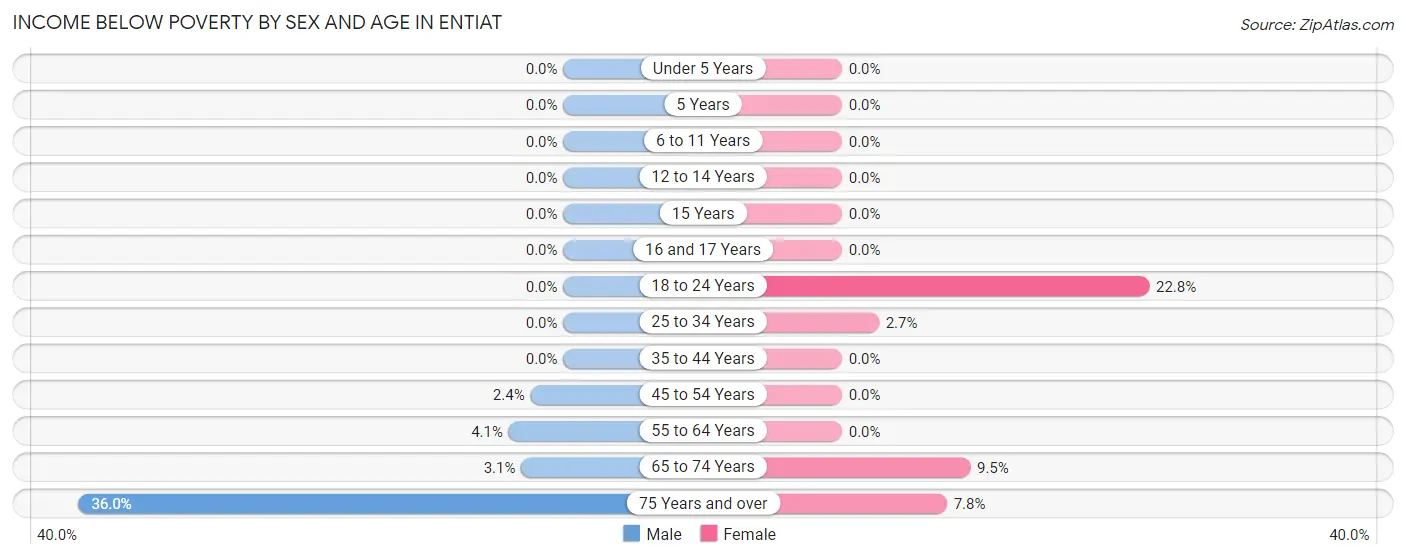
| Age Bracket | Male | Female |
| Under 5 Years | 0 (0.0%) | 0 (0.0%) |
| 5 Years | 0 (0.0%) | 0 (0.0%) |
| 6 to 11 Years | 0 (0.0%) | 0 (0.0%) |
| 12 to 14 Years | 0 (0.0%) | 0 (0.0%) |
| 15 Years | 0 (0.0%) | 0 (0.0%) |
| 16 and 17 Years | 0 (0.0%) | 0 (0.0%) |
| 18 to 24 Years | 0 (0.0%) | 13 (22.8%) |
| 25 to 34 Years | 0 (0.0%) | 2 (2.7%) |
| 35 to 44 Years | 0 (0.0%) | 0 (0.0%) |
| 45 to 54 Years | 1 (2.4%) | 0 (0.0%) |
| 55 to 64 Years | 3 (4.1%) | 0 (0.0%) |
| 65 to 74 Years | 2 (3.1%) | 4 (9.5%) |
| 75 Years and over | 9 (36.0%) | 6 (7.8%) |
| Total | 15 (3.0%) | 25 (4.7%) |
Income Above Poverty by Sex and Age in Entiat
According to the poverty statistics in Entiat, males aged 5 years and females aged under 5 years are the age groups that are most secure financially, with 100.0% of males and 100.0% of females in these age groups living above the poverty line.
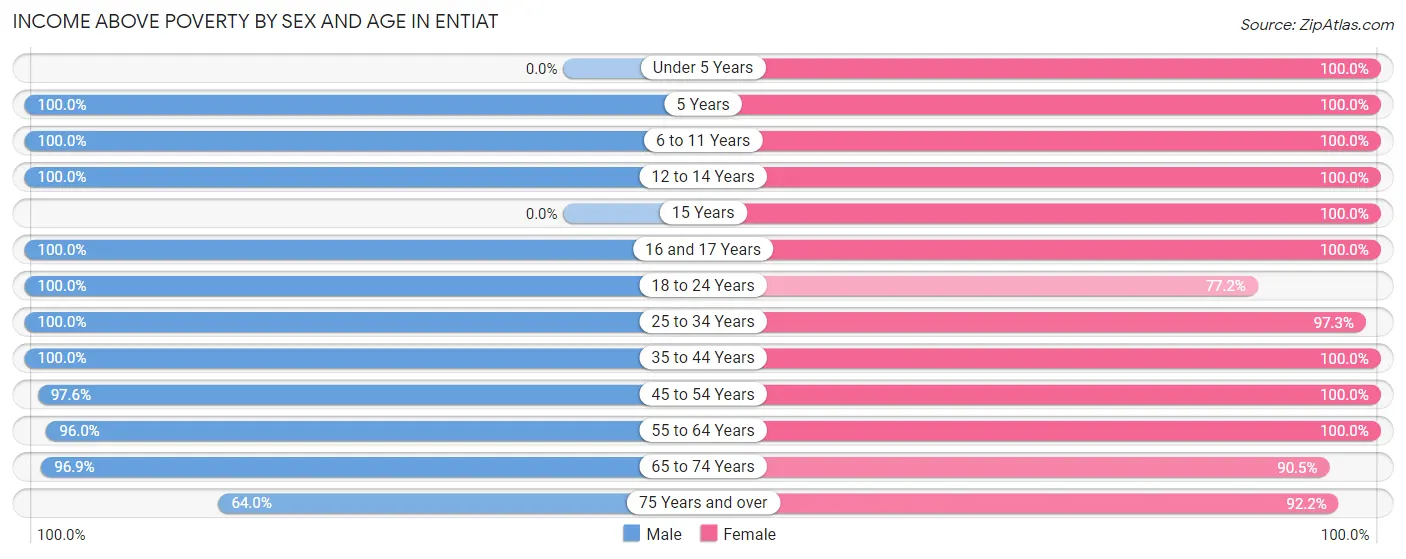
| Age Bracket | Male | Female |
| Under 5 Years | 0 (0.0%) | 30 (100.0%) |
| 5 Years | 3 (100.0%) | 12 (100.0%) |
| 6 to 11 Years | 22 (100.0%) | 16 (100.0%) |
| 12 to 14 Years | 8 (100.0%) | 11 (100.0%) |
| 15 Years | 0 (0.0%) | 5 (100.0%) |
| 16 and 17 Years | 4 (100.0%) | 17 (100.0%) |
| 18 to 24 Years | 118 (100.0%) | 44 (77.2%) |
| 25 to 34 Years | 79 (100.0%) | 71 (97.3%) |
| 35 to 44 Years | 65 (100.0%) | 61 (100.0%) |
| 45 to 54 Years | 40 (97.6%) | 60 (100.0%) |
| 55 to 64 Years | 71 (96.0%) | 74 (100.0%) |
| 65 to 74 Years | 62 (96.9%) | 38 (90.5%) |
| 75 Years and over | 16 (64.0%) | 71 (92.2%) |
| Total | 488 (97.0%) | 510 (95.3%) |
Income Below Poverty Among Married-Couple Families in Entiat
The poverty statistics for married-couple families in Entiat show that 1.1% or 2 of the total 190 families live below the poverty line. Families with no children have the highest poverty rate of 1.3%, comprising of 2 families. On the other hand, families with 1 or 2 children have the lowest poverty rate of 0.0%, which includes 0 families.
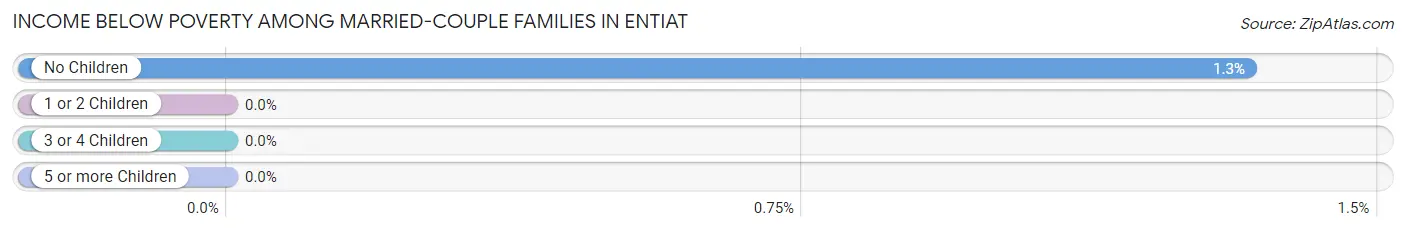
| Children | Above Poverty | Below Poverty |
| No Children | 148 (98.7%) | 2 (1.3%) |
| 1 or 2 Children | 24 (100.0%) | 0 (0.0%) |
| 3 or 4 Children | 16 (100.0%) | 0 (0.0%) |
| 5 or more Children | 0 (0.0%) | 0 (0.0%) |
| Total | 188 (99.0%) | 2 (1.1%) |
Income Below Poverty Among Single-Parent Households in Entiat
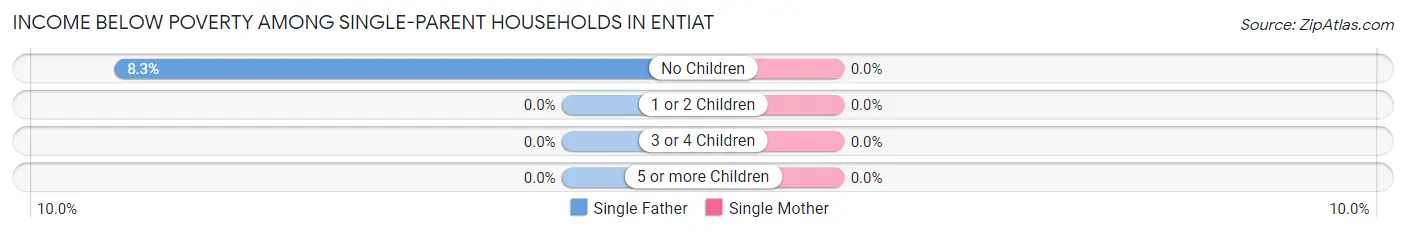
| Children | Single Father | Single Mother |
| No Children | 1 (8.3%) | 0 (0.0%) |
| 1 or 2 Children | 0 (0.0%) | 0 (0.0%) |
| 3 or 4 Children | 0 (0.0%) | 0 (0.0%) |
| 5 or more Children | 0 (0.0%) | 0 (0.0%) |
| Total | 1 (8.3%) | 0 (0.0%) |
Income Below Poverty Among Married-Couple vs Single-Parent Households in Entiat
The poverty data for Entiat shows that 2 of the married-couple family households (1.1%) and 1 of the single-parent households (1.6%) are living below the poverty level. Within the married-couple family households, those with no children have the highest poverty rate, with 2 households (1.3%) falling below the poverty line. Among the single-parent households, those with no children have the highest poverty rate, with 1 household (3.8%) living below poverty.
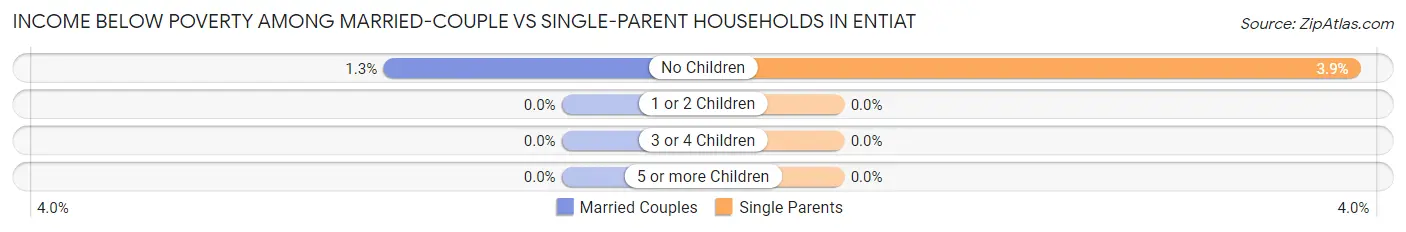
| Children | Married-Couple Families | Single-Parent Households |
| No Children | 2 (1.3%) | 1 (3.8%) |
| 1 or 2 Children | 0 (0.0%) | 0 (0.0%) |
| 3 or 4 Children | 0 (0.0%) | 0 (0.0%) |
| 5 or more Children | 0 (0.0%) | 0 (0.0%) |
| Total | 2 (1.1%) | 1 (1.6%) |
Race in Entiat
The most populous races in Entiat are White / Caucasian (713 | 68.7%), Hispanic or Latino (242 | 23.3%), and Some other Race (181 | 17.4%).
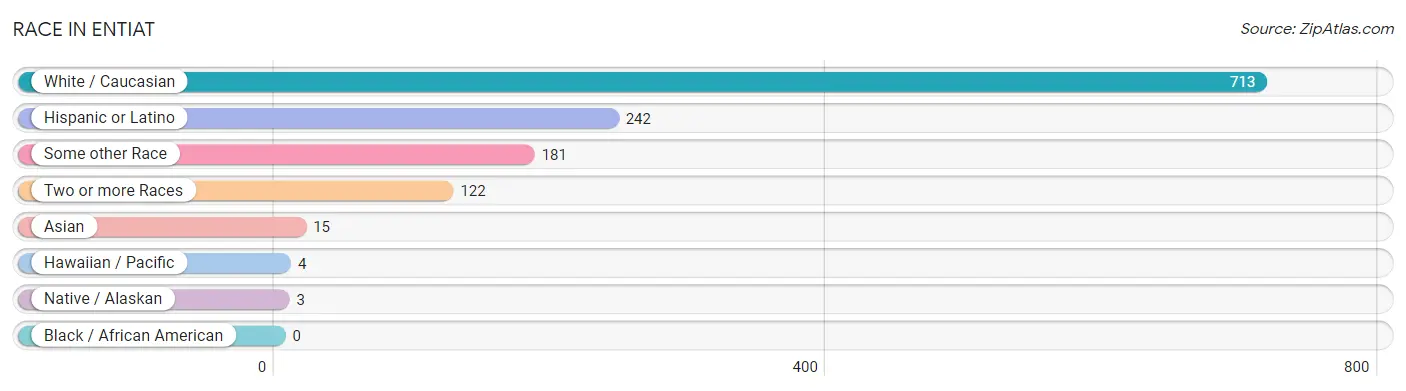
| Race | # Population | % Population |
| Asian | 15 | 1.5% |
| Black / African American | 0 | 0.0% |
| Hawaiian / Pacific | 4 | 0.4% |
| Hispanic or Latino | 242 | 23.3% |
| Native / Alaskan | 3 | 0.3% |
| White / Caucasian | 713 | 68.7% |
| Two or more Races | 122 | 11.7% |
| Some other Race | 181 | 17.4% |
| Total | 1,038 | 100.0% |
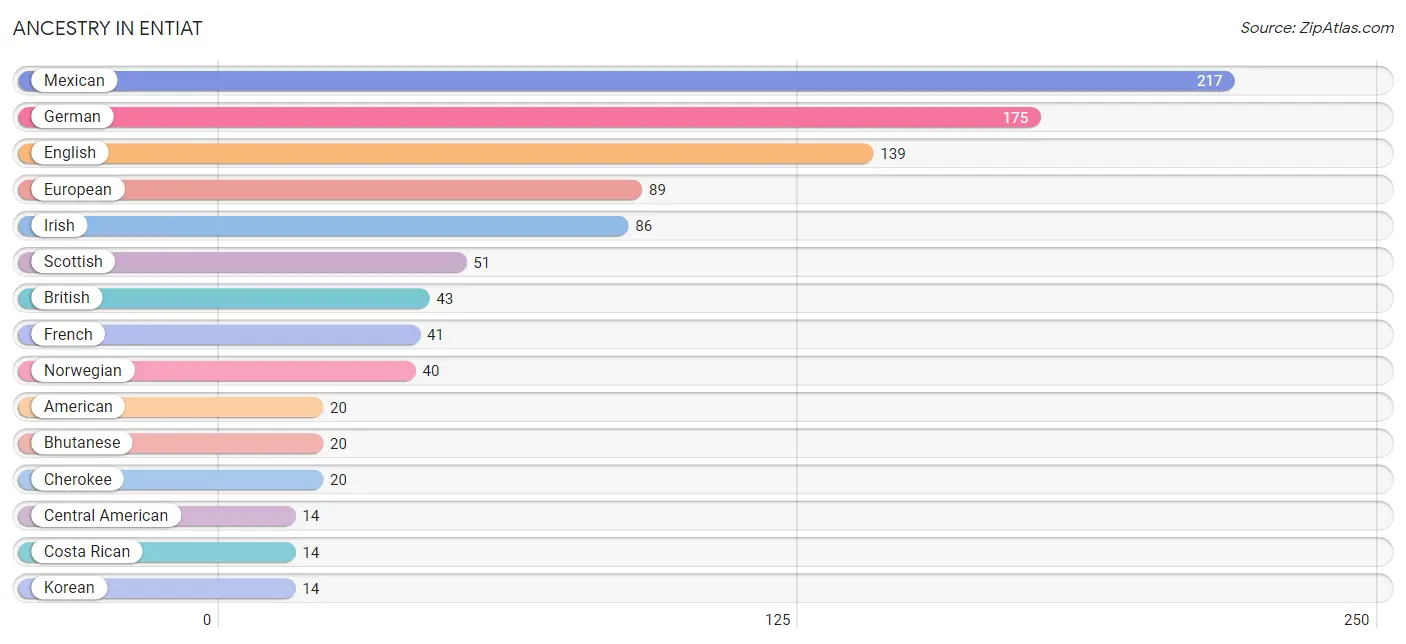
Ancestry in Entiat
The most populous ancestries reported in Entiat are Mexican (217 | 20.9%), German (175 | 16.9%), English (139 | 13.4%), European (89 | 8.6%), and Irish (86 | 8.3%), together accounting for 68.0% of all Entiat residents.
| Ancestry | # Population | % Population |
| American | 20 | 1.9% |
| Belgian | 3 | 0.3% |
| Bhutanese | 20 | 1.9% |
| British | 43 | 4.1% |
| Canadian | 10 | 1.0% |
| Carpatho Rusyn | 7 | 0.7% |
| Celtic | 11 | 1.1% |
| Central American | 14 | 1.3% |
| Cherokee | 20 | 1.9% |
| Colville | 3 | 0.3% |
| Costa Rican | 14 | 1.3% |
| Czech | 2 | 0.2% |
| Dutch | 12 | 1.2% |
| Eastern European | 4 | 0.4% |
| English | 139 | 13.4% |
| European | 89 | 8.6% |
| French | 41 | 4.0% |
| French Canadian | 9 | 0.9% |
| German | 175 | 16.9% |
| Guamanian / Chamorro | 12 | 1.2% |
| Hungarian | 3 | 0.3% |
| Irish | 86 | 8.3% |
| Korean | 14 | 1.3% |
| Luxembourger | 2 | 0.2% |
| Mexican | 217 | 20.9% |
| Norwegian | 40 | 3.8% |
| Osage | 5 | 0.5% |
| Romanian | 2 | 0.2% |
| Scandinavian | 10 | 1.0% |
| Scotch-Irish | 12 | 1.2% |
| Scottish | 51 | 4.9% |
| Slovak | 7 | 0.7% |
| Swedish | 14 | 1.3% |
| Swiss | 3 | 0.3% |
| Tlingit-Haida | 2 | 0.2% |
| Ukrainian | 2 | 0.2% | View All 36 Rows |
Immigrants in Entiat
The most numerous immigrant groups reported in Entiat came from Central America (114 | 11.0%), Latin America (114 | 11.0%), El Salvador (56 | 5.4%), Mexico (44 | 4.2%), and Asia (28 | 2.7%), together accounting for 34.3% of all Entiat residents.
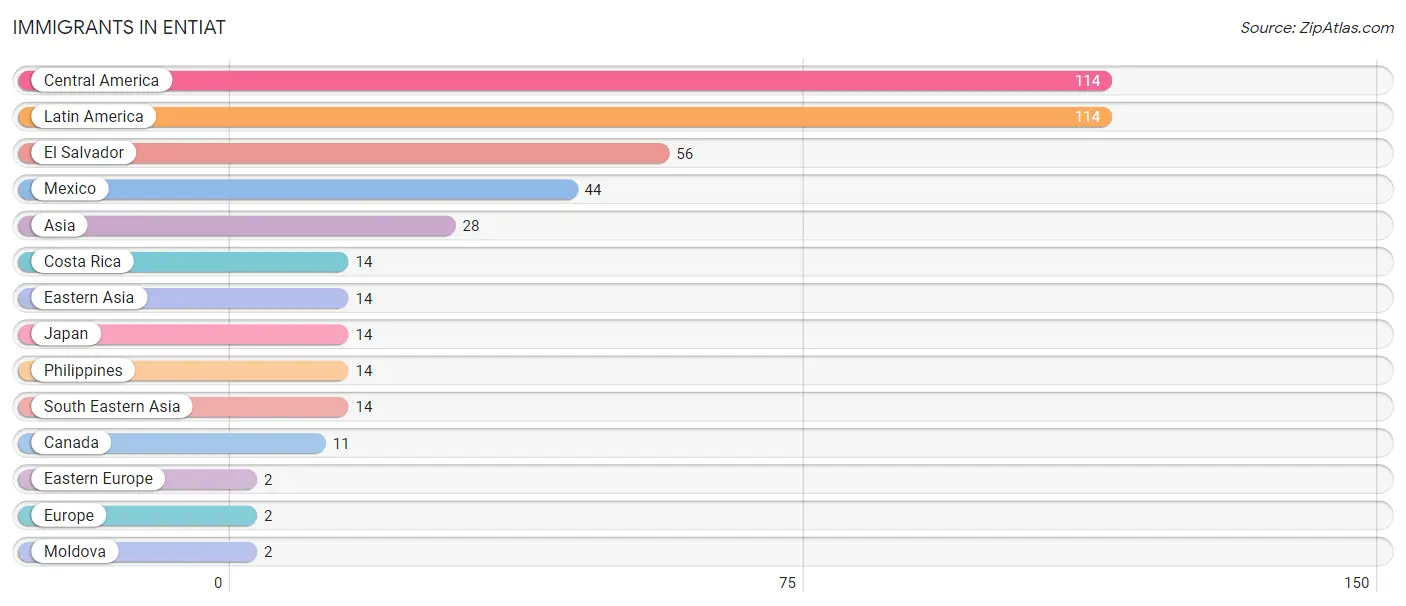
| Immigration Origin | # Population | % Population |
| Asia | 28 | 2.7% |
| Canada | 11 | 1.1% |
| Central America | 114 | 11.0% |
| Costa Rica | 14 | 1.3% |
| Eastern Asia | 14 | 1.3% |
| Eastern Europe | 2 | 0.2% |
| El Salvador | 56 | 5.4% |
| Europe | 2 | 0.2% |
| Japan | 14 | 1.3% |
| Latin America | 114 | 11.0% |
| Mexico | 44 | 4.2% |
| Moldova | 2 | 0.2% |
| Philippines | 14 | 1.3% |
| South Eastern Asia | 14 | 1.3% | View All 14 Rows |
Sex and Age in Entiat
Sex and Age in Entiat
The most populous age groups in Entiat are 20 to 24 Years (92 | 18.3%) for men and 25 to 29 Years (54 | 10.1%) for women.
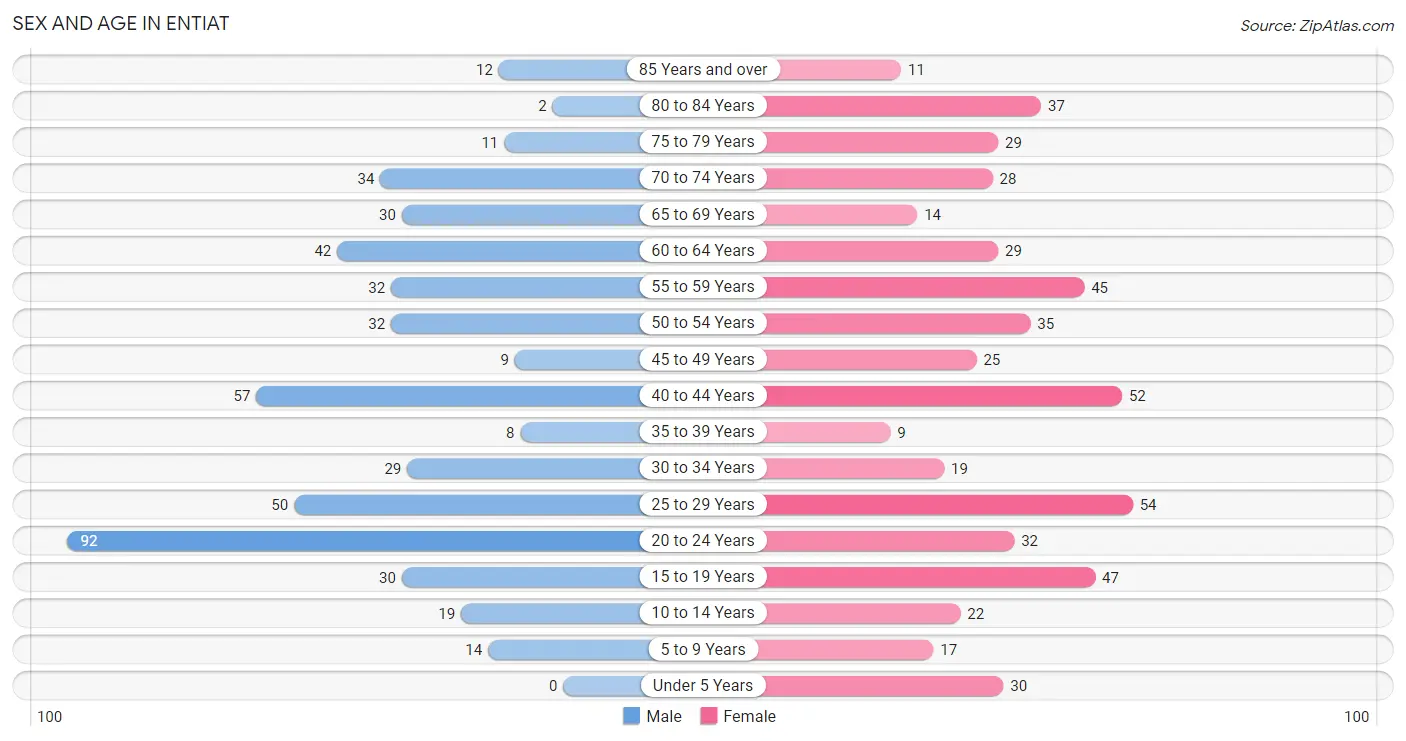
| Age Bracket | Male | Female |
| Under 5 Years | 0 (0.0%) | 30 (5.6%) |
| 5 to 9 Years | 14 (2.8%) | 17 (3.2%) |
| 10 to 14 Years | 19 (3.8%) | 22 (4.1%) |
| 15 to 19 Years | 30 (6.0%) | 47 (8.8%) |
| 20 to 24 Years | 92 (18.3%) | 32 (6.0%) |
| 25 to 29 Years | 50 (9.9%) | 54 (10.1%) |
| 30 to 34 Years | 29 (5.8%) | 19 (3.5%) |
| 35 to 39 Years | 8 (1.6%) | 9 (1.7%) |
| 40 to 44 Years | 57 (11.3%) | 52 (9.7%) |
| 45 to 49 Years | 9 (1.8%) | 25 (4.7%) |
| 50 to 54 Years | 32 (6.4%) | 35 (6.5%) |
| 55 to 59 Years | 32 (6.4%) | 45 (8.4%) |
| 60 to 64 Years | 42 (8.4%) | 29 (5.4%) |
| 65 to 69 Years | 30 (6.0%) | 14 (2.6%) |
| 70 to 74 Years | 34 (6.8%) | 28 (5.2%) |
| 75 to 79 Years | 11 (2.2%) | 29 (5.4%) |
| 80 to 84 Years | 2 (0.4%) | 37 (6.9%) |
| 85 Years and over | 12 (2.4%) | 11 (2.1%) |
| Total | 503 (100.0%) | 535 (100.0%) |
Families and Households in Entiat
Median Family Size in Entiat
The median family size in Entiat is 3.16 persons per family, with single female/mother families (49 | 19.5%) accounting for the largest median family size of 3.41 persons per family. On the other hand, single male/father families (12 | 4.8%) represent the smallest median family size with 2.25 persons per family.
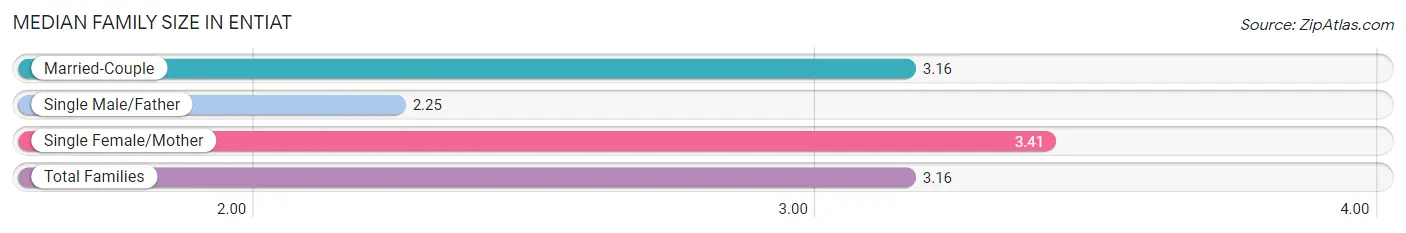
| Family Type | # Families | Family Size |
| Married-Couple | 190 (75.7%) | 3.16 |
| Single Male/Father | 12 (4.8%) | 2.25 |
| Single Female/Mother | 49 (19.5%) | 3.41 |
| Total Families | 251 (100.0%) | 3.16 |
Median Household Size in Entiat
The median household size in Entiat is 2.62 persons per household, with single female/mother households (49 | 12.4%) accounting for the largest median household size of 4.33 persons per household. non-family households (145 | 36.6%) represent the smallest median household size with 1.35 persons per household.
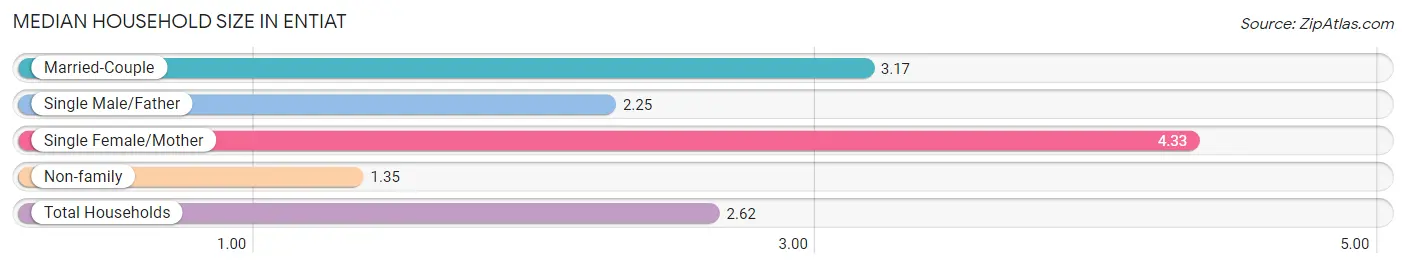
| Household Type | # Households | Household Size |
| Married-Couple | 190 (48.0%) | 3.17 |
| Single Male/Father | 12 (3.0%) | 2.25 |
| Single Female/Mother | 49 (12.4%) | 4.33 |
| Non-family | 145 (36.6%) | 1.35 |
| Total Households | 396 (100.0%) | 2.62 |
Household Size by Marriage Status in Entiat
Out of a total of 396 households in Entiat, 251 (63.4%) are family households, while 145 (36.6%) are nonfamily households. The most numerous type of family households are 2-person households, comprising 112, and the most common type of nonfamily households are 1-person households, comprising 112.
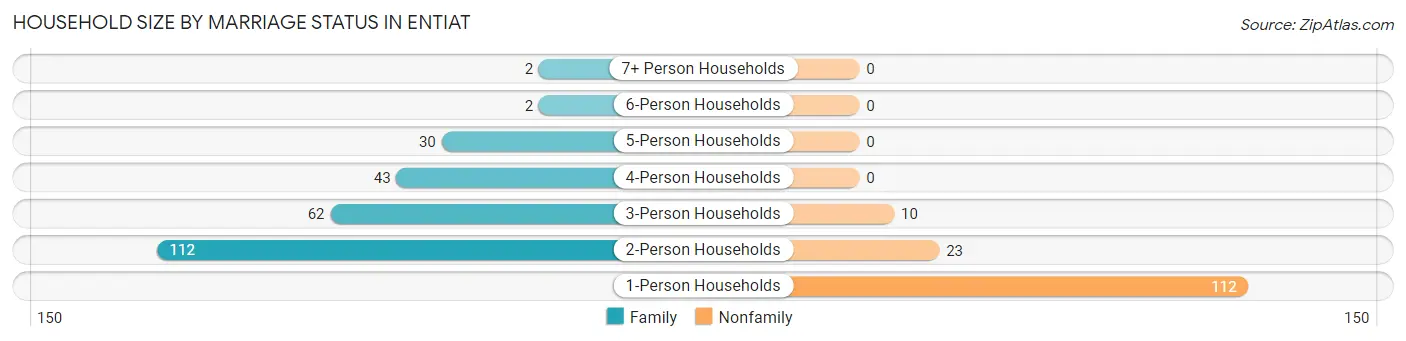
| Household Size | Family Households | Nonfamily Households |
| 1-Person Households | - | 112 (28.3%) |
| 2-Person Households | 112 (28.3%) | 23 (5.8%) |
| 3-Person Households | 62 (15.7%) | 10 (2.5%) |
| 4-Person Households | 43 (10.9%) | 0 (0.0%) |
| 5-Person Households | 30 (7.6%) | 0 (0.0%) |
| 6-Person Households | 2 (0.5%) | 0 (0.0%) |
| 7+ Person Households | 2 (0.5%) | 0 (0.0%) |
| Total | 251 (63.4%) | 145 (36.6%) |
Female Fertility in Entiat
Fertility by Age in Entiat
Average fertility rate in Entiat is 55.0 births per 1,000 women. Women in the age bracket of 20 to 34 years have the highest fertility rate with 124.0 births per 1,000 women. Women in the age bracket of 20 to 34 years acount for 100.0% of all women with births.
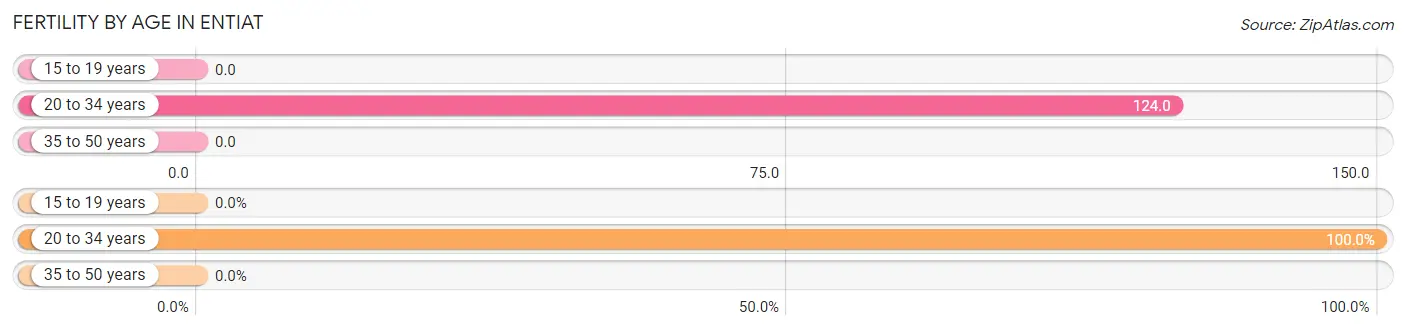
| Age Bracket | Women with Births | Births / 1,000 Women |
| 15 to 19 years | 0 (0.0%) | 0.0 |
| 20 to 34 years | 13 (100.0%) | 124.0 |
| 35 to 50 years | 0 (0.0%) | 0.0 |
| Total | 13 (100.0%) | 55.0 |
Fertility by Age by Marriage Status in Entiat
69.2% of women with births (13) in Entiat are married. The highest percentage of unmarried women with births falls into 20 to 34 years age bracket with 30.8% of them unmarried at the time of birth, while the lowest percentage of unmarried women with births belong to 20 to 34 years age bracket with 30.8% of them unmarried.
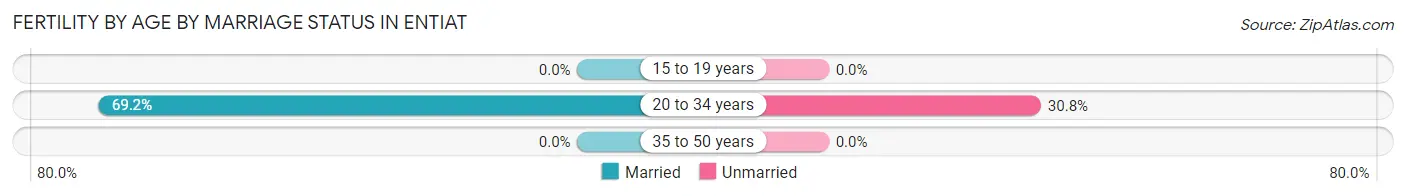
| Age Bracket | Married | Unmarried |
| 15 to 19 years | 0 (0.0%) | 0 (0.0%) |
| 20 to 34 years | 9 (69.2%) | 4 (30.8%) |
| 35 to 50 years | 0 (0.0%) | 0 (0.0%) |
| Total | 9 (69.2%) | 4 (30.8%) |
Fertility by Education in Entiat
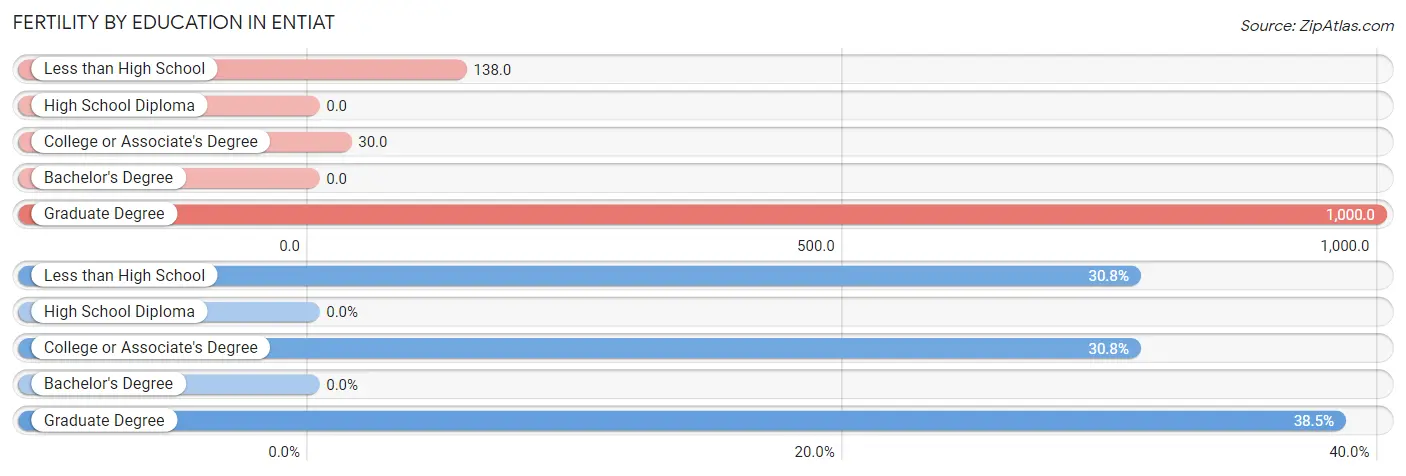
| Educational Attainment | Women with Births | Births / 1,000 Women |
| Less than High School | 4 (30.8%) | 138.0 |
| High School Diploma | 0 (0.0%) | 0.0 |
| College or Associate's Degree | 4 (30.8%) | 30.0 |
| Bachelor's Degree | 0 (0.0%) | 0.0 |
| Graduate Degree | 5 (38.5%) | 1,000.0 |
| Total | 13 (100.0%) | 55.0 |
Fertility by Education by Marriage Status in Entiat
30.8% of women with births in Entiat are unmarried. Women with the educational attainment of college or associate's degree are most likely to be married with 100.0% of them married at childbirth, while women with the educational attainment of less than high school are least likely to be married with 100.0% of them unmarried at childbirth.
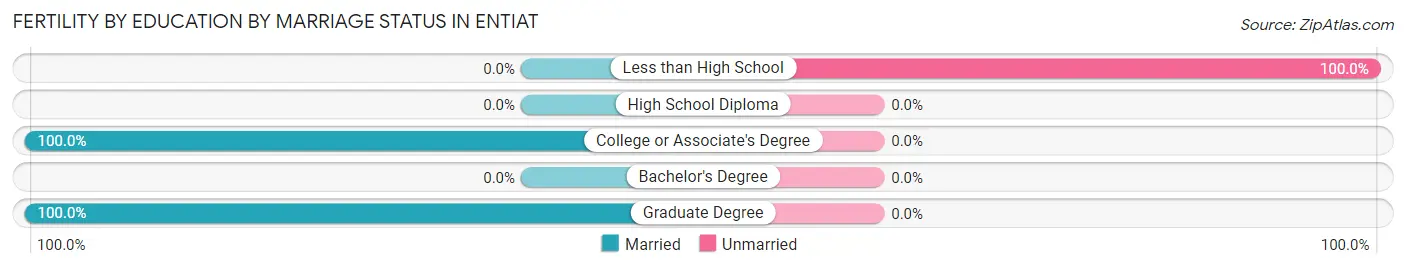
| Educational Attainment | Married | Unmarried |
| Less than High School | 0 (0.0%) | 4 (100.0%) |
| High School Diploma | 0 (0.0%) | 0 (0.0%) |
| College or Associate's Degree | 4 (100.0%) | 0 (0.0%) |
| Bachelor's Degree | 0 (0.0%) | 0 (0.0%) |
| Graduate Degree | 5 (100.0%) | 0 (0.0%) |
| Total | 9 (69.2%) | 4 (30.8%) |
Employment Characteristics in Entiat
Employment by Class of Employer in Entiat
Among the 567 employed individuals in Entiat, private company employees (432 | 76.2%), local government employees (42 | 7.4%), and self-employed (not incorporated) (33 | 5.8%) make up the most common classes of employment.
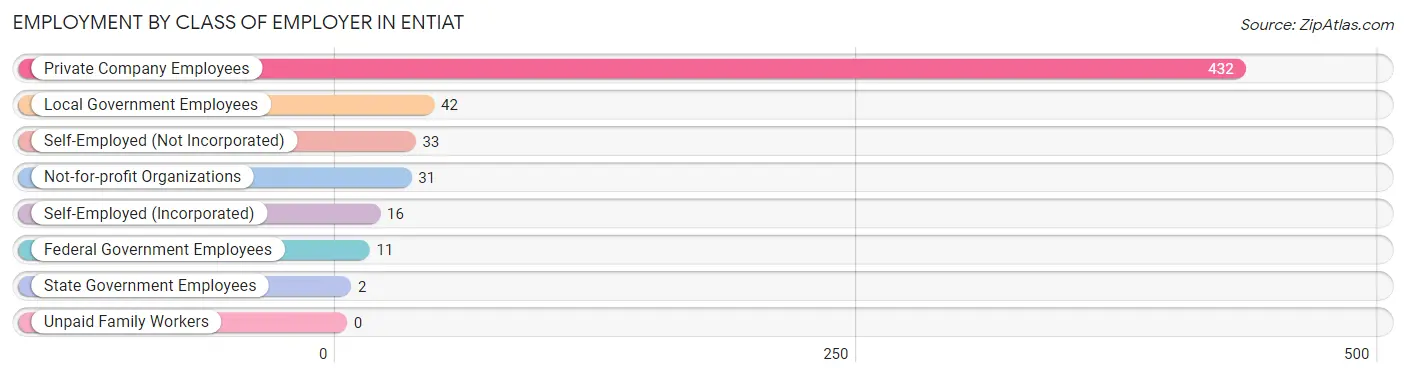
| Employer Class | # Employees | % Employees |
| Private Company Employees | 432 | 76.2% |
| Self-Employed (Incorporated) | 16 | 2.8% |
| Self-Employed (Not Incorporated) | 33 | 5.8% |
| Not-for-profit Organizations | 31 | 5.5% |
| Local Government Employees | 42 | 7.4% |
| State Government Employees | 2 | 0.4% |
| Federal Government Employees | 11 | 1.9% |
| Unpaid Family Workers | 0 | 0.0% |
| Total | 567 | 100.0% |
Employment Status by Age in Entiat
According to the labor force statistics for Entiat, out of the total population over 16 years of age (931), 64.4% or 600 individuals are in the labor force, with 5.5% or 33 of them unemployed. The age group with the highest labor force participation rate is 55 to 59 years, with 97.4% or 75 individuals in the labor force. Within the labor force, the 65 to 74 years age range has the highest percentage of unemployed individuals, with 14.3% or 2 of them being unemployed.
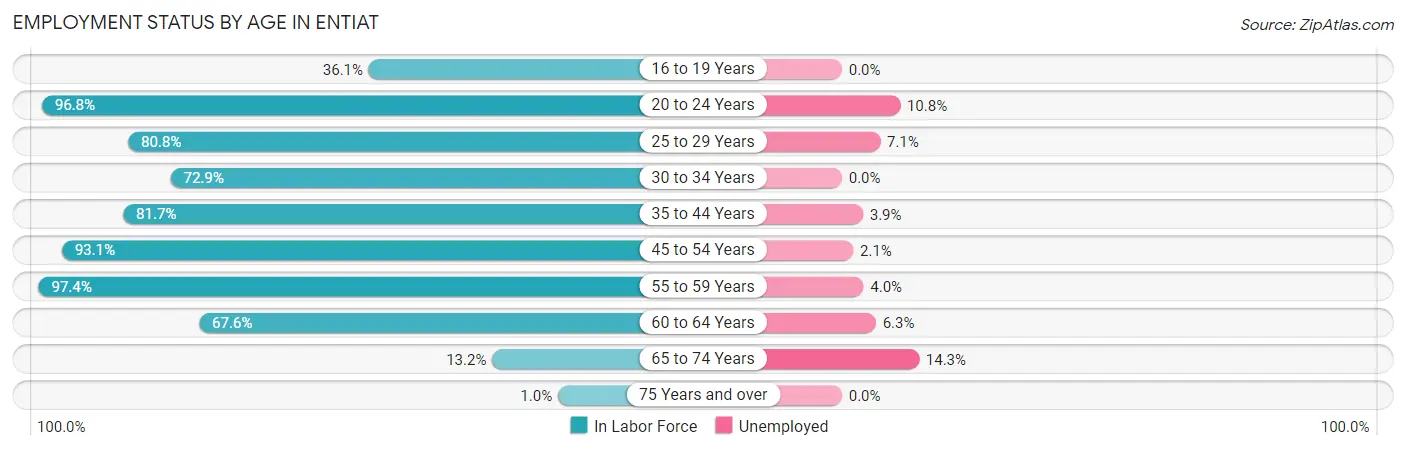
| Age Bracket | In Labor Force | Unemployed |
| 16 to 19 Years | 26 (36.1%) | 0 (0.0%) |
| 20 to 24 Years | 120 (96.8%) | 13 (10.8%) |
| 25 to 29 Years | 84 (80.8%) | 6 (7.1%) |
| 30 to 34 Years | 35 (72.9%) | 0 (0.0%) |
| 35 to 44 Years | 103 (81.7%) | 4 (3.9%) |
| 45 to 54 Years | 94 (93.1%) | 2 (2.1%) |
| 55 to 59 Years | 75 (97.4%) | 3 (4.0%) |
| 60 to 64 Years | 48 (67.6%) | 3 (6.3%) |
| 65 to 74 Years | 14 (13.2%) | 2 (14.3%) |
| 75 Years and over | 1 (1.0%) | 0 (0.0%) |
| Total | 600 (64.4%) | 33 (5.5%) |
Employment Status by Educational Attainment in Entiat
According to labor force statistics for Entiat, 83.3% of individuals (439) out of the total population between 25 and 64 years of age (527) are in the labor force, with 4.1% or 18 of them being unemployed. The group with the highest labor force participation rate are those with the educational attainment of college / associate degree, with 84.9% or 180 individuals in the labor force. Within the labor force, individuals with college / associate degree education have the highest percentage of unemployment, with 5.0% or 9 of them being unemployed.
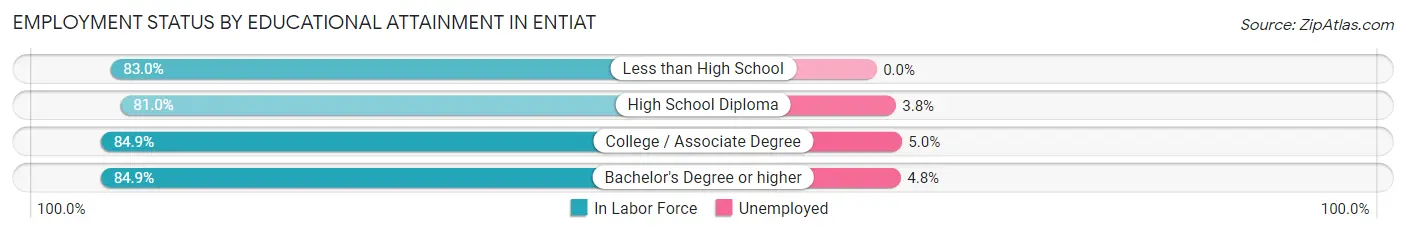
| Educational Attainment | In Labor Force | Unemployed |
| Less than High School | 39 (83.0%) | 0 (0.0%) |
| High School Diploma | 158 (81.0%) | 7 (3.8%) |
| College / Associate Degree | 180 (84.9%) | 11 (5.0%) |
| Bachelor's Degree or higher | 62 (84.9%) | 4 (4.8%) |
| Total | 439 (83.3%) | 22 (4.1%) |
Employment Occupations by Sex in Entiat
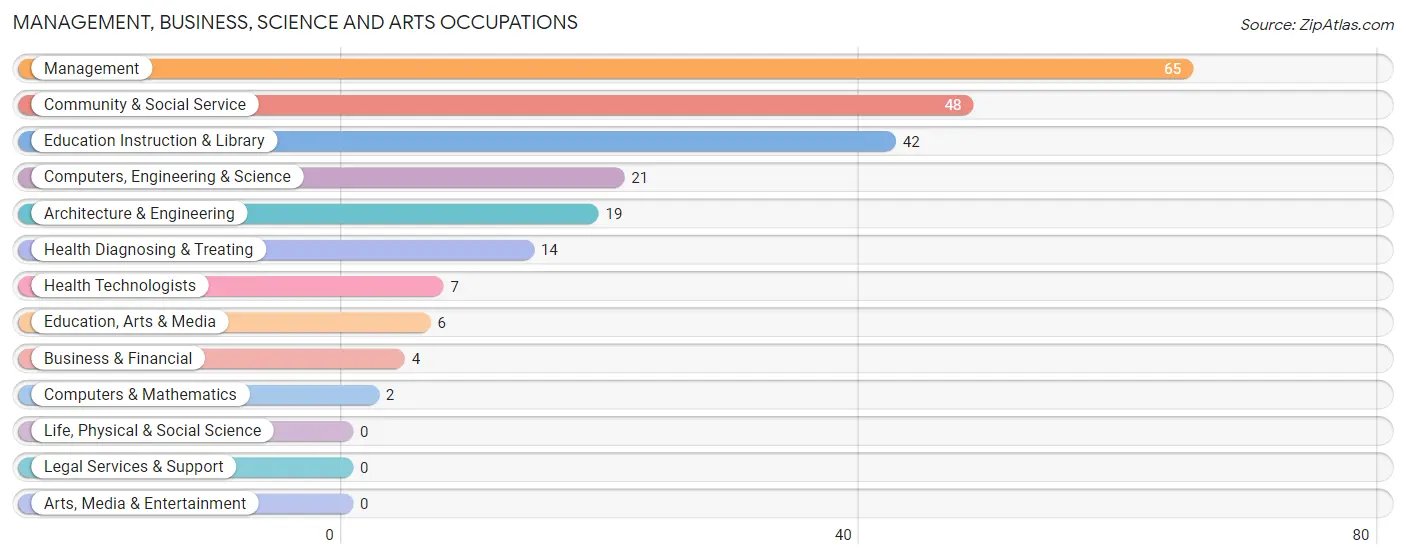
Management, Business, Science and Arts Occupations
The most common Management, Business, Science and Arts occupations in Entiat are Management (65 | 11.5%), Community & Social Service (48 | 8.5%), Education Instruction & Library (42 | 7.4%), Computers, Engineering & Science (21 | 3.7%), and Architecture & Engineering (19 | 3.4%).
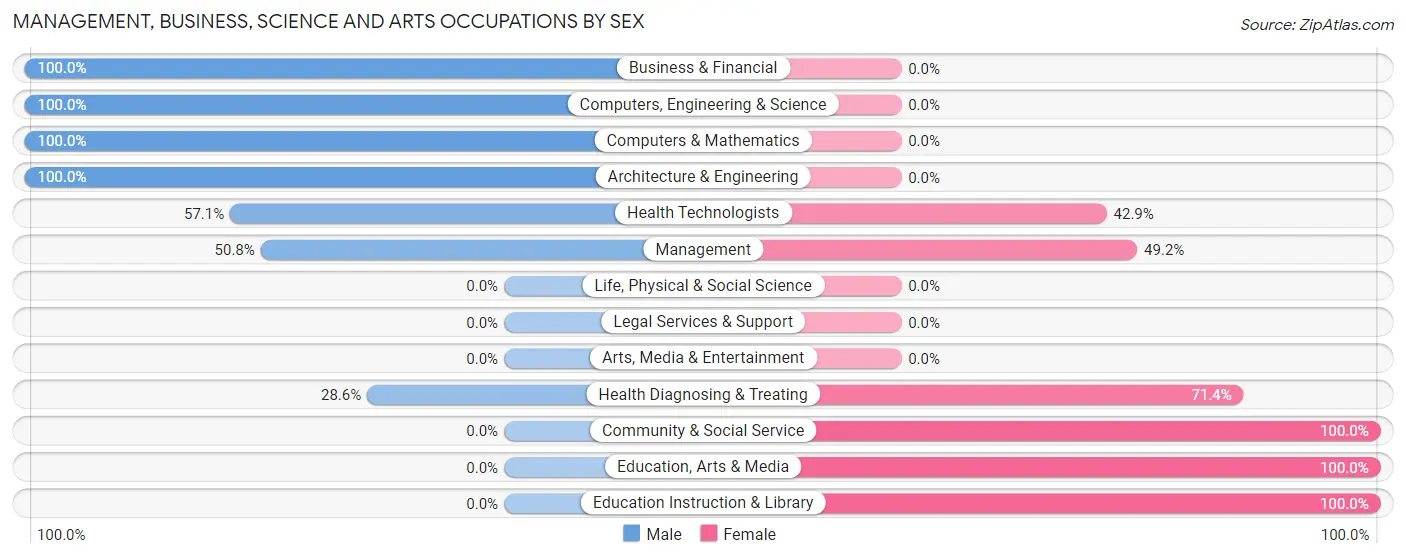
Management, Business, Science and Arts Occupations by Sex
Within the Management, Business, Science and Arts occupations in Entiat, the most male-oriented occupations are Business & Financial (100.0%), Computers, Engineering & Science (100.0%), and Computers & Mathematics (100.0%), while the most female-oriented occupations are Community & Social Service (100.0%), Education, Arts & Media (100.0%), and Education Instruction & Library (100.0%).
| Occupation | Male | Female |
| Management | 33 (50.8%) | 32 (49.2%) |
| Business & Financial | 4 (100.0%) | 0 (0.0%) |
| Computers, Engineering & Science | 21 (100.0%) | 0 (0.0%) |
| Computers & Mathematics | 2 (100.0%) | 0 (0.0%) |
| Architecture & Engineering | 19 (100.0%) | 0 (0.0%) |
| Life, Physical & Social Science | 0 (0.0%) | 0 (0.0%) |
| Community & Social Service | 0 (0.0%) | 48 (100.0%) |
| Education, Arts & Media | 0 (0.0%) | 6 (100.0%) |
| Legal Services & Support | 0 (0.0%) | 0 (0.0%) |
| Education Instruction & Library | 0 (0.0%) | 42 (100.0%) |
| Arts, Media & Entertainment | 0 (0.0%) | 0 (0.0%) |
| Health Diagnosing & Treating | 4 (28.6%) | 10 (71.4%) |
| Health Technologists | 4 (57.1%) | 3 (42.9%) |
| Total (Category) | 62 (40.8%) | 90 (59.2%) |
| Total (Overall) | 300 (52.9%) | 267 (47.1%) |
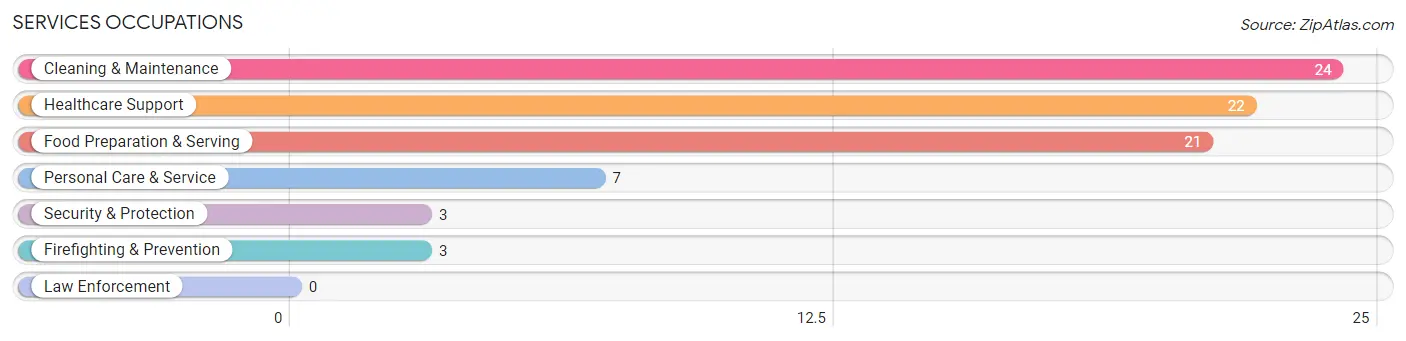
Services Occupations
The most common Services occupations in Entiat are Cleaning & Maintenance (24 | 4.2%), Healthcare Support (22 | 3.9%), Food Preparation & Serving (21 | 3.7%), Personal Care & Service (7 | 1.2%), and Security & Protection (3 | 0.5%).
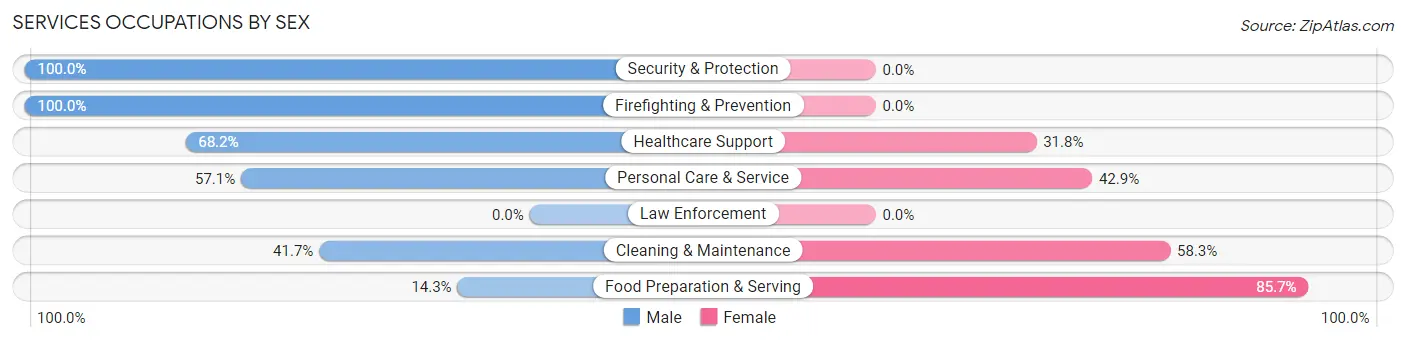
Services Occupations by Sex
Within the Services occupations in Entiat, the most male-oriented occupations are Security & Protection (100.0%), Firefighting & Prevention (100.0%), and Healthcare Support (68.2%), while the most female-oriented occupations are Food Preparation & Serving (85.7%), Cleaning & Maintenance (58.3%), and Personal Care & Service (42.9%).
| Occupation | Male | Female |
| Healthcare Support | 15 (68.2%) | 7 (31.8%) |
| Security & Protection | 3 (100.0%) | 0 (0.0%) |
| Firefighting & Prevention | 3 (100.0%) | 0 (0.0%) |
| Law Enforcement | 0 (0.0%) | 0 (0.0%) |
| Food Preparation & Serving | 3 (14.3%) | 18 (85.7%) |
| Cleaning & Maintenance | 10 (41.7%) | 14 (58.3%) |
| Personal Care & Service | 4 (57.1%) | 3 (42.9%) |
| Total (Category) | 35 (45.5%) | 42 (54.5%) |
| Total (Overall) | 300 (52.9%) | 267 (47.1%) |
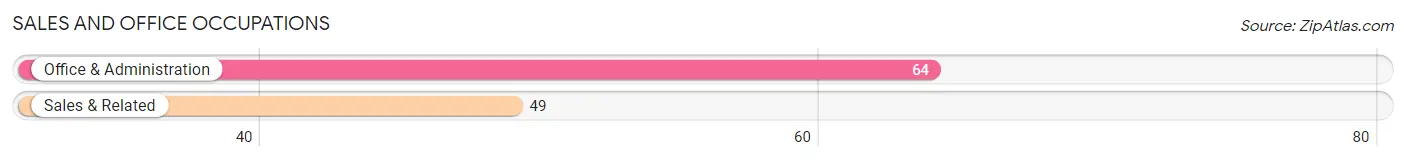
Sales and Office Occupations
The most common Sales and Office occupations in Entiat are Office & Administration (64 | 11.3%), and Sales & Related (49 | 8.6%).
Sales and Office Occupations by Sex
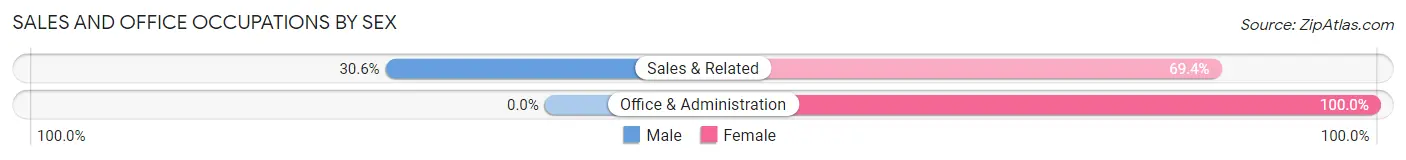
| Occupation | Male | Female |
| Sales & Related | 15 (30.6%) | 34 (69.4%) |
| Office & Administration | 0 (0.0%) | 64 (100.0%) |
| Total (Category) | 15 (13.3%) | 98 (86.7%) |
| Total (Overall) | 300 (52.9%) | 267 (47.1%) |
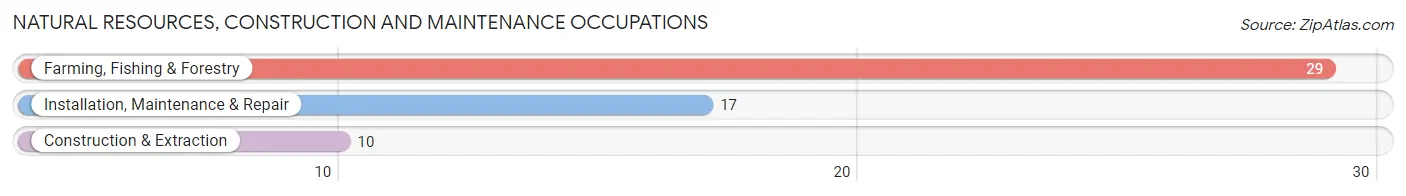
Natural Resources, Construction and Maintenance Occupations
The most common Natural Resources, Construction and Maintenance occupations in Entiat are Farming, Fishing & Forestry (29 | 5.1%), Installation, Maintenance & Repair (17 | 3.0%), and Construction & Extraction (10 | 1.8%).
Natural Resources, Construction and Maintenance Occupations by Sex
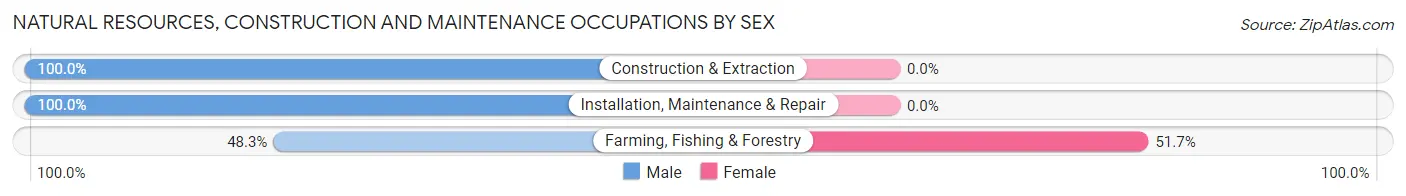
| Occupation | Male | Female |
| Farming, Fishing & Forestry | 14 (48.3%) | 15 (51.7%) |
| Construction & Extraction | 10 (100.0%) | 0 (0.0%) |
| Installation, Maintenance & Repair | 17 (100.0%) | 0 (0.0%) |
| Total (Category) | 41 (73.2%) | 15 (26.8%) |
| Total (Overall) | 300 (52.9%) | 267 (47.1%) |
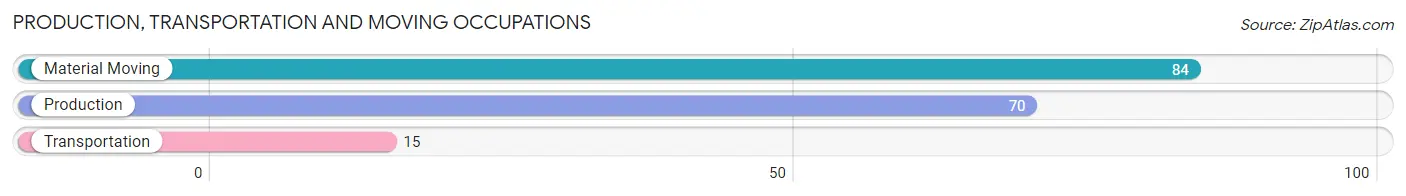
Production, Transportation and Moving Occupations
The most common Production, Transportation and Moving occupations in Entiat are Material Moving (84 | 14.8%), Production (70 | 12.3%), and Transportation (15 | 2.6%).
Production, Transportation and Moving Occupations by Sex
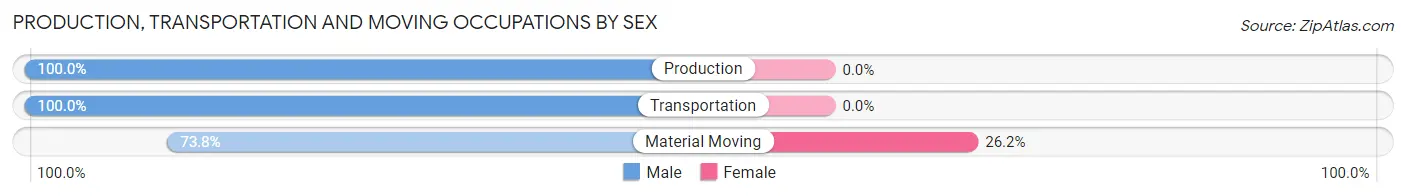
| Occupation | Male | Female |
| Production | 70 (100.0%) | 0 (0.0%) |
| Transportation | 15 (100.0%) | 0 (0.0%) |
| Material Moving | 62 (73.8%) | 22 (26.2%) |
| Total (Category) | 147 (87.0%) | 22 (13.0%) |
| Total (Overall) | 300 (52.9%) | 267 (47.1%) |
Employment Industries by Sex in Entiat
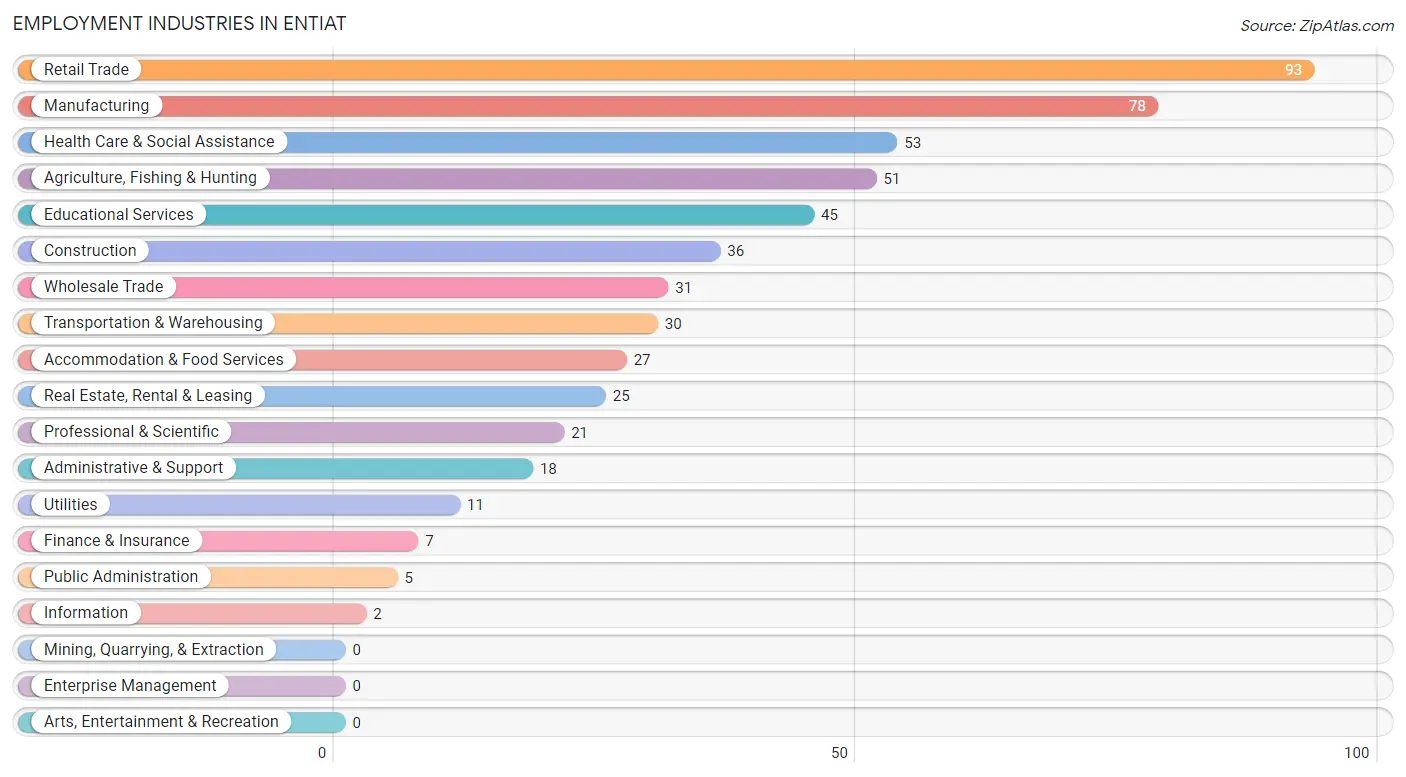
Employment Industries in Entiat
The major employment industries in Entiat include Retail Trade (93 | 16.4%), Manufacturing (78 | 13.8%), Health Care & Social Assistance (53 | 9.3%), Agriculture, Fishing & Hunting (51 | 9.0%), and Educational Services (45 | 7.9%).
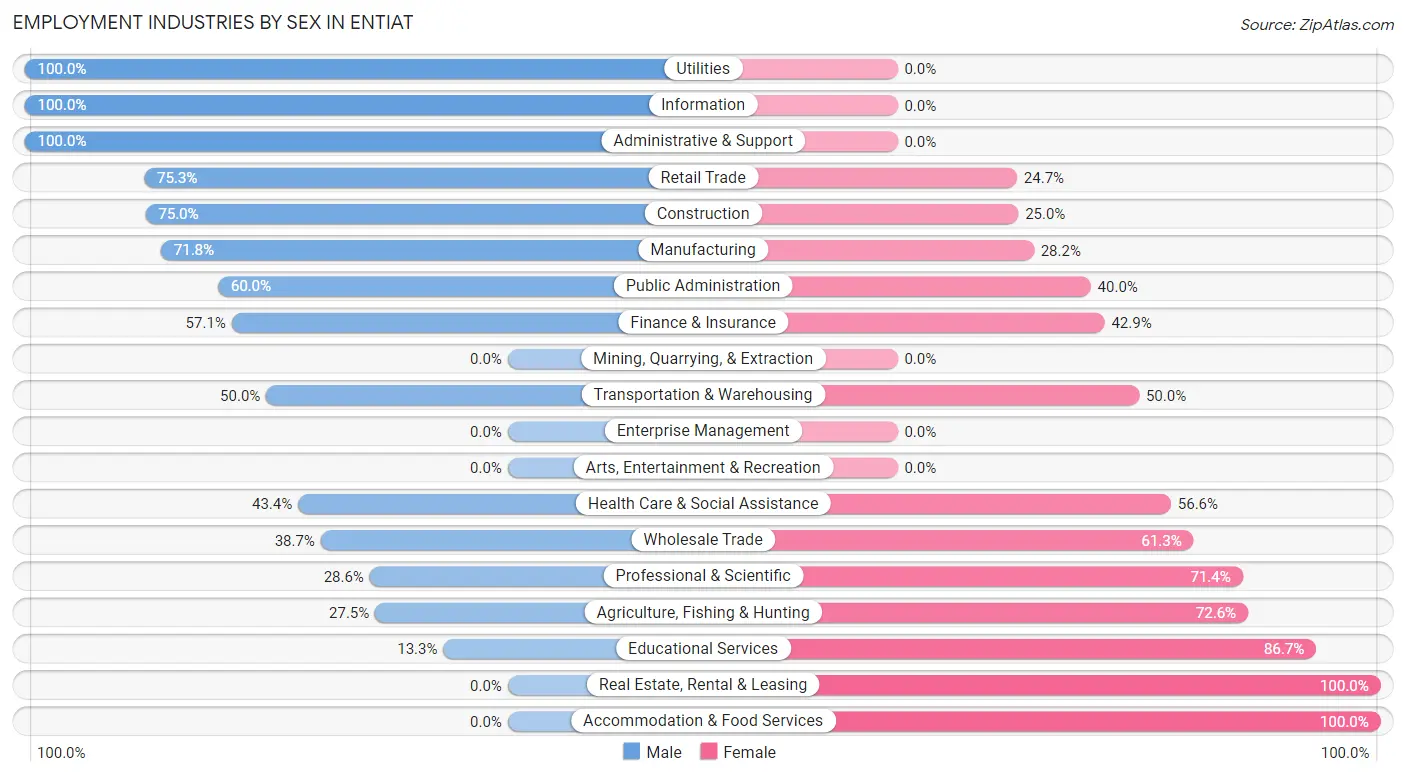
Employment Industries by Sex in Entiat
The Entiat industries that see more men than women are Utilities (100.0%), Information (100.0%), and Administrative & Support (100.0%), whereas the industries that tend to have a higher number of women are Real Estate, Rental & Leasing (100.0%), Accommodation & Food Services (100.0%), and Educational Services (86.7%).
| Industry | Male | Female |
| Agriculture, Fishing & Hunting | 14 (27.5%) | 37 (72.6%) |
| Mining, Quarrying, & Extraction | 0 (0.0%) | 0 (0.0%) |
| Construction | 27 (75.0%) | 9 (25.0%) |
| Manufacturing | 56 (71.8%) | 22 (28.2%) |
| Wholesale Trade | 12 (38.7%) | 19 (61.3%) |
| Retail Trade | 70 (75.3%) | 23 (24.7%) |
| Transportation & Warehousing | 15 (50.0%) | 15 (50.0%) |
| Utilities | 11 (100.0%) | 0 (0.0%) |
| Information | 2 (100.0%) | 0 (0.0%) |
| Finance & Insurance | 4 (57.1%) | 3 (42.9%) |
| Real Estate, Rental & Leasing | 0 (0.0%) | 25 (100.0%) |
| Professional & Scientific | 6 (28.6%) | 15 (71.4%) |
| Enterprise Management | 0 (0.0%) | 0 (0.0%) |
| Administrative & Support | 18 (100.0%) | 0 (0.0%) |
| Educational Services | 6 (13.3%) | 39 (86.7%) |
| Health Care & Social Assistance | 23 (43.4%) | 30 (56.6%) |
| Arts, Entertainment & Recreation | 0 (0.0%) | 0 (0.0%) |
| Accommodation & Food Services | 0 (0.0%) | 27 (100.0%) |
| Public Administration | 3 (60.0%) | 2 (40.0%) |
| Total | 300 (52.9%) | 267 (47.1%) |
Education in Entiat
School Enrollment in Entiat
The most common levels of schooling among the 172 students in Entiat are college / undergraduate (57 | 33.1%), high school (36 | 20.9%), and middle school (27 | 15.7%).
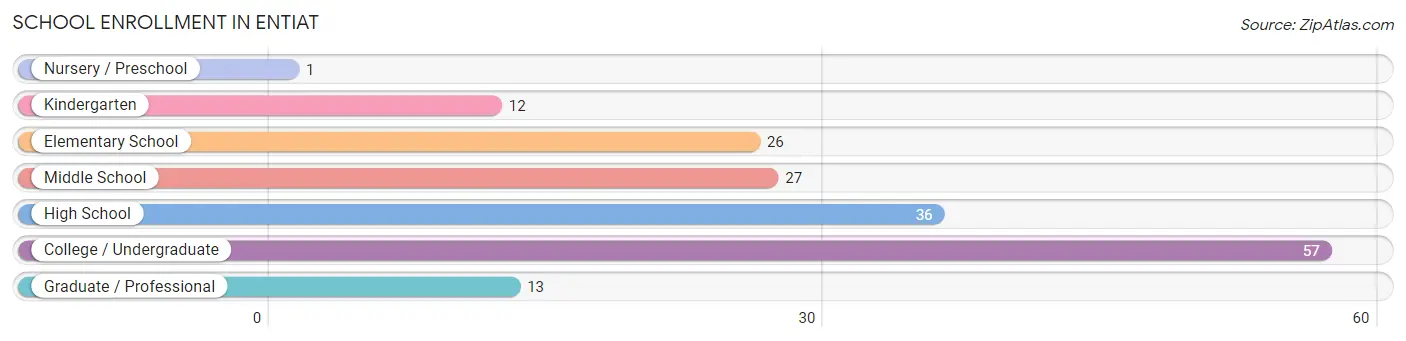
| School Level | # Students | % Students |
| Nursery / Preschool | 1 | 0.6% |
| Kindergarten | 12 | 7.0% |
| Elementary School | 26 | 15.1% |
| Middle School | 27 | 15.7% |
| High School | 36 | 20.9% |
| College / Undergraduate | 57 | 33.1% |
| Graduate / Professional | 13 | 7.6% |
| Total | 172 | 100.0% |
School Enrollment by Age by Funding Source in Entiat
Out of a total of 172 students who are enrolled in schools in Entiat, 5 (2.9%) attend a private institution, while the remaining 167 (97.1%) are enrolled in public schools. The age group of 3 to 4 year olds has the highest likelihood of being enrolled in private schools, with 1 (100.0% in the age bracket) enrolled. Conversely, the age group of 15 to 17 year olds has the lowest likelihood of being enrolled in a private school, with 26 (100.0% in the age bracket) attending a public institution.
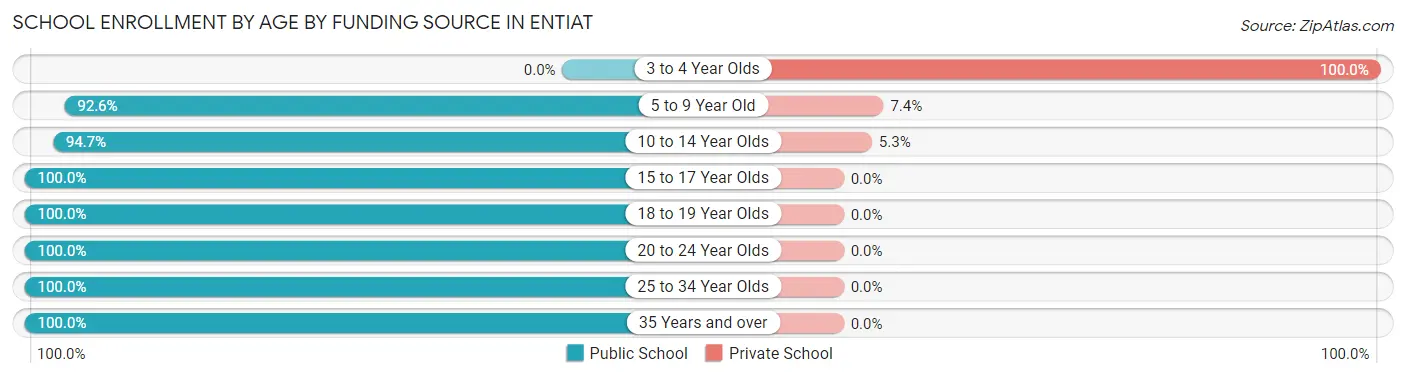
| Age Bracket | Public School | Private School |
| 3 to 4 Year Olds | 0 (0.0%) | 1 (100.0%) |
| 5 to 9 Year Old | 25 (92.6%) | 2 (7.4%) |
| 10 to 14 Year Olds | 36 (94.7%) | 2 (5.3%) |
| 15 to 17 Year Olds | 26 (100.0%) | 0 (0.0%) |
| 18 to 19 Year Olds | 26 (100.0%) | 0 (0.0%) |
| 20 to 24 Year Olds | 19 (100.0%) | 0 (0.0%) |
| 25 to 34 Year Olds | 23 (100.0%) | 0 (0.0%) |
| 35 Years and over | 12 (100.0%) | 0 (0.0%) |
| Total | 167 (97.1%) | 5 (2.9%) |
Educational Attainment by Field of Study in Entiat
Business (40 | 38.5%), education (22 | 21.1%), communications (9 | 8.6%), arts & humanities (7 | 6.7%), and social sciences (5 | 4.8%) are the most common fields of study among 104 individuals in Entiat who have obtained a bachelor's degree or higher.
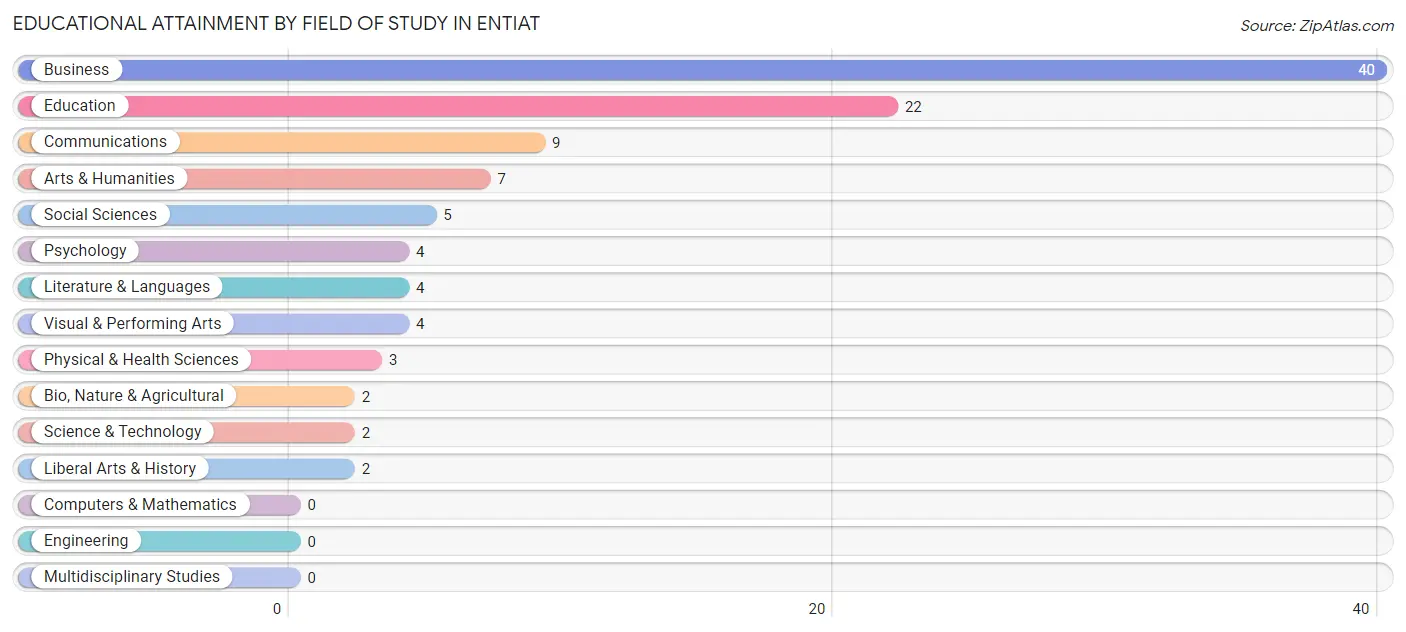
| Field of Study | # Graduates | % Graduates |
| Computers & Mathematics | 0 | 0.0% |
| Bio, Nature & Agricultural | 2 | 1.9% |
| Physical & Health Sciences | 3 | 2.9% |
| Psychology | 4 | 3.8% |
| Social Sciences | 5 | 4.8% |
| Engineering | 0 | 0.0% |
| Multidisciplinary Studies | 0 | 0.0% |
| Science & Technology | 2 | 1.9% |
| Business | 40 | 38.5% |
| Education | 22 | 21.1% |
| Literature & Languages | 4 | 3.8% |
| Liberal Arts & History | 2 | 1.9% |
| Visual & Performing Arts | 4 | 3.8% |
| Communications | 9 | 8.6% |
| Arts & Humanities | 7 | 6.7% |
| Total | 104 | 100.0% |
Transportation & Commute in Entiat
Vehicle Availability by Sex in Entiat
The most prevalent vehicle ownership categories in Entiat are males with 4 vehicles (121, accounting for 40.3%) and females with 4 vehicles (77, making up 45.3%).
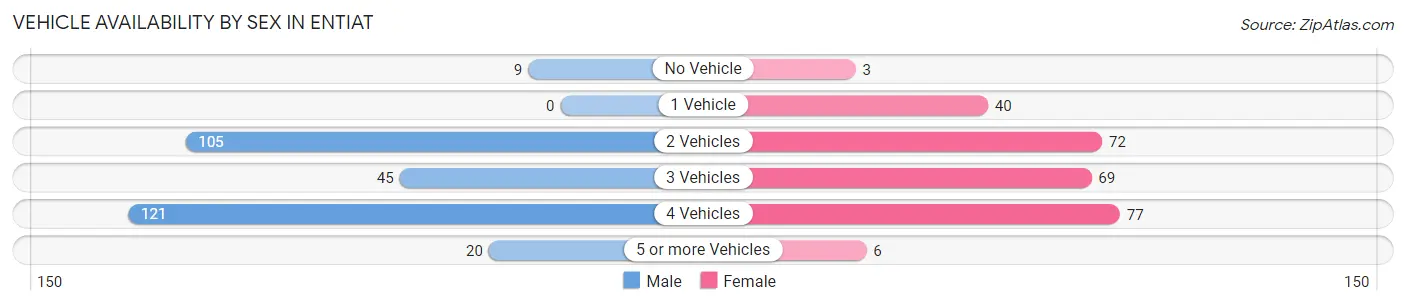
| Vehicles Available | Male | Female |
| No Vehicle | 9 (3.0%) | 3 (1.1%) |
| 1 Vehicle | 0 (0.0%) | 40 (15.0%) |
| 2 Vehicles | 105 (35.0%) | 72 (27.0%) |
| 3 Vehicles | 45 (15.0%) | 69 (25.8%) |
| 4 Vehicles | 121 (40.3%) | 77 (28.8%) |
| 5 or more Vehicles | 20 (6.7%) | 6 (2.2%) |
| Total | 300 (100.0%) | 267 (100.0%) |
Commute Time in Entiat
The most frequently occuring commute durations in Entiat are 30 to 34 minutes (97 commuters, 18.2%), 5 to 9 minutes (79 commuters, 14.8%), and 45 to 59 minutes (66 commuters, 12.4%).
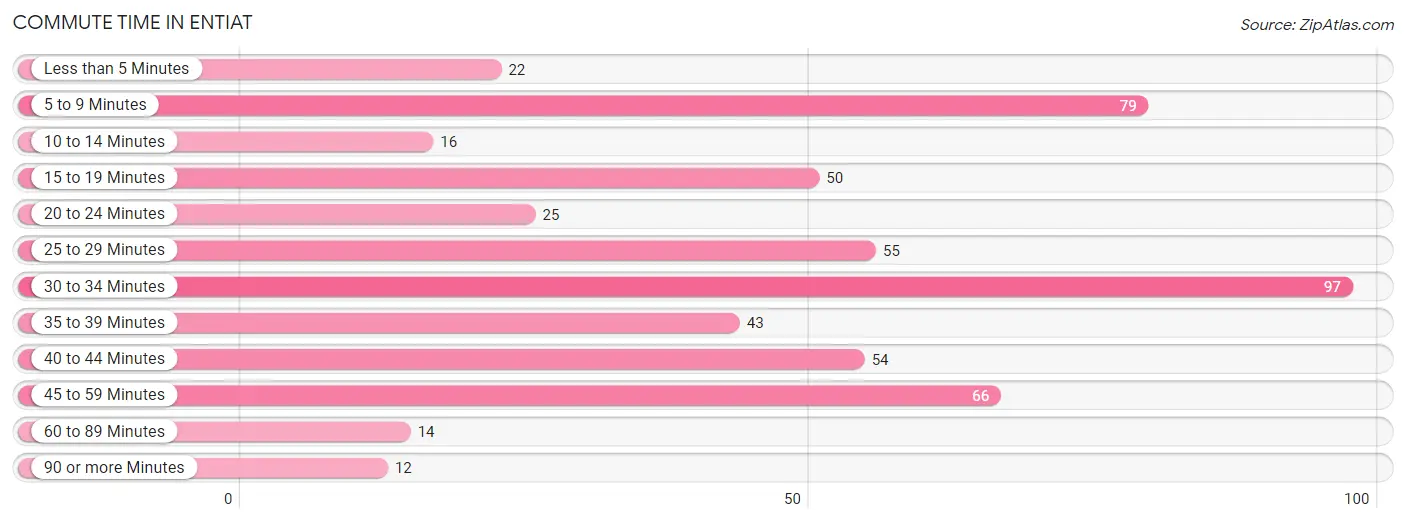
| Commute Time | # Commuters | % Commuters |
| Less than 5 Minutes | 22 | 4.1% |
| 5 to 9 Minutes | 79 | 14.8% |
| 10 to 14 Minutes | 16 | 3.0% |
| 15 to 19 Minutes | 50 | 9.4% |
| 20 to 24 Minutes | 25 | 4.7% |
| 25 to 29 Minutes | 55 | 10.3% |
| 30 to 34 Minutes | 97 | 18.2% |
| 35 to 39 Minutes | 43 | 8.1% |
| 40 to 44 Minutes | 54 | 10.1% |
| 45 to 59 Minutes | 66 | 12.4% |
| 60 to 89 Minutes | 14 | 2.6% |
| 90 or more Minutes | 12 | 2.2% |
Commute Time by Sex in Entiat
The most common commute times in Entiat are 5 to 9 minutes (60 commuters, 21.7%) for males and 30 to 34 minutes (60 commuters, 23.4%) for females.
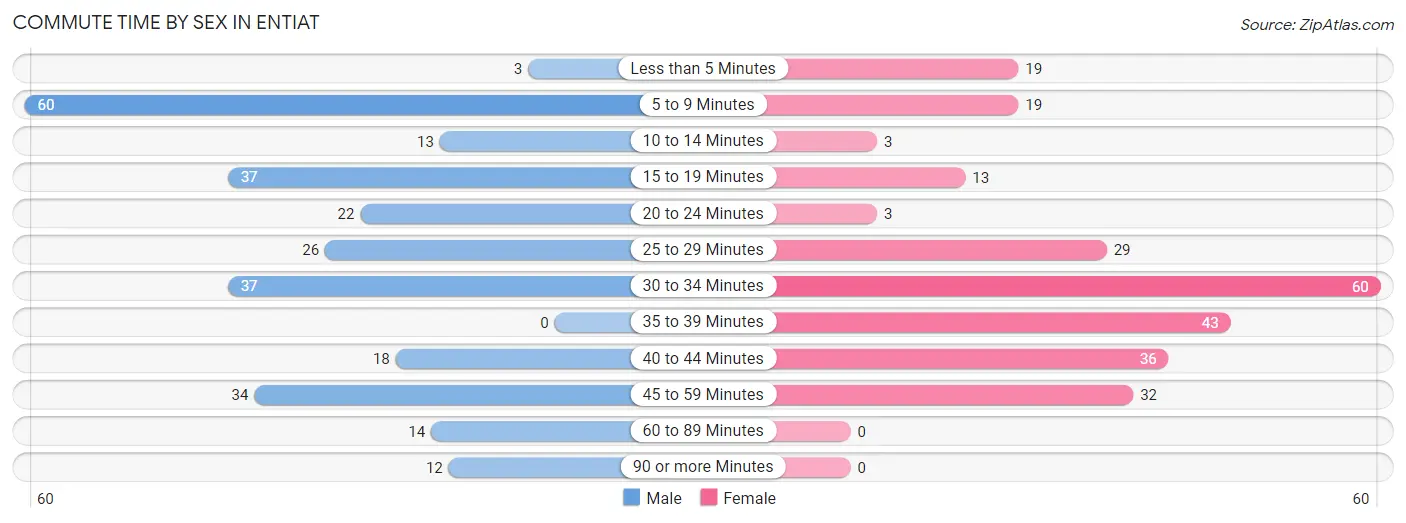
| Commute Time | Male | Female |
| Less than 5 Minutes | 3 (1.1%) | 19 (7.4%) |
| 5 to 9 Minutes | 60 (21.7%) | 19 (7.4%) |
| 10 to 14 Minutes | 13 (4.7%) | 3 (1.2%) |
| 15 to 19 Minutes | 37 (13.4%) | 13 (5.1%) |
| 20 to 24 Minutes | 22 (8.0%) | 3 (1.2%) |
| 25 to 29 Minutes | 26 (9.4%) | 29 (11.3%) |
| 30 to 34 Minutes | 37 (13.4%) | 60 (23.4%) |
| 35 to 39 Minutes | 0 (0.0%) | 43 (16.7%) |
| 40 to 44 Minutes | 18 (6.5%) | 36 (14.0%) |
| 45 to 59 Minutes | 34 (12.3%) | 32 (12.4%) |
| 60 to 89 Minutes | 14 (5.1%) | 0 (0.0%) |
| 90 or more Minutes | 12 (4.3%) | 0 (0.0%) |
Time of Departure to Work by Sex in Entiat
The most frequent times of departure to work in Entiat are 6:00 AM to 6:29 AM (51, 18.5%) for males and 6:00 AM to 6:29 AM (54, 21.0%) for females.
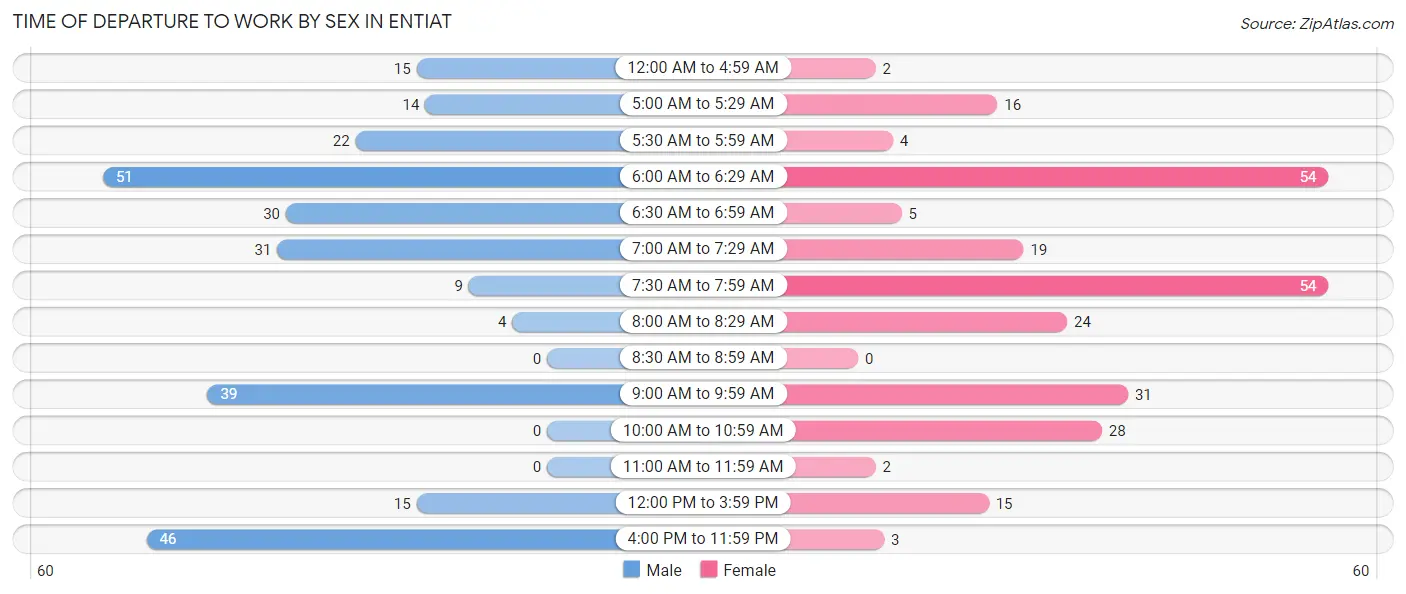
| Time of Departure | Male | Female |
| 12:00 AM to 4:59 AM | 15 (5.4%) | 2 (0.8%) |
| 5:00 AM to 5:29 AM | 14 (5.1%) | 16 (6.2%) |
| 5:30 AM to 5:59 AM | 22 (8.0%) | 4 (1.6%) |
| 6:00 AM to 6:29 AM | 51 (18.5%) | 54 (21.0%) |
| 6:30 AM to 6:59 AM | 30 (10.9%) | 5 (1.9%) |
| 7:00 AM to 7:29 AM | 31 (11.2%) | 19 (7.4%) |
| 7:30 AM to 7:59 AM | 9 (3.3%) | 54 (21.0%) |
| 8:00 AM to 8:29 AM | 4 (1.5%) | 24 (9.3%) |
| 8:30 AM to 8:59 AM | 0 (0.0%) | 0 (0.0%) |
| 9:00 AM to 9:59 AM | 39 (14.1%) | 31 (12.1%) |
| 10:00 AM to 10:59 AM | 0 (0.0%) | 28 (10.9%) |
| 11:00 AM to 11:59 AM | 0 (0.0%) | 2 (0.8%) |
| 12:00 PM to 3:59 PM | 15 (5.4%) | 15 (5.8%) |
| 4:00 PM to 11:59 PM | 46 (16.7%) | 3 (1.2%) |
| Total | 276 (100.0%) | 257 (100.0%) |
Housing Occupancy in Entiat
Occupancy by Ownership in Entiat
Of the total 396 dwellings in Entiat, owner-occupied units account for 289 (73.0%), while renter-occupied units make up 107 (27.0%).
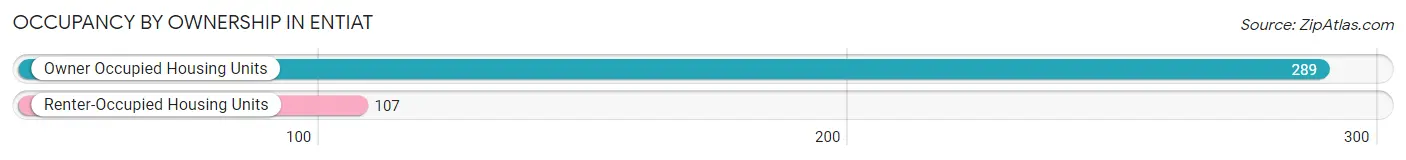
| Occupancy | # Housing Units | % Housing Units |
| Owner Occupied Housing Units | 289 | 73.0% |
| Renter-Occupied Housing Units | 107 | 27.0% |
| Total Occupied Housing Units | 396 | 100.0% |
Occupancy by Household Size in Entiat
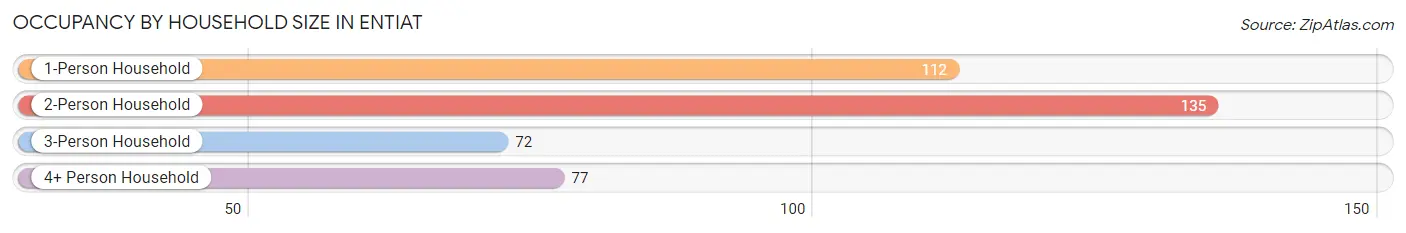
| Household Size | # Housing Units | % Housing Units |
| 1-Person Household | 112 | 28.3% |
| 2-Person Household | 135 | 34.1% |
| 3-Person Household | 72 | 18.2% |
| 4+ Person Household | 77 | 19.4% |
| Total Housing Units | 396 | 100.0% |
Occupancy by Ownership by Household Size in Entiat
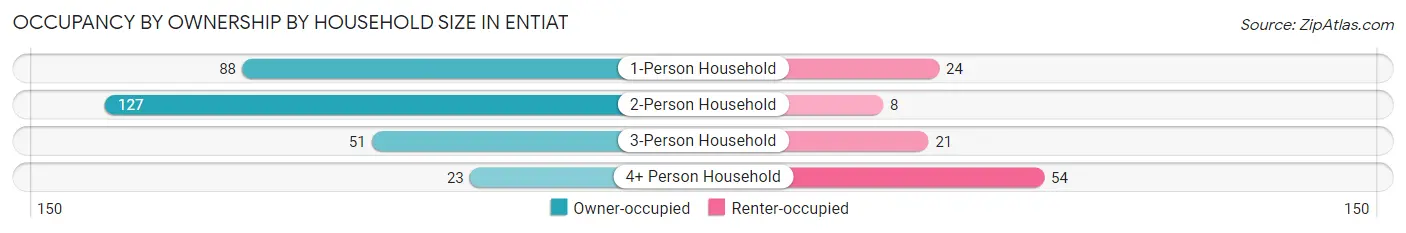
| Household Size | Owner-occupied | Renter-occupied |
| 1-Person Household | 88 (78.6%) | 24 (21.4%) |
| 2-Person Household | 127 (94.1%) | 8 (5.9%) |
| 3-Person Household | 51 (70.8%) | 21 (29.2%) |
| 4+ Person Household | 23 (29.9%) | 54 (70.1%) |
| Total Housing Units | 289 (73.0%) | 107 (27.0%) |
Occupancy by Educational Attainment in Entiat
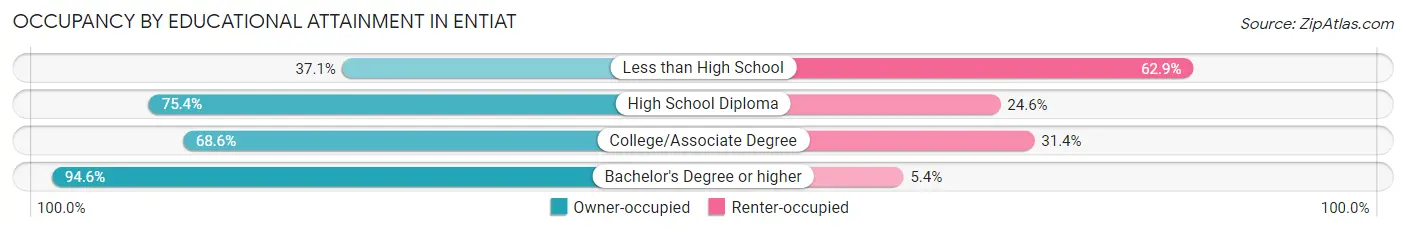
| Household Size | Owner-occupied | Renter-occupied |
| Less than High School | 13 (37.1%) | 22 (62.9%) |
| High School Diploma | 101 (75.4%) | 33 (24.6%) |
| College/Associate Degree | 105 (68.6%) | 48 (31.4%) |
| Bachelor's Degree or higher | 70 (94.6%) | 4 (5.4%) |
Occupancy by Age of Householder in Entiat
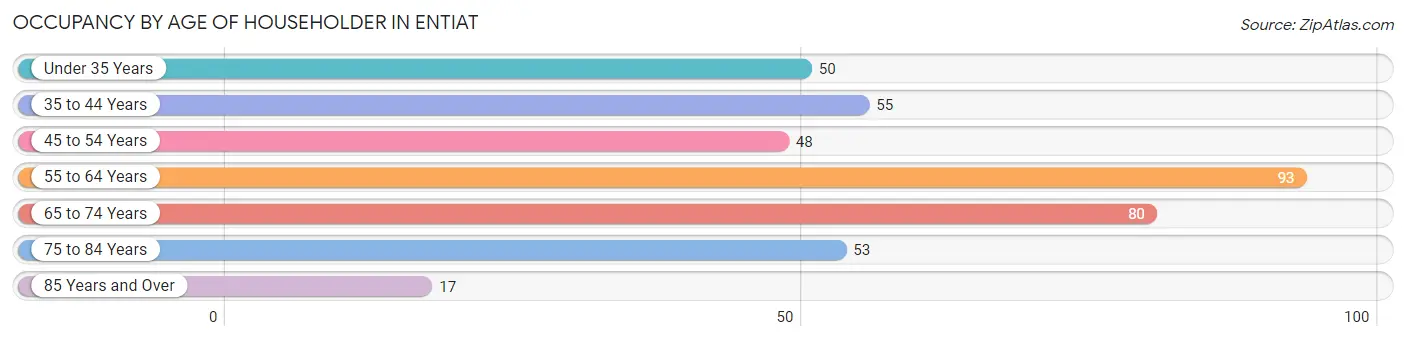
| Age Bracket | # Households | % Households |
| Under 35 Years | 50 | 12.6% |
| 35 to 44 Years | 55 | 13.9% |
| 45 to 54 Years | 48 | 12.1% |
| 55 to 64 Years | 93 | 23.5% |
| 65 to 74 Years | 80 | 20.2% |
| 75 to 84 Years | 53 | 13.4% |
| 85 Years and Over | 17 | 4.3% |
| Total | 396 | 100.0% |
Housing Finances in Entiat
Median Income by Occupancy in Entiat
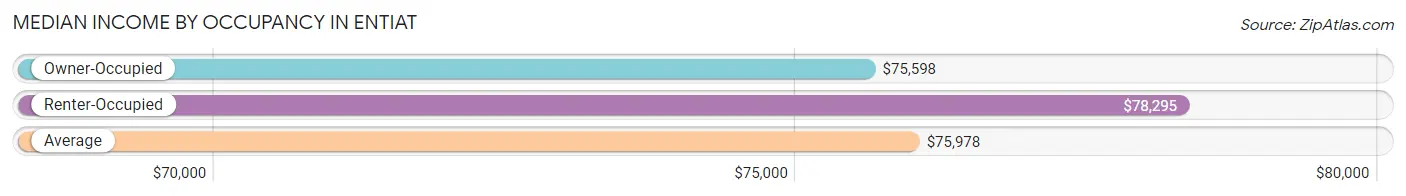
| Occupancy Type | # Households | Median Income |
| Owner-Occupied | 289 (73.0%) | $75,598 |
| Renter-Occupied | 107 (27.0%) | $78,295 |
| Average | 396 (100.0%) | $75,978 |
Occupancy by Householder Income Bracket in Entiat
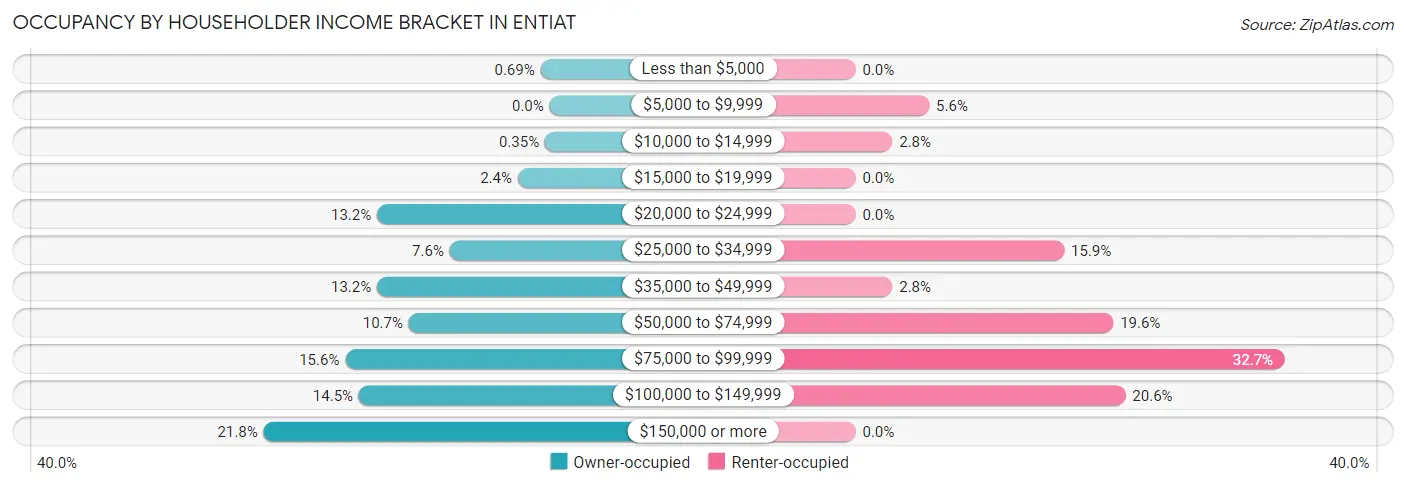
| Income Bracket | Owner-occupied | Renter-occupied |
| Less than $5,000 | 2 (0.7%) | 0 (0.0%) |
| $5,000 to $9,999 | 0 (0.0%) | 6 (5.6%) |
| $10,000 to $14,999 | 1 (0.4%) | 3 (2.8%) |
| $15,000 to $19,999 | 7 (2.4%) | 0 (0.0%) |
| $20,000 to $24,999 | 38 (13.2%) | 0 (0.0%) |
| $25,000 to $34,999 | 22 (7.6%) | 17 (15.9%) |
| $35,000 to $49,999 | 38 (13.2%) | 3 (2.8%) |
| $50,000 to $74,999 | 31 (10.7%) | 21 (19.6%) |
| $75,000 to $99,999 | 45 (15.6%) | 35 (32.7%) |
| $100,000 to $149,999 | 42 (14.5%) | 22 (20.6%) |
| $150,000 or more | 63 (21.8%) | 0 (0.0%) |
| Total | 289 (100.0%) | 107 (100.0%) |
Monthly Housing Cost Tiers in Entiat
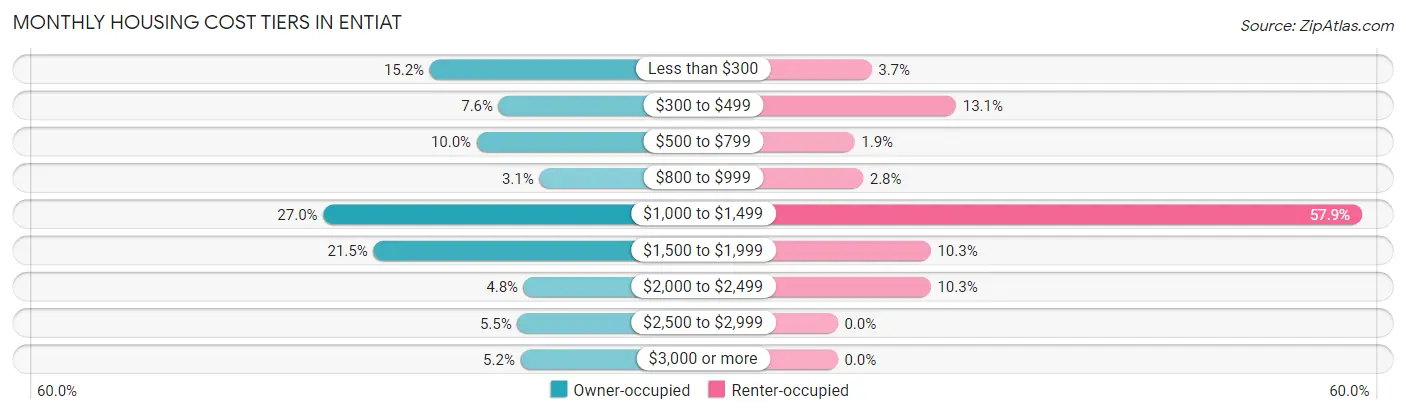
| Monthly Cost | Owner-occupied | Renter-occupied |
| Less than $300 | 44 (15.2%) | 4 (3.7%) |
| $300 to $499 | 22 (7.6%) | 14 (13.1%) |
| $500 to $799 | 29 (10.0%) | 2 (1.9%) |
| $800 to $999 | 9 (3.1%) | 3 (2.8%) |
| $1,000 to $1,499 | 78 (27.0%) | 62 (57.9%) |
| $1,500 to $1,999 | 62 (21.4%) | 11 (10.3%) |
| $2,000 to $2,499 | 14 (4.8%) | 11 (10.3%) |
| $2,500 to $2,999 | 16 (5.5%) | 0 (0.0%) |
| $3,000 or more | 15 (5.2%) | 0 (0.0%) |
| Total | 289 (100.0%) | 107 (100.0%) |
Physical Housing Characteristics in Entiat
Housing Structures in Entiat
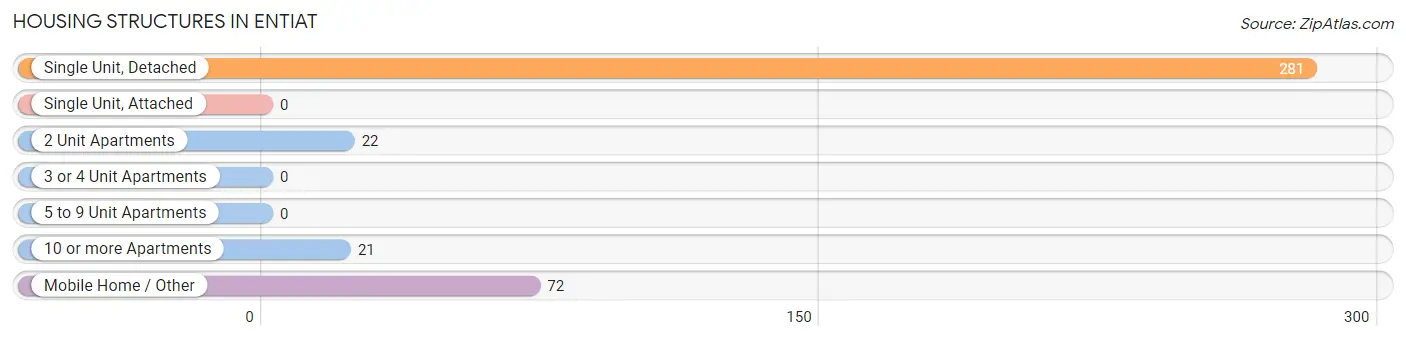
| Structure Type | # Housing Units | % Housing Units |
| Single Unit, Detached | 281 | 71.0% |
| Single Unit, Attached | 0 | 0.0% |
| 2 Unit Apartments | 22 | 5.6% |
| 3 or 4 Unit Apartments | 0 | 0.0% |
| 5 to 9 Unit Apartments | 0 | 0.0% |
| 10 or more Apartments | 21 | 5.3% |
| Mobile Home / Other | 72 | 18.2% |
| Total | 396 | 100.0% |
Housing Structures by Occupancy in Entiat
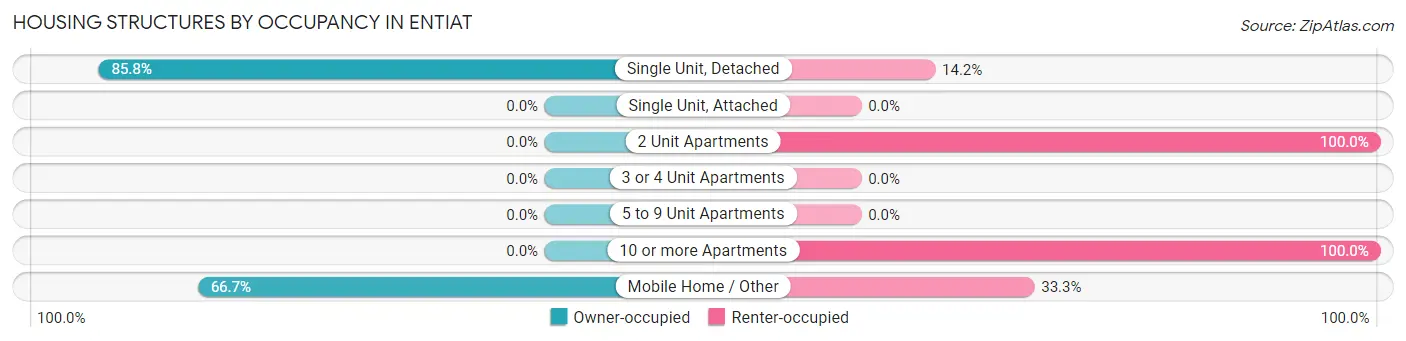
| Structure Type | Owner-occupied | Renter-occupied |
| Single Unit, Detached | 241 (85.8%) | 40 (14.2%) |
| Single Unit, Attached | 0 (0.0%) | 0 (0.0%) |
| 2 Unit Apartments | 0 (0.0%) | 22 (100.0%) |
| 3 or 4 Unit Apartments | 0 (0.0%) | 0 (0.0%) |
| 5 to 9 Unit Apartments | 0 (0.0%) | 0 (0.0%) |
| 10 or more Apartments | 0 (0.0%) | 21 (100.0%) |
| Mobile Home / Other | 48 (66.7%) | 24 (33.3%) |
| Total | 289 (73.0%) | 107 (27.0%) |
Housing Structures by Number of Rooms in Entiat
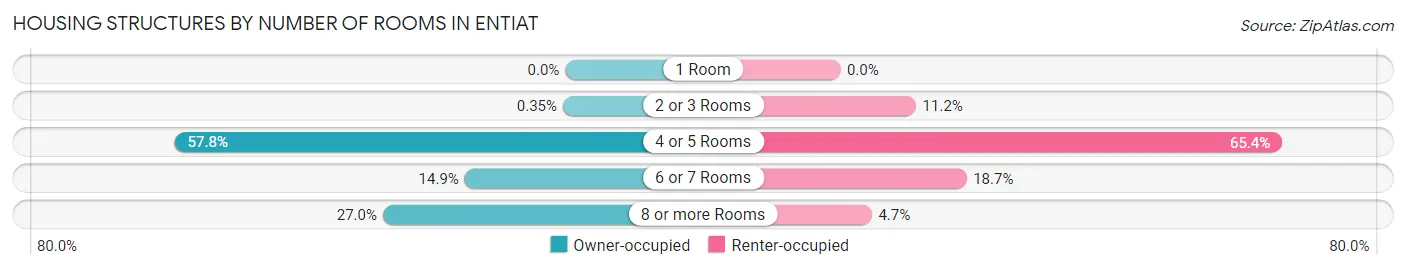
| Number of Rooms | Owner-occupied | Renter-occupied |
| 1 Room | 0 (0.0%) | 0 (0.0%) |
| 2 or 3 Rooms | 1 (0.4%) | 12 (11.2%) |
| 4 or 5 Rooms | 167 (57.8%) | 70 (65.4%) |
| 6 or 7 Rooms | 43 (14.9%) | 20 (18.7%) |
| 8 or more Rooms | 78 (27.0%) | 5 (4.7%) |
| Total | 289 (100.0%) | 107 (100.0%) |
Housing Structure by Heating Type in Entiat
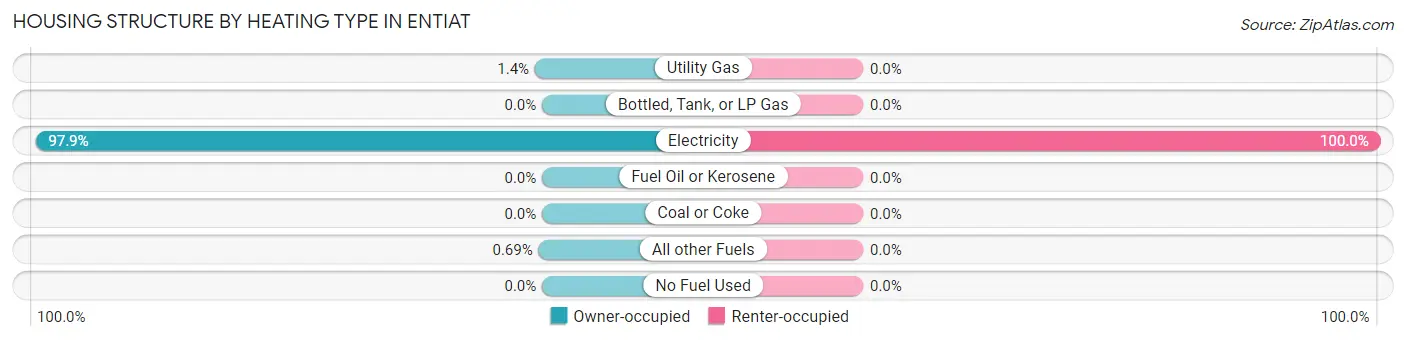
| Heating Type | Owner-occupied | Renter-occupied |
| Utility Gas | 4 (1.4%) | 0 (0.0%) |
| Bottled, Tank, or LP Gas | 0 (0.0%) | 0 (0.0%) |
| Electricity | 283 (97.9%) | 107 (100.0%) |
| Fuel Oil or Kerosene | 0 (0.0%) | 0 (0.0%) |
| Coal or Coke | 0 (0.0%) | 0 (0.0%) |
| All other Fuels | 2 (0.7%) | 0 (0.0%) |
| No Fuel Used | 0 (0.0%) | 0 (0.0%) |
| Total | 289 (100.0%) | 107 (100.0%) |
Household Vehicle Usage in Entiat
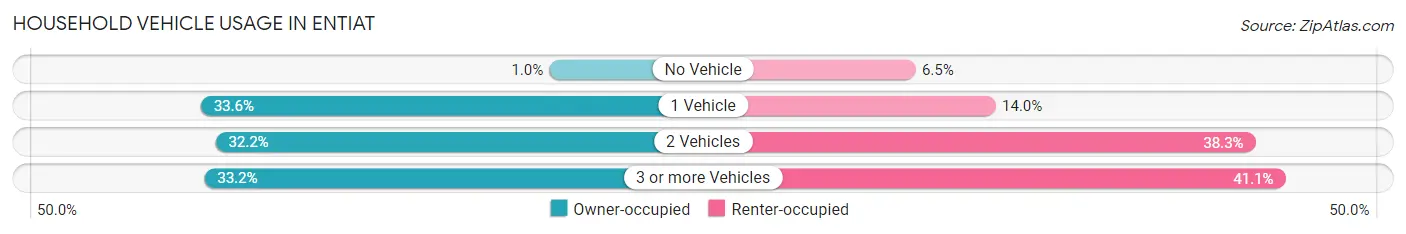
| Vehicles per Household | Owner-occupied | Renter-occupied |
| No Vehicle | 3 (1.0%) | 7 (6.5%) |
| 1 Vehicle | 97 (33.6%) | 15 (14.0%) |
| 2 Vehicles | 93 (32.2%) | 41 (38.3%) |
| 3 or more Vehicles | 96 (33.2%) | 44 (41.1%) |
| Total | 289 (100.0%) | 107 (100.0%) |
Real Estate & Mortgages in Entiat
Real Estate and Mortgage Overview in Entiat
| Characteristic | Without Mortgage | With Mortgage |
| Housing Units | 104 | 185 |
| Median Property Value | $265,600 | $296,600 |
| Median Household Income | - | - |
| Monthly Housing Costs | $423 | $15 |
| Real Estate Taxes | - | - |
Property Value by Mortgage Status in Entiat
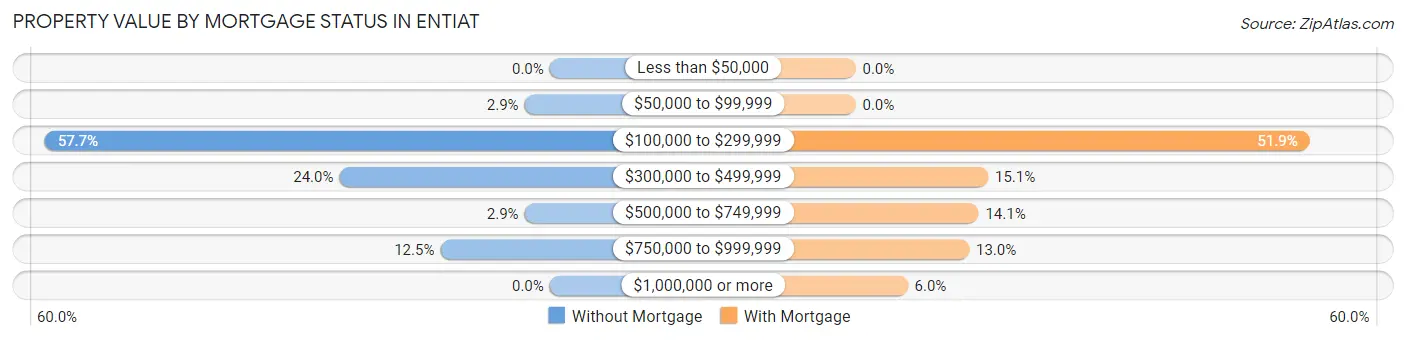
| Property Value | Without Mortgage | With Mortgage |
| Less than $50,000 | 0 (0.0%) | 0 (0.0%) |
| $50,000 to $99,999 | 3 (2.9%) | 0 (0.0%) |
| $100,000 to $299,999 | 60 (57.7%) | 96 (51.9%) |
| $300,000 to $499,999 | 25 (24.0%) | 28 (15.1%) |
| $500,000 to $749,999 | 3 (2.9%) | 26 (14.1%) |
| $750,000 to $999,999 | 13 (12.5%) | 24 (13.0%) |
| $1,000,000 or more | 0 (0.0%) | 11 (5.9%) |
| Total | 104 (100.0%) | 185 (100.0%) |
Household Income by Mortgage Status in Entiat
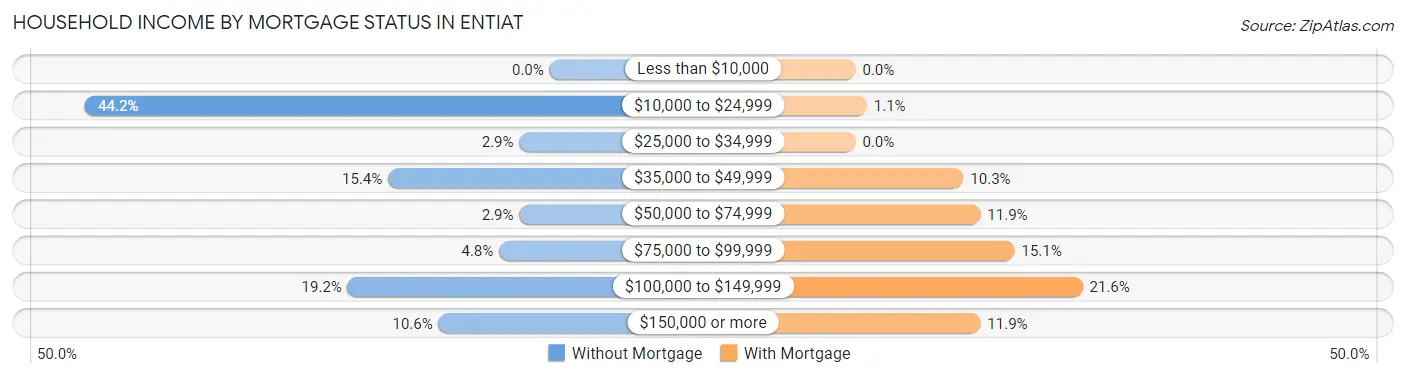
| Household Income | Without Mortgage | With Mortgage |
| Less than $10,000 | 0 (0.0%) | 0 (0.0%) |
| $10,000 to $24,999 | 46 (44.2%) | 2 (1.1%) |
| $25,000 to $34,999 | 3 (2.9%) | 0 (0.0%) |
| $35,000 to $49,999 | 16 (15.4%) | 19 (10.3%) |
| $50,000 to $74,999 | 3 (2.9%) | 22 (11.9%) |
| $75,000 to $99,999 | 5 (4.8%) | 28 (15.1%) |
| $100,000 to $149,999 | 20 (19.2%) | 40 (21.6%) |
| $150,000 or more | 11 (10.6%) | 22 (11.9%) |
| Total | 104 (100.0%) | 185 (100.0%) |
Property Value to Household Income Ratio in Entiat
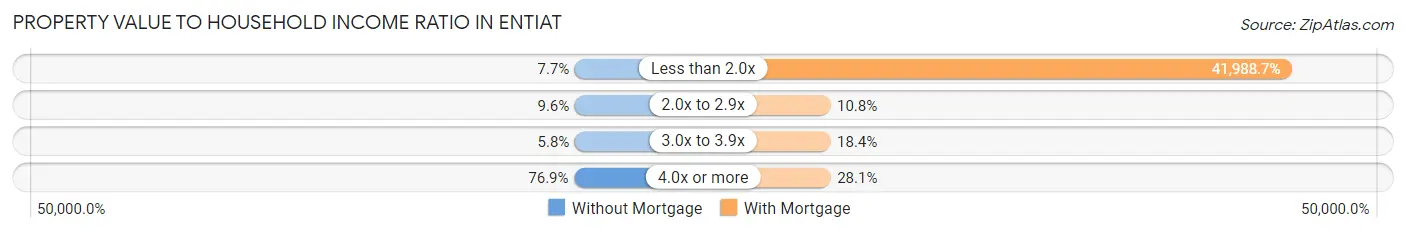
| Value-to-Income Ratio | Without Mortgage | With Mortgage |
| Less than 2.0x | 8 (7.7%) | 77,679 (41,988.7%) |
| 2.0x to 2.9x | 10 (9.6%) | 20 (10.8%) |
| 3.0x to 3.9x | 6 (5.8%) | 34 (18.4%) |
| 4.0x or more | 80 (76.9%) | 52 (28.1%) |
| Total | 104 (100.0%) | 185 (100.0%) |
Real Estate Taxes by Mortgage Status in Entiat
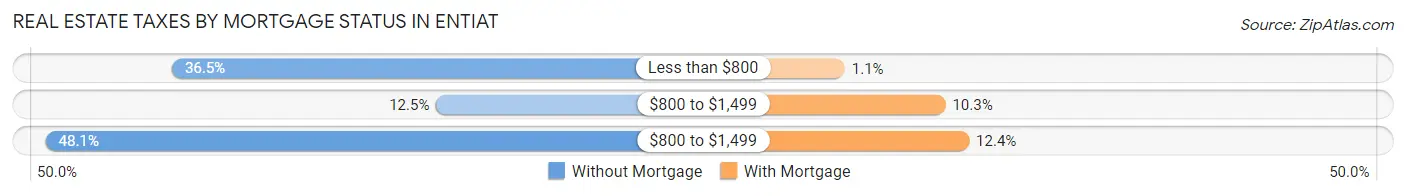
| Property Taxes | Without Mortgage | With Mortgage |
| Less than $800 | 38 (36.5%) | 2 (1.1%) |
| $800 to $1,499 | 13 (12.5%) | 19 (10.3%) |
| $800 to $1,499 | 50 (48.1%) | 23 (12.4%) |
| Total | 104 (100.0%) | 185 (100.0%) |
Health & Disability in Entiat
Health Insurance Coverage by Age in Entiat
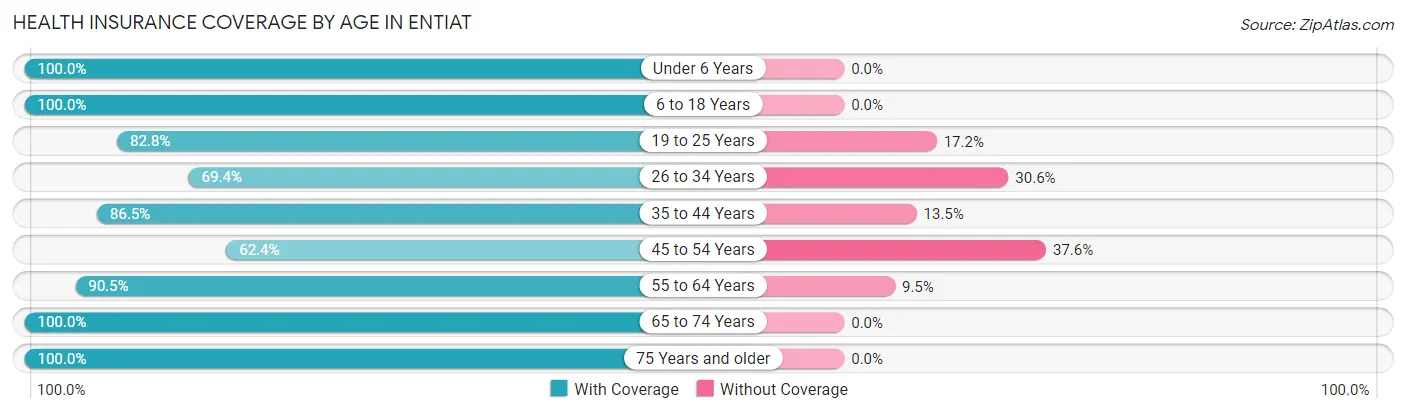
| Age Bracket | With Coverage | Without Coverage |
| Under 6 Years | 45 (100.0%) | 0 (0.0%) |
| 6 to 18 Years | 131 (100.0%) | 0 (0.0%) |
| 19 to 25 Years | 120 (82.8%) | 25 (17.2%) |
| 26 to 34 Years | 93 (69.4%) | 41 (30.6%) |
| 35 to 44 Years | 109 (86.5%) | 17 (13.5%) |
| 45 to 54 Years | 63 (62.4%) | 38 (37.6%) |
| 55 to 64 Years | 134 (90.5%) | 14 (9.5%) |
| 65 to 74 Years | 106 (100.0%) | 0 (0.0%) |
| 75 Years and older | 102 (100.0%) | 0 (0.0%) |
| Total | 903 (87.0%) | 135 (13.0%) |
Health Insurance Coverage by Citizenship Status in Entiat
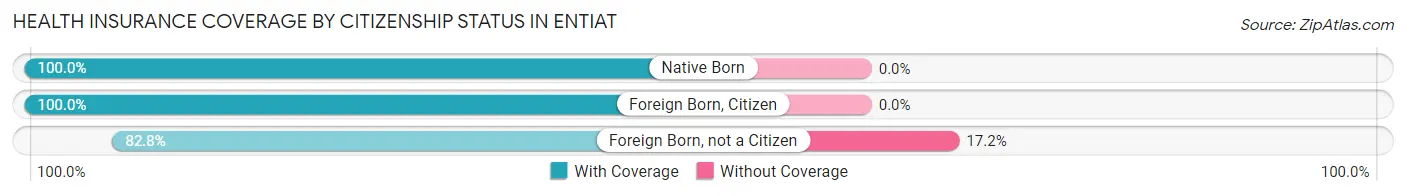
| Citizenship Status | With Coverage | Without Coverage |
| Native Born | 45 (100.0%) | 0 (0.0%) |
| Foreign Born, Citizen | 131 (100.0%) | 0 (0.0%) |
| Foreign Born, not a Citizen | 120 (82.8%) | 25 (17.2%) |
Health Insurance Coverage by Household Income in Entiat
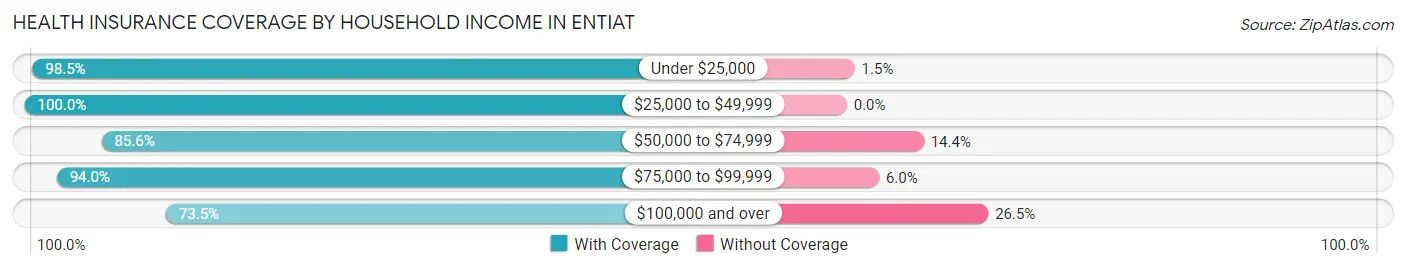
| Household Income | With Coverage | Without Coverage |
| Under $25,000 | 67 (98.5%) | 1 (1.5%) |
| $25,000 to $49,999 | 157 (100.0%) | 0 (0.0%) |
| $50,000 to $74,999 | 95 (85.6%) | 16 (14.4%) |
| $75,000 to $99,999 | 312 (94.0%) | 20 (6.0%) |
| $100,000 and over | 272 (73.5%) | 98 (26.5%) |
Public vs Private Health Insurance Coverage by Age in Entiat
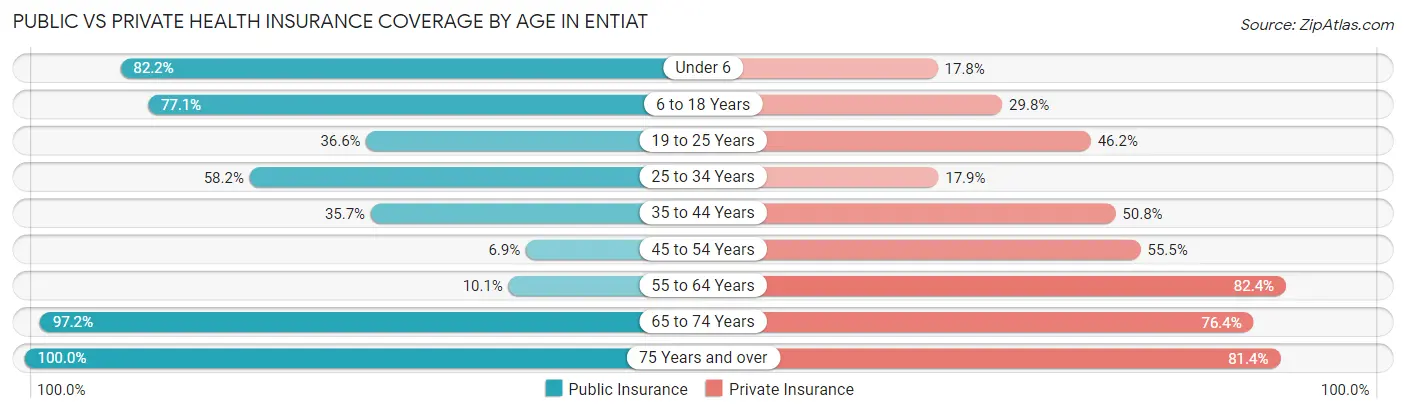
| Age Bracket | Public Insurance | Private Insurance |
| Under 6 | 37 (82.2%) | 8 (17.8%) |
| 6 to 18 Years | 101 (77.1%) | 39 (29.8%) |
| 19 to 25 Years | 53 (36.5%) | 67 (46.2%) |
| 25 to 34 Years | 78 (58.2%) | 24 (17.9%) |
| 35 to 44 Years | 45 (35.7%) | 64 (50.8%) |
| 45 to 54 Years | 7 (6.9%) | 56 (55.4%) |
| 55 to 64 Years | 15 (10.1%) | 122 (82.4%) |
| 65 to 74 Years | 103 (97.2%) | 81 (76.4%) |
| 75 Years and over | 102 (100.0%) | 83 (81.4%) |
| Total | 541 (52.1%) | 544 (52.4%) |
Disability Status by Sex by Age in Entiat
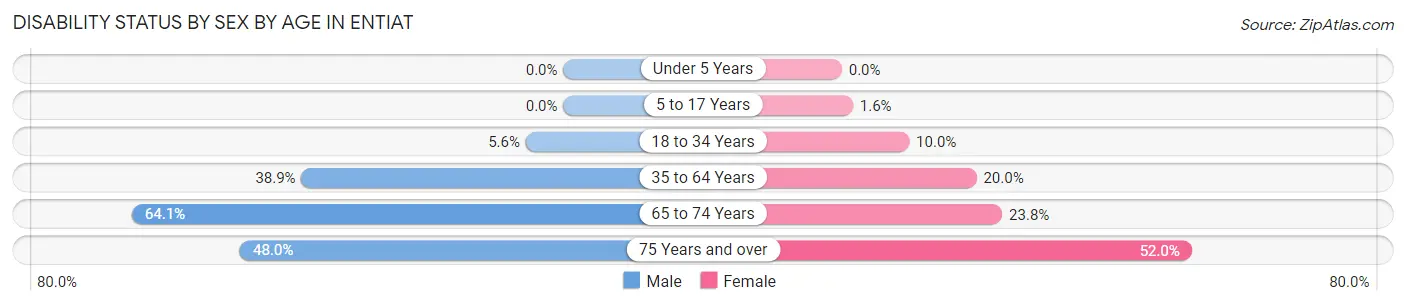
| Age Bracket | Male | Female |
| Under 5 Years | 0 (0.0%) | 0 (0.0%) |
| 5 to 17 Years | 0 (0.0%) | 1 (1.6%) |
| 18 to 34 Years | 11 (5.6%) | 13 (10.0%) |
| 35 to 64 Years | 70 (38.9%) | 39 (20.0%) |
| 65 to 74 Years | 41 (64.1%) | 10 (23.8%) |
| 75 Years and over | 12 (48.0%) | 40 (51.9%) |
Disability Class by Sex by Age in Entiat
Disability Class: Hearing Difficulty
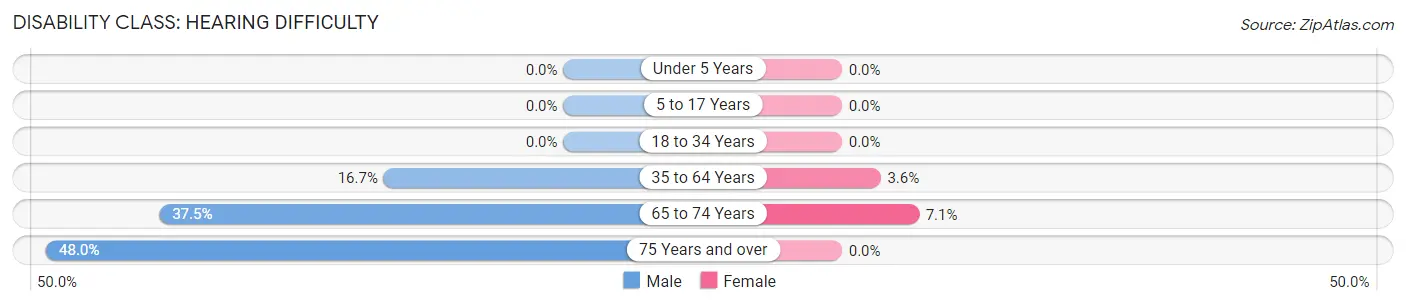
| Age Bracket | Male | Female |
| Under 5 Years | 0 (0.0%) | 0 (0.0%) |
| 5 to 17 Years | 0 (0.0%) | 0 (0.0%) |
| 18 to 34 Years | 0 (0.0%) | 0 (0.0%) |
| 35 to 64 Years | 30 (16.7%) | 7 (3.6%) |
| 65 to 74 Years | 24 (37.5%) | 3 (7.1%) |
| 75 Years and over | 12 (48.0%) | 0 (0.0%) |
Disability Class: Vision Difficulty
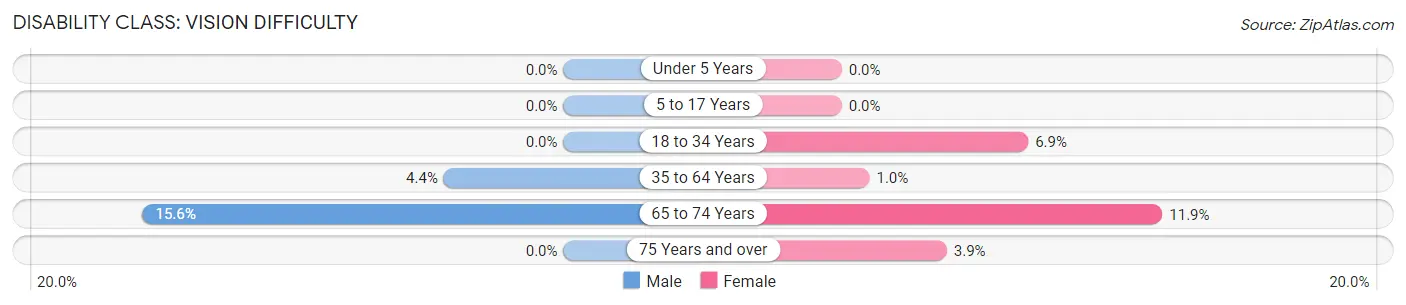
| Age Bracket | Male | Female |
| Under 5 Years | 0 (0.0%) | 0 (0.0%) |
| 5 to 17 Years | 0 (0.0%) | 0 (0.0%) |
| 18 to 34 Years | 0 (0.0%) | 9 (6.9%) |
| 35 to 64 Years | 8 (4.4%) | 2 (1.0%) |
| 65 to 74 Years | 10 (15.6%) | 5 (11.9%) |
| 75 Years and over | 0 (0.0%) | 3 (3.9%) |
Disability Class: Cognitive Difficulty
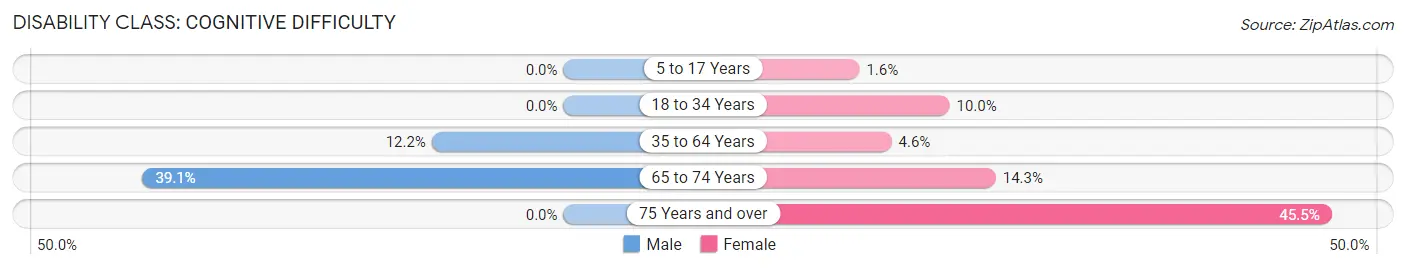
| Age Bracket | Male | Female |
| 5 to 17 Years | 0 (0.0%) | 1 (1.6%) |
| 18 to 34 Years | 0 (0.0%) | 13 (10.0%) |
| 35 to 64 Years | 22 (12.2%) | 9 (4.6%) |
| 65 to 74 Years | 25 (39.1%) | 6 (14.3%) |
| 75 Years and over | 0 (0.0%) | 35 (45.5%) |
Disability Class: Ambulatory Difficulty
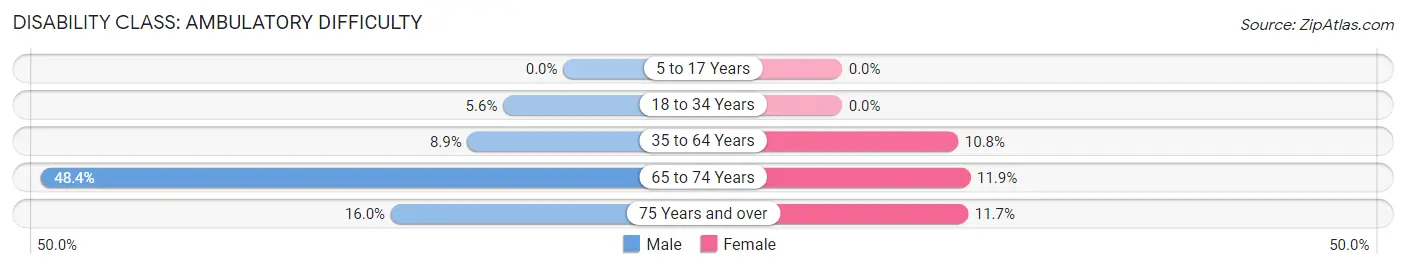
| Age Bracket | Male | Female |
| 5 to 17 Years | 0 (0.0%) | 0 (0.0%) |
| 18 to 34 Years | 11 (5.6%) | 0 (0.0%) |
| 35 to 64 Years | 16 (8.9%) | 21 (10.8%) |
| 65 to 74 Years | 31 (48.4%) | 5 (11.9%) |
| 75 Years and over | 4 (16.0%) | 9 (11.7%) |
Disability Class: Self-Care Difficulty
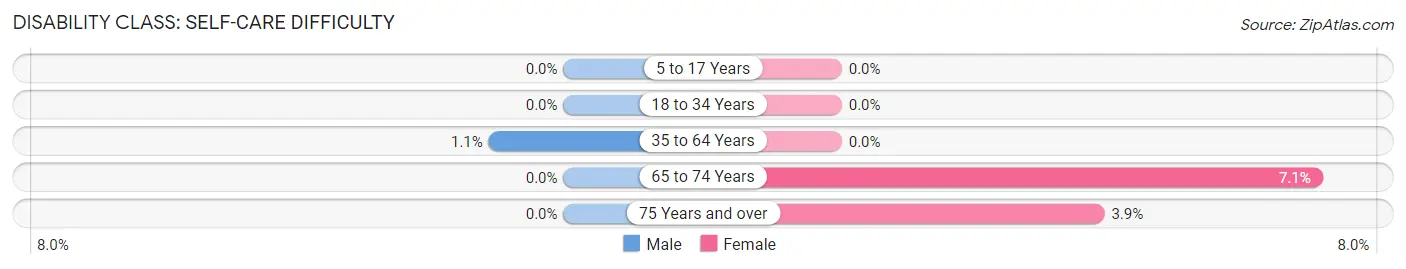
| Age Bracket | Male | Female |
| 5 to 17 Years | 0 (0.0%) | 0 (0.0%) |
| 18 to 34 Years | 0 (0.0%) | 0 (0.0%) |
| 35 to 64 Years | 2 (1.1%) | 0 (0.0%) |
| 65 to 74 Years | 0 (0.0%) | 3 (7.1%) |
| 75 Years and over | 0 (0.0%) | 3 (3.9%) |
Technology Access in Entiat
Computing Device Access in Entiat
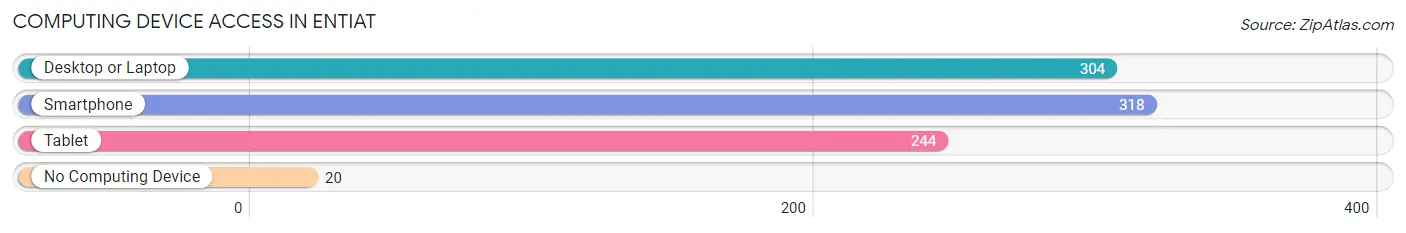
| Device Type | # Households | % Households |
| Desktop or Laptop | 304 | 76.8% |
| Smartphone | 318 | 80.3% |
| Tablet | 244 | 61.6% |
| No Computing Device | 20 | 5.1% |
| Total | 396 | 100.0% |
Internet Access in Entiat
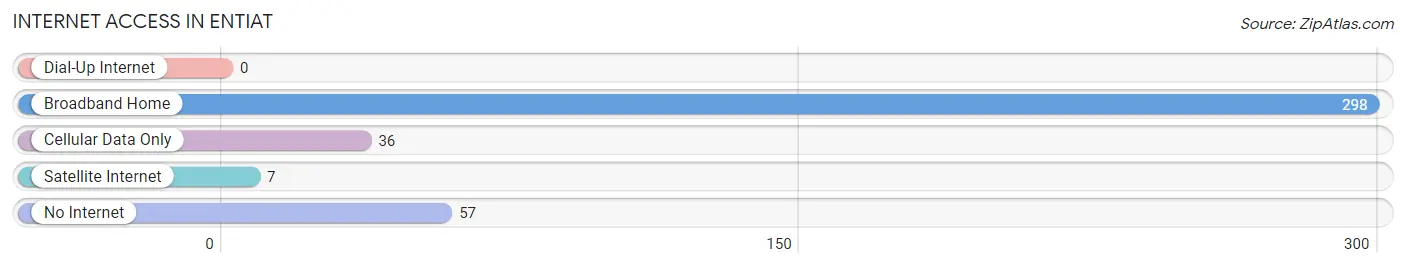
| Internet Type | # Households | % Households |
| Dial-Up Internet | 0 | 0.0% |
| Broadband Home | 298 | 75.2% |
| Cellular Data Only | 36 | 9.1% |
| Satellite Internet | 7 | 1.8% |
| No Internet | 57 | 14.4% |
| Total | 396 | 100.0% |
Entiat Summary
Entiat is a small town located in Chelan County, Washington, United States. It is situated on the Columbia River, approximately 10 miles east of the city of Wenatchee. The population of Entiat was 1,890 at the 2010 census.
History
The area that is now Entiat was first inhabited by the Wenatchi Indians, who lived in the area for thousands of years before the arrival of European settlers. The first white settlers arrived in the area in the late 1800s, and the town of Entiat was officially founded in 1909. The town was named after the Entiat River, which was named by explorer George Gibbs in 1853.
The town of Entiat was originally a logging and farming community, and the economy was largely based on these two industries. In the early 1900s, the town was home to several sawmills and logging camps. The town also had a thriving fruit industry, with several orchards and fruit packing plants.
In the 1950s, the town began to experience a decline in its economy as the logging and farming industries began to decline. In the 1960s, the town began to experience a resurgence in its economy as the tourism industry began to grow. The town is now home to several wineries, a golf course, and several other tourist attractions.
Geography
Entiat is located in the Columbia River Valley, approximately 10 miles east of the city of Wenatchee. The town is situated on the banks of the Columbia River, and is surrounded by the Cascade Mountains. The town has a total area of 2.2 square miles, all of which is land.
The climate in Entiat is generally mild, with warm summers and cool winters. The average temperature in the summer is around 75 degrees Fahrenheit, and the average temperature in the winter is around 35 degrees Fahrenheit.
Economy
The economy of Entiat is largely based on tourism and agriculture. The town is home to several wineries, a golf course, and several other tourist attractions. The town also has several orchards and fruit packing plants, and is home to several small businesses.
Demographics
As of the 2010 census, the population of Entiat was 1,890. The racial makeup of the town was 90.3% White, 0.3% African American, 0.7% Native American, 0.7% Asian, 0.1% Pacific Islander, 5.2% from other races, and 2.1% from two or more races. Hispanic or Latino of any race were 8.2% of the population.
The median income for a household in Entiat was $37,917, and the median income for a family was $45,000. The per capita income for the town was $19,945. About 11.2% of families and 14.2% of the population were below the poverty line, including 18.2% of those under age 18 and 8.3% of those age 65 or over.
Common Questions
What is Per Capita Income in Entiat?
Per Capita income in Entiat is $38,019.
What is the Median Family Income in Entiat?
Median Family Income in Entiat is $86,063.
What is the Median Household income in Entiat?
Median Household Income in Entiat is $75,978.
What is Income or Wage Gap in Entiat?
Income or Wage Gap in Entiat is 6.0%.
Women in Entiat earn 94.0 cents for every dollar earned by a man.
What is Inequality or Gini Index in Entiat?
Inequality or Gini Index in Entiat is 0.43.
What is the Total Population of Entiat?
Total Population of Entiat is 1,038.
What is the Total Male Population of Entiat?
Total Male Population of Entiat is 503.
What is the Total Female Population of Entiat?
Total Female Population of Entiat is 535.
What is the Ratio of Males per 100 Females in Entiat?
There are 94.02 Males per 100 Females in Entiat.
What is the Ratio of Females per 100 Males in Entiat?
There are 106.36 Females per 100 Males in Entiat.
What is the Median Population Age in Entiat?
Median Population Age in Entiat is 42.3 Years.
What is the Average Family Size in Entiat
Average Family Size in Entiat is 3.2 People.
What is the Average Household Size in Entiat
Average Household Size in Entiat is 2.6 People.
How Large is the Labor Force in Entiat?
There are 600 People in the Labor Forcein in Entiat.
What is the Percentage of People in the Labor Force in Entiat?
64.4% of People are in the Labor Force in Entiat.
What is the Unemployment Rate in Entiat?
Unemployment Rate in Entiat is 5.5%.