Zip Codes with the Highest Percentage of Population Employed in Real Estate, Rental & Leasing in Bellingham, WA
RELATED REPORTS & OPTIONS
Real Estate, Rental & Leasing
Bellingham
Compare Zip Codes
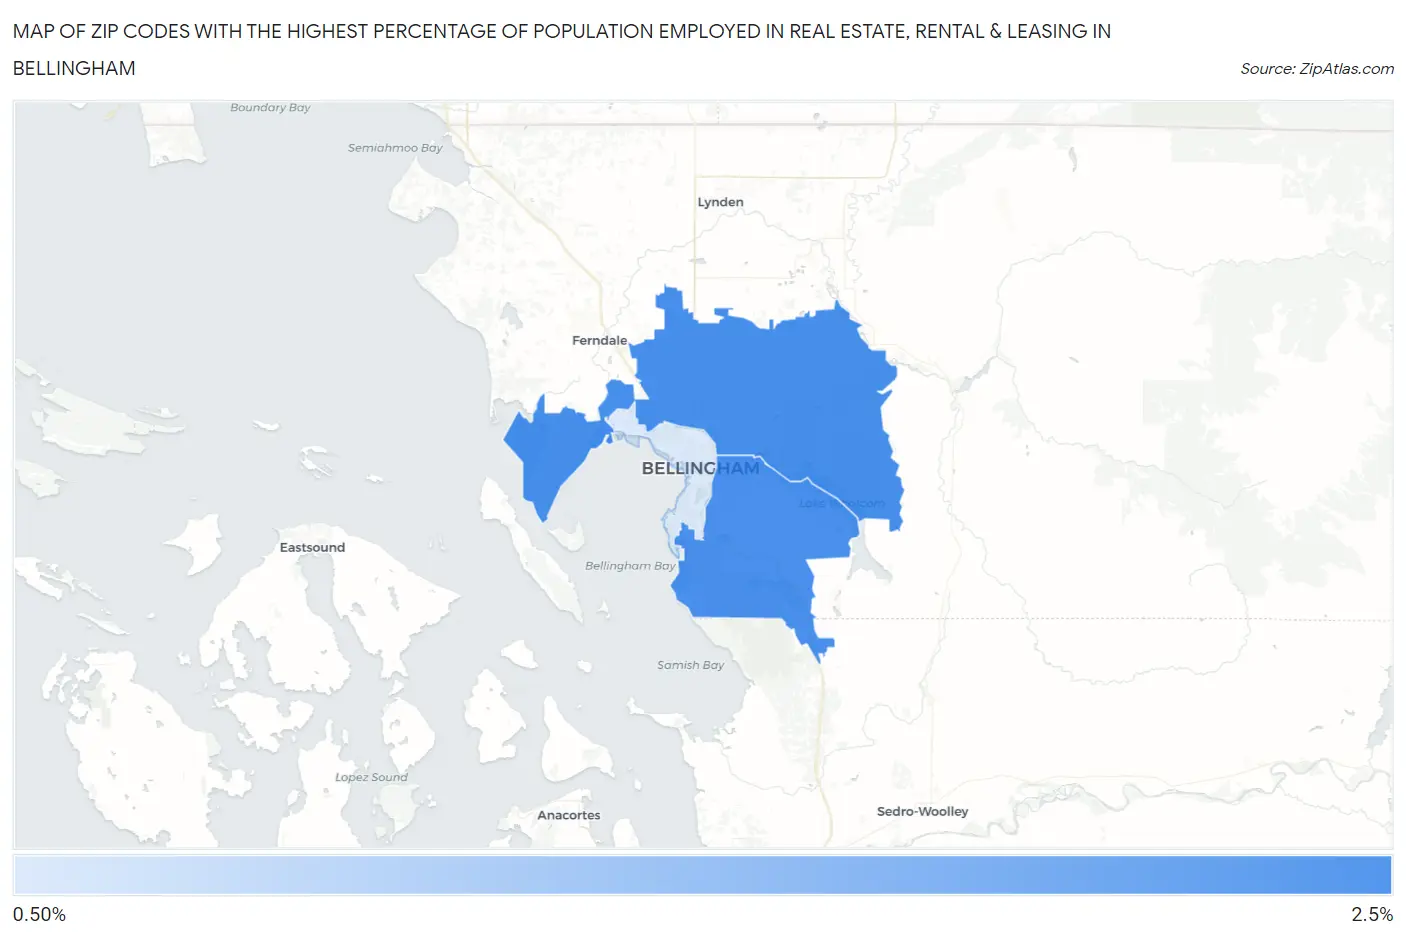
Map of Zip Codes with the Highest Percentage of Population Employed in Real Estate, Rental & Leasing in Bellingham
1.4%
2.1%
Zip Codes with the Highest Percentage of Population Employed in Real Estate, Rental & Leasing in Bellingham, WA
| Zip Code | % Employed | vs State | vs National | |
| 1. | 98226 | 2.1% | 2.1%(+0.030)#198 | 1.9%(+0.236)#7,182 |
| 2. | 98229 | 2.1% | 2.1%(+0.018)#202 | 1.9%(+0.223)#7,242 |
| 3. | 98225 | 1.4% | 2.1%(-0.730)#314 | 1.9%(-0.525)#12,230 |
1
Common Questions
What are the Top Zip Codes with the Highest Percentage of Population Employed in Real Estate, Rental & Leasing in Bellingham, WA?
Top Zip Codes with the Highest Percentage of Population Employed in Real Estate, Rental & Leasing in Bellingham, WA are:
What zip code has the Highest Percentage of Population Employed in Real Estate, Rental & Leasing in Bellingham, WA?
98226 has the Highest Percentage of Population Employed in Real Estate, Rental & Leasing in Bellingham, WA with 2.1%.
What is the Percentage of Population Employed in Real Estate, Rental & Leasing in Bellingham, WA?
Percentage of Population Employed in Real Estate, Rental & Leasing in Bellingham is 1.7%.
What is the Percentage of Population Employed in Real Estate, Rental & Leasing in Washington?
Percentage of Population Employed in Real Estate, Rental & Leasing in Washington is 2.1%.
What is the Percentage of Population Employed in Real Estate, Rental & Leasing in the United States?
Percentage of Population Employed in Real Estate, Rental & Leasing in the United States is 1.9%.