Zip Codes with the Highest Percentage of Population Employed in Real Estate, Rental & Leasing in Seattle, WA
RELATED REPORTS & OPTIONS
Real Estate, Rental & Leasing
Seattle
Compare Zip Codes
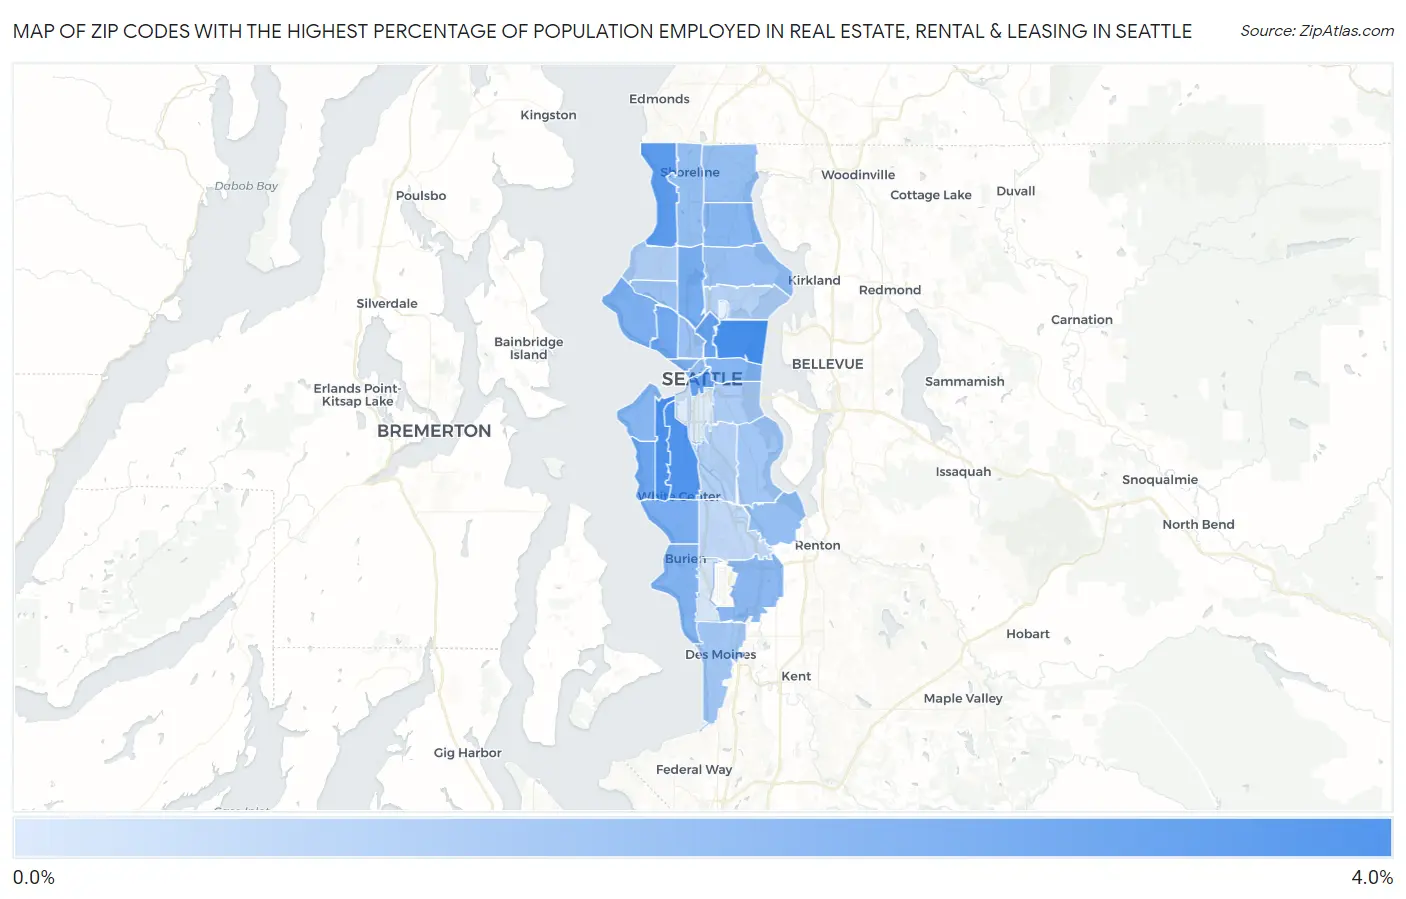
Map of Zip Codes with the Highest Percentage of Population Employed in Real Estate, Rental & Leasing in Seattle
0.99%
3.7%
Zip Codes with the Highest Percentage of Population Employed in Real Estate, Rental & Leasing in Seattle, WA
| Zip Code | % Employed | vs State | vs National | |
| 1. | 98112 | 3.7% | 2.1%(+1.61)#60 | 1.9%(+1.81)#2,517 |
| 2. | 98126 | 3.6% | 2.1%(+1.53)#62 | 1.9%(+1.73)#2,629 |
| 3. | 98106 | 3.5% | 2.1%(+1.44)#65 | 1.9%(+1.65)#2,771 |
| 4. | 98177 | 3.3% | 2.1%(+1.20)#76 | 1.9%(+1.40)#3,221 |
| 5. | 98104 | 3.1% | 2.1%(+1.05)#84 | 1.9%(+1.26)#3,524 |
| 6. | 98102 | 3.1% | 2.1%(+1.03)#85 | 1.9%(+1.23)#3,579 |
| 7. | 98136 | 3.0% | 2.1%(+0.872)#100 | 1.9%(+1.08)#3,983 |
| 8. | 98119 | 2.9% | 2.1%(+0.825)#103 | 1.9%(+1.03)#4,107 |
| 9. | 98103 | 2.8% | 2.1%(+0.730)#113 | 1.9%(+0.935)#4,361 |
| 10. | 98146 | 2.8% | 2.1%(+0.674)#116 | 1.9%(+0.880)#4,514 |
| 11. | 98199 | 2.7% | 2.1%(+0.583)#123 | 1.9%(+0.788)#4,810 |
| 12. | 98121 | 2.6% | 2.1%(+0.541)#127 | 1.9%(+0.746)#4,975 |
| 13. | 98166 | 2.6% | 2.1%(+0.502)#133 | 1.9%(+0.708)#5,105 |
| 14. | 98122 | 2.6% | 2.1%(+0.458)#141 | 1.9%(+0.664)#5,272 |
| 15. | 98116 | 2.5% | 2.1%(+0.439)#143 | 1.9%(+0.645)#5,343 |
| 16. | 98125 | 2.5% | 2.1%(+0.432)#145 | 1.9%(+0.637)#5,379 |
| 17. | 98188 | 2.4% | 2.1%(+0.333)#159 | 1.9%(+0.538)#5,762 |
| 18. | 98178 | 2.3% | 2.1%(+0.200)#175 | 1.9%(+0.405)#6,315 |
| 19. | 98155 | 2.3% | 2.1%(+0.197)#176 | 1.9%(+0.403)#6,331 |
| 20. | 98133 | 2.3% | 2.1%(+0.188)#178 | 1.9%(+0.394)#6,370 |
| 21. | 98101 | 2.3% | 2.1%(+0.178)#180 | 1.9%(+0.383)#6,429 |
| 22. | 98115 | 2.2% | 2.1%(+0.150)#184 | 1.9%(+0.355)#6,585 |
| 23. | 98107 | 2.2% | 2.1%(+0.098)#188 | 1.9%(+0.303)#6,832 |
| 24. | 98109 | 2.2% | 2.1%(+0.071)#193 | 1.9%(+0.277)#6,970 |
| 25. | 98118 | 2.0% | 2.1%(-0.077)#216 | 1.9%(+0.128)#7,743 |
| 26. | 98198 | 2.0% | 2.1%(-0.078)#217 | 1.9%(+0.127)#7,745 |
| 27. | 98144 | 1.8% | 2.1%(-0.248)#250 | 1.9%(-0.042)#8,794 |
| 28. | 98117 | 1.8% | 2.1%(-0.275)#254 | 1.9%(-0.070)#8,977 |
| 29. | 98108 | 1.7% | 2.1%(-0.357)#264 | 1.9%(-0.152)#9,498 |
| 30. | 98105 | 1.7% | 2.1%(-0.389)#271 | 1.9%(-0.184)#9,703 |
| 31. | 98168 | 1.5% | 2.1%(-0.598)#296 | 1.9%(-0.393)#11,166 |
| 32. | 98148 | 1.1% | 2.1%(-1.03)#355 | 1.9%(-0.826)#14,572 |
| 33. | 98134 | 0.99% | 2.1%(-1.10)#366 | 1.9%(-0.898)#15,218 |
1
Common Questions
What are the Top 10 Zip Codes with the Highest Percentage of Population Employed in Real Estate, Rental & Leasing in Seattle, WA?
Top 10 Zip Codes with the Highest Percentage of Population Employed in Real Estate, Rental & Leasing in Seattle, WA are:
What zip code has the Highest Percentage of Population Employed in Real Estate, Rental & Leasing in Seattle, WA?
98112 has the Highest Percentage of Population Employed in Real Estate, Rental & Leasing in Seattle, WA with 3.7%.
What is the Percentage of Population Employed in Real Estate, Rental & Leasing in Seattle, WA?
Percentage of Population Employed in Real Estate, Rental & Leasing in Seattle is 2.4%.
What is the Percentage of Population Employed in Real Estate, Rental & Leasing in Washington?
Percentage of Population Employed in Real Estate, Rental & Leasing in Washington is 2.1%.
What is the Percentage of Population Employed in Real Estate, Rental & Leasing in the United States?
Percentage of Population Employed in Real Estate, Rental & Leasing in the United States is 1.9%.