Friday Harbor, WA Map & Demographics
Friday Harbor Map
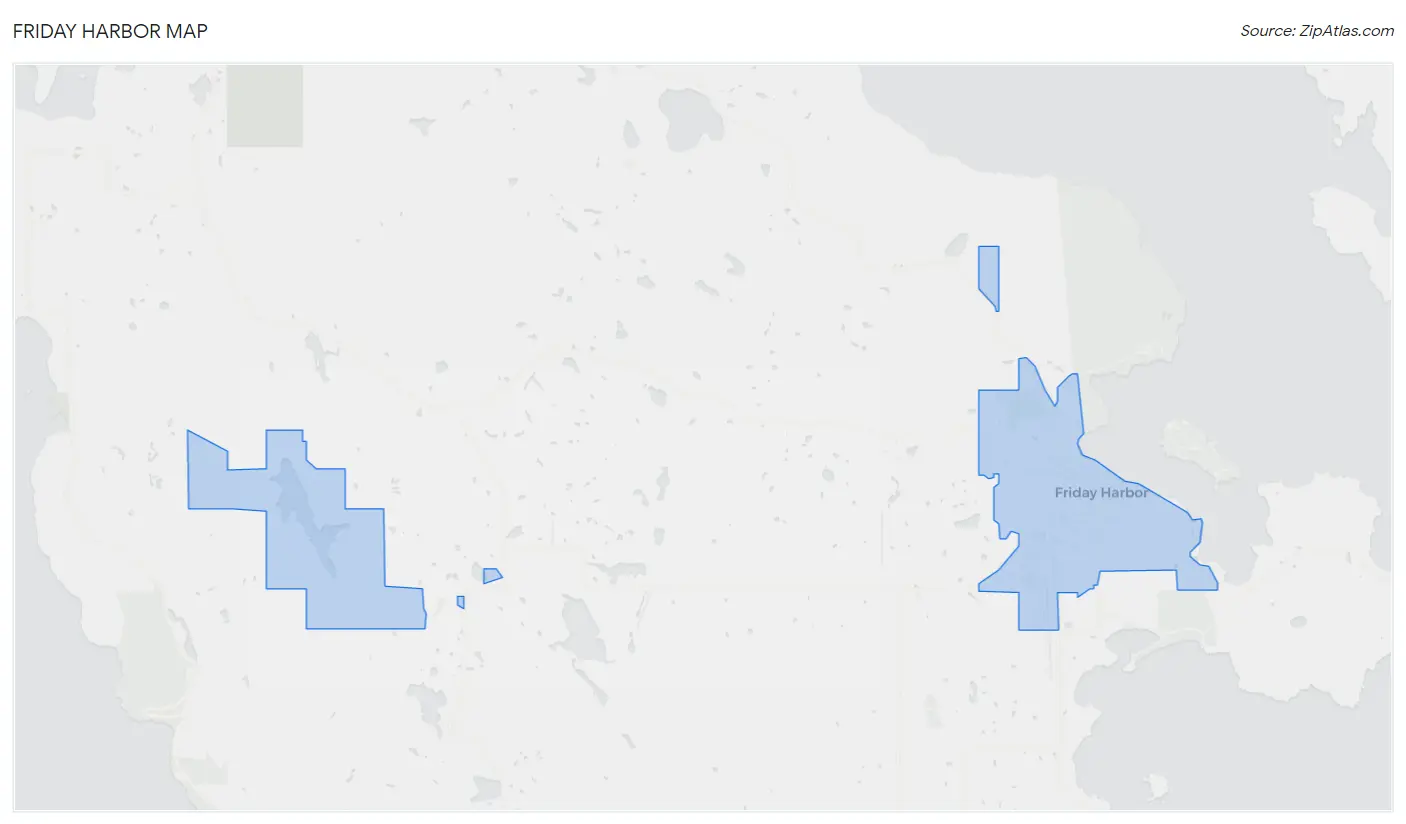
Friday Harbor Overview
$40,906
PER CAPITA INCOME
$88,125
AVG FAMILY INCOME
$62,300
AVG HOUSEHOLD INCOME
41.8%
WAGE / INCOME GAP [ % ]
58.2¢/ $1
WAGE / INCOME GAP [ $ ]
$14,730
FAMILY INCOME DEFICIT
0.50
INEQUALITY / GINI INDEX
2,647
TOTAL POPULATION
1,104
MALE POPULATION
1,543
FEMALE POPULATION
71.55
MALES / 100 FEMALES
139.76
FEMALES / 100 MALES
40.9
MEDIAN AGE
2.9
AVG FAMILY SIZE
2.2
AVG HOUSEHOLD SIZE
1,473
LABOR FORCE [ PEOPLE ]
68.2%
PERCENT IN LABOR FORCE
2.7%
UNEMPLOYMENT RATE
Friday Harbor Zip Codes
Friday Harbor Area Codes
Income in Friday Harbor
Income Overview in Friday Harbor
Per Capita Income in Friday Harbor is $40,906, while median incomes of families and households are $88,125 and $62,300 respectively.
| Characteristic | Number | Measure |
| Per Capita Income | 2,647 | $40,906 |
| Median Family Income | 597 | $88,125 |
| Mean Family Income | 597 | $120,912 |
| Median Household Income | 1,178 | $62,300 |
| Mean Household Income | 1,178 | $92,681 |
| Income Deficit | 597 | $14,730 |
| Wage / Income Gap (%) | 2,647 | 41.79% |
| Wage / Income Gap ($) | 2,647 | 58.21¢ per $1 |
| Gini / Inequality Index | 2,647 | 0.50 |
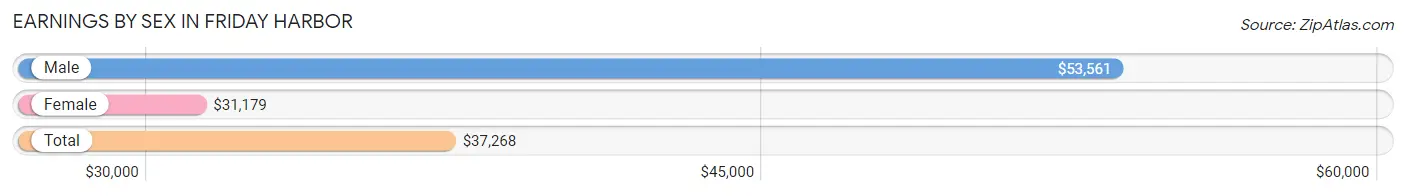
Earnings by Sex in Friday Harbor
Average Earnings in Friday Harbor are $37,268, $53,561 for men and $31,179 for women, a difference of 41.8%.
| Sex | Number | Average Earnings |
| Male | 700 (44.6%) | $53,561 |
| Female | 869 (55.4%) | $31,179 |
| Total | 1,569 (100.0%) | $37,268 |
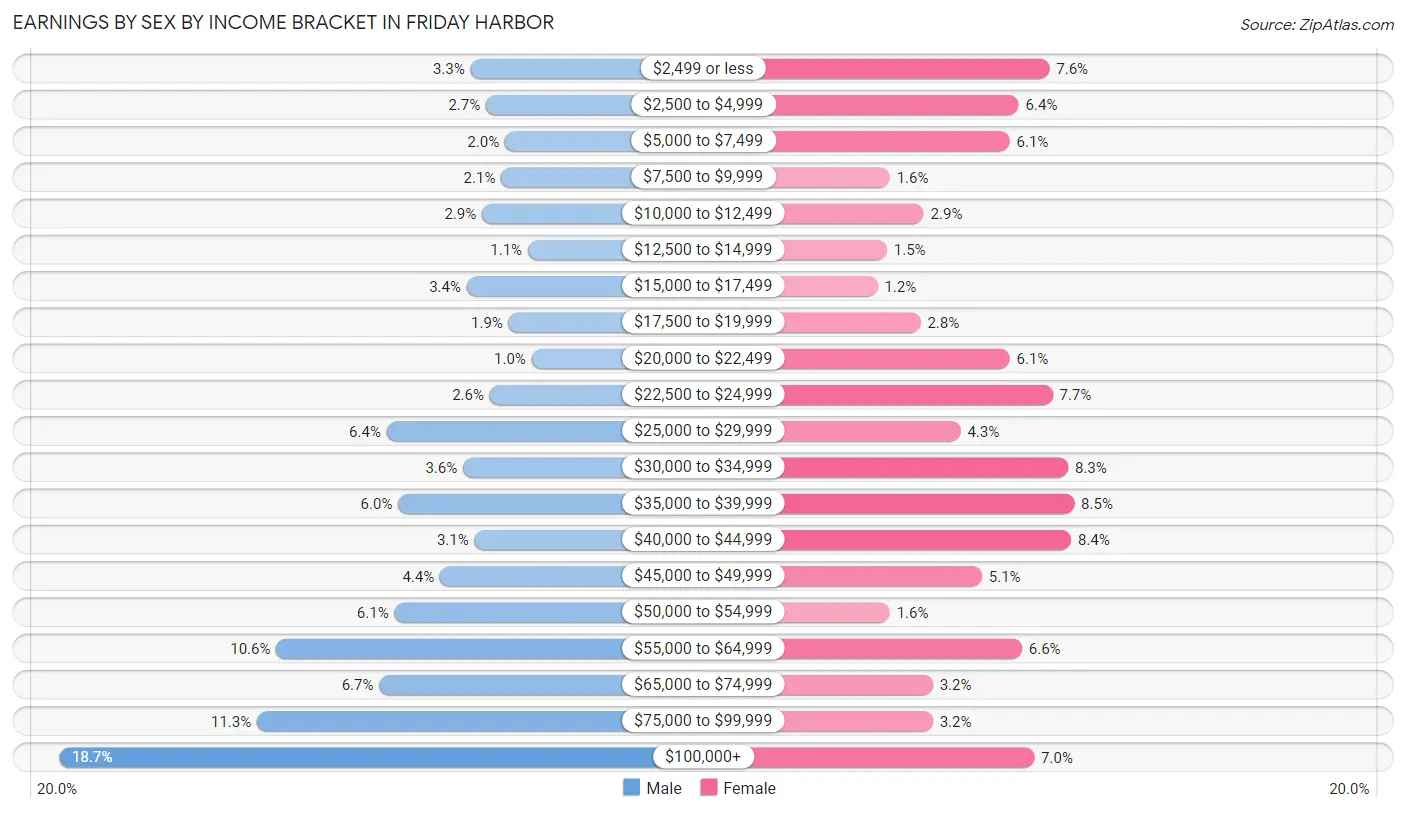
Earnings by Sex by Income Bracket in Friday Harbor
The most common earnings brackets in Friday Harbor are $100,000+ for men (131 | 18.7%) and $35,000 to $39,999 for women (74 | 8.5%).
| Income | Male | Female |
| $2,499 or less | 23 (3.3%) | 66 (7.6%) |
| $2,500 to $4,999 | 19 (2.7%) | 56 (6.4%) |
| $5,000 to $7,499 | 14 (2.0%) | 53 (6.1%) |
| $7,500 to $9,999 | 15 (2.1%) | 14 (1.6%) |
| $10,000 to $12,499 | 20 (2.9%) | 25 (2.9%) |
| $12,500 to $14,999 | 8 (1.1%) | 13 (1.5%) |
| $15,000 to $17,499 | 24 (3.4%) | 10 (1.1%) |
| $17,500 to $19,999 | 13 (1.9%) | 24 (2.8%) |
| $20,000 to $22,499 | 7 (1.0%) | 53 (6.1%) |
| $22,500 to $24,999 | 18 (2.6%) | 67 (7.7%) |
| $25,000 to $29,999 | 45 (6.4%) | 37 (4.3%) |
| $30,000 to $34,999 | 25 (3.6%) | 72 (8.3%) |
| $35,000 to $39,999 | 42 (6.0%) | 74 (8.5%) |
| $40,000 to $44,999 | 22 (3.1%) | 73 (8.4%) |
| $45,000 to $49,999 | 31 (4.4%) | 44 (5.1%) |
| $50,000 to $54,999 | 43 (6.1%) | 14 (1.6%) |
| $55,000 to $64,999 | 74 (10.6%) | 57 (6.6%) |
| $65,000 to $74,999 | 47 (6.7%) | 28 (3.2%) |
| $75,000 to $99,999 | 79 (11.3%) | 28 (3.2%) |
| $100,000+ | 131 (18.7%) | 61 (7.0%) |
| Total | 700 (100.0%) | 869 (100.0%) |
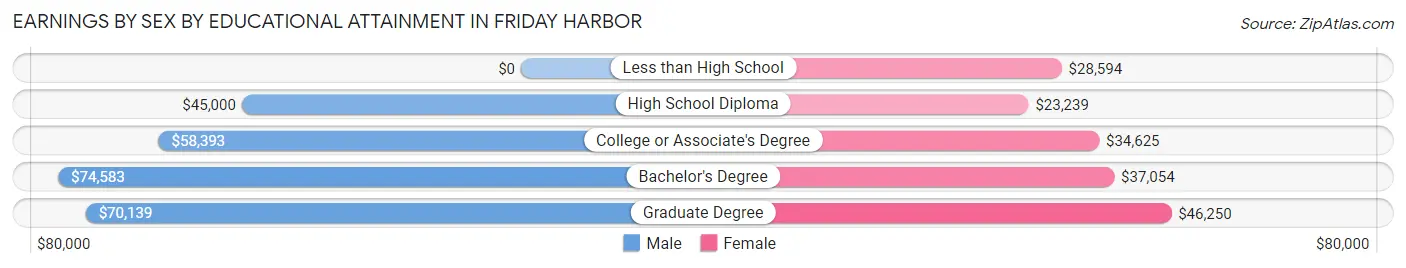
Earnings by Sex by Educational Attainment in Friday Harbor
Average earnings in Friday Harbor are $59,479 for men and $35,750 for women, a difference of 39.9%. Men with an educational attainment of bachelor's degree enjoy the highest average annual earnings of $74,583, while those with high school diploma education earn the least with $45,000. Women with an educational attainment of graduate degree earn the most with the average annual earnings of $46,250, while those with high school diploma education have the smallest earnings of $23,239.
| Educational Attainment | Male Income | Female Income |
| Less than High School | - | - |
| High School Diploma | $45,000 | $23,239 |
| College or Associate's Degree | $58,393 | $34,625 |
| Bachelor's Degree | $74,583 | $37,054 |
| Graduate Degree | $70,139 | $46,250 |
| Total | $59,479 | $35,750 |
Family Income in Friday Harbor
Family Income Brackets in Friday Harbor
According to the Friday Harbor family income data, there are 136 families falling into the $100,000 to $149,999 income range, which is the most common income bracket and makes up 22.8% of all families.
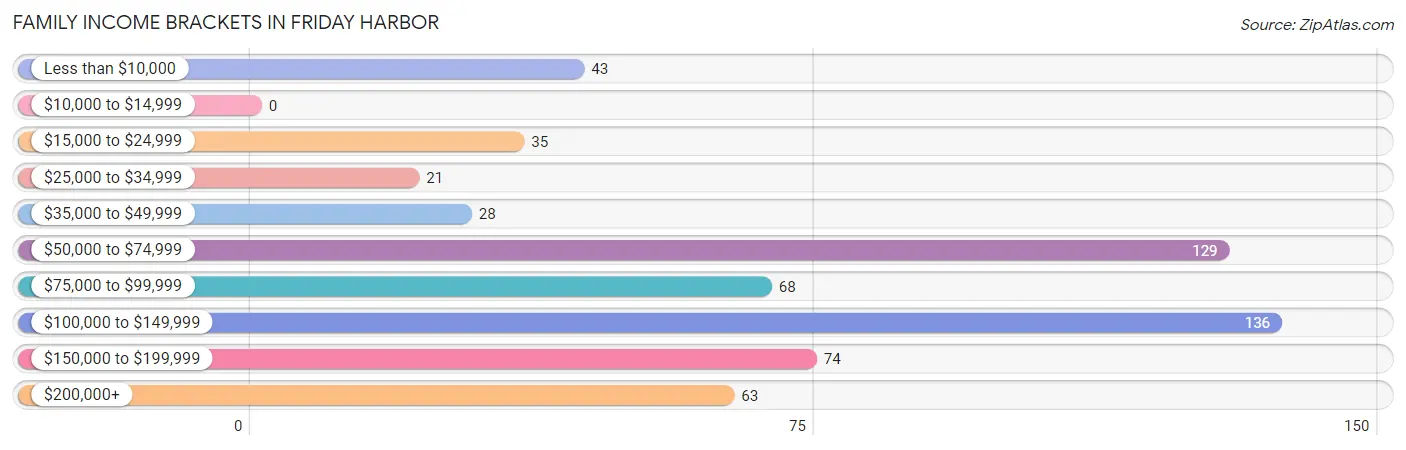
| Income Bracket | # Families | % Families |
| Less than $10,000 | 43 | 7.2% |
| $10,000 to $14,999 | 0 | 0.0% |
| $15,000 to $24,999 | 35 | 5.9% |
| $25,000 to $34,999 | 21 | 3.5% |
| $35,000 to $49,999 | 28 | 4.7% |
| $50,000 to $74,999 | 129 | 21.6% |
| $75,000 to $99,999 | 68 | 11.4% |
| $100,000 to $149,999 | 136 | 22.8% |
| $150,000 to $199,999 | 74 | 12.4% |
| $200,000+ | 63 | 10.6% |
Family Income by Famaliy Size in Friday Harbor
4-person families (91 | 15.2%) account for the highest median family income in Friday Harbor with $109,750 per family, while 2-person families (268 | 44.9%) have the highest median income of $46,458 per family member.
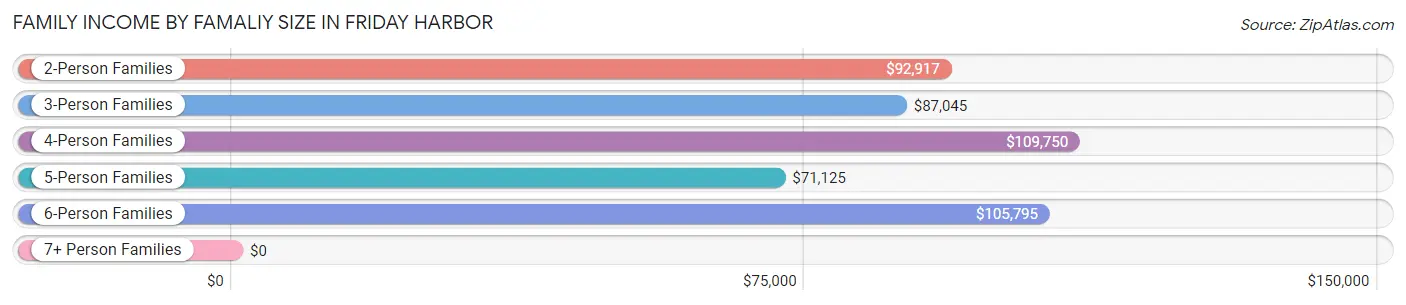
| Income Bracket | # Families | Median Income |
| 2-Person Families | 268 (44.9%) | $92,917 |
| 3-Person Families | 132 (22.1%) | $87,045 |
| 4-Person Families | 91 (15.2%) | $109,750 |
| 5-Person Families | 61 (10.2%) | $71,125 |
| 6-Person Families | 21 (3.5%) | $105,795 |
| 7+ Person Families | 24 (4.0%) | $0 |
| Total | 597 (100.0%) | $88,125 |
Family Income by Number of Earners in Friday Harbor
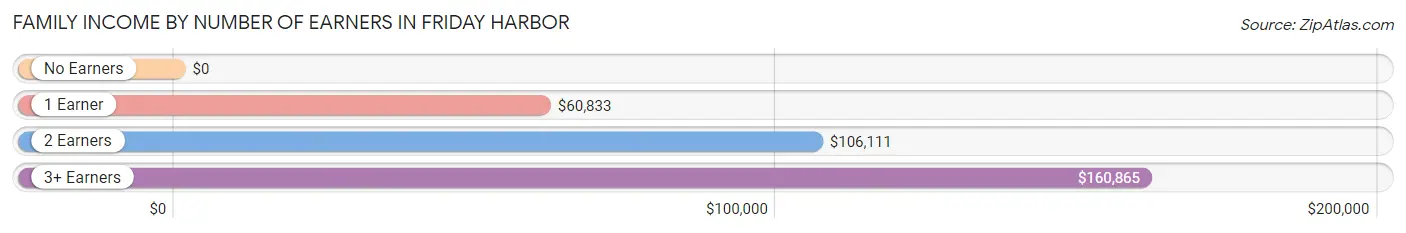
| Number of Earners | # Families | Median Income |
| No Earners | 72 (12.1%) | $0 |
| 1 Earner | 140 (23.4%) | $60,833 |
| 2 Earners | 322 (53.9%) | $106,111 |
| 3+ Earners | 63 (10.5%) | $160,865 |
| Total | 597 (100.0%) | $88,125 |
Household Income in Friday Harbor
Household Income Brackets in Friday Harbor
With 223 households falling in the category, the $50,000 to $74,999 income range is the most frequent in Friday Harbor, accounting for 18.9% of all households. In contrast, only 46 households (3.9%) fall into the $10,000 to $14,999 income bracket, making it the least populous group.
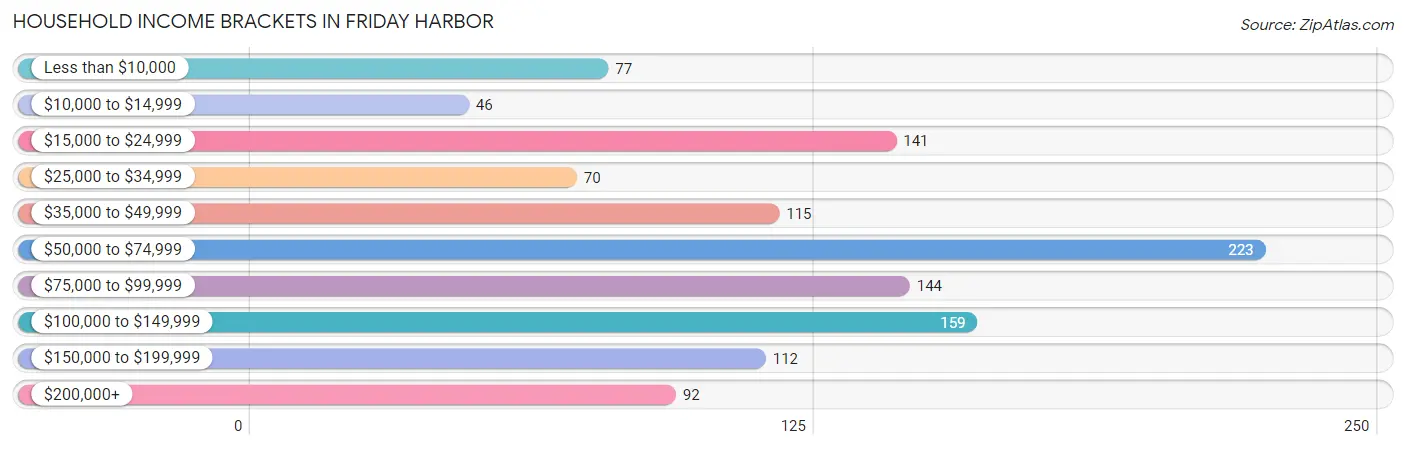
| Income Bracket | # Households | % Households |
| Less than $10,000 | 77 | 6.5% |
| $10,000 to $14,999 | 46 | 3.9% |
| $15,000 to $24,999 | 141 | 12.0% |
| $25,000 to $34,999 | 70 | 5.9% |
| $35,000 to $49,999 | 115 | 9.8% |
| $50,000 to $74,999 | 223 | 18.9% |
| $75,000 to $99,999 | 144 | 12.2% |
| $100,000 to $149,999 | 159 | 13.5% |
| $150,000 to $199,999 | 112 | 9.5% |
| $200,000+ | 92 | 7.8% |
Household Income by Householder Age in Friday Harbor
The median household income in Friday Harbor is $62,300, with the highest median household income of $77,500 found in the 45 to 64 years age bracket for the primary householder. A total of 444 households (37.7%) fall into this category. Meanwhile, the 65+ years age bracket for the primary householder has the lowest median household income of $34,375, with 331 households (28.1%) in this group.
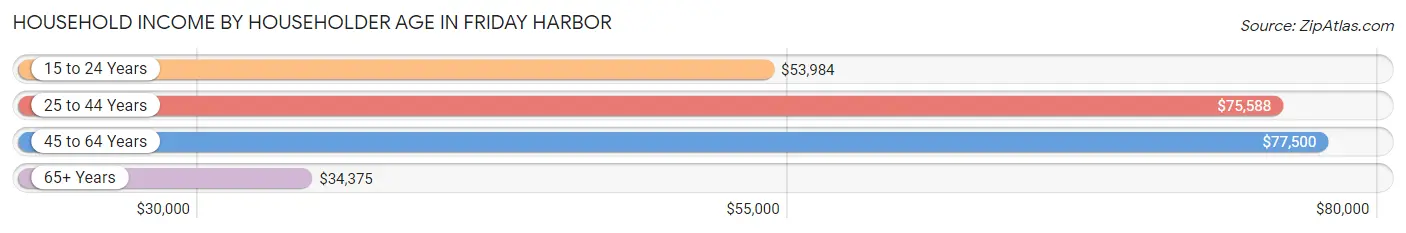
| Income Bracket | # Households | Median Income |
| 15 to 24 Years | 33 (2.8%) | $53,984 |
| 25 to 44 Years | 370 (31.4%) | $75,588 |
| 45 to 64 Years | 444 (37.7%) | $77,500 |
| 65+ Years | 331 (28.1%) | $34,375 |
| Total | 1,178 (100.0%) | $62,300 |
Poverty in Friday Harbor
Income Below Poverty by Sex and Age in Friday Harbor
With 10.2% poverty level for males and 14.8% for females among the residents of Friday Harbor, 12 to 14 year old males and 5 year old females are the most vulnerable to poverty, with 15 males (39.5%) and 7 females (50.0%) in their respective age groups living below the poverty level.
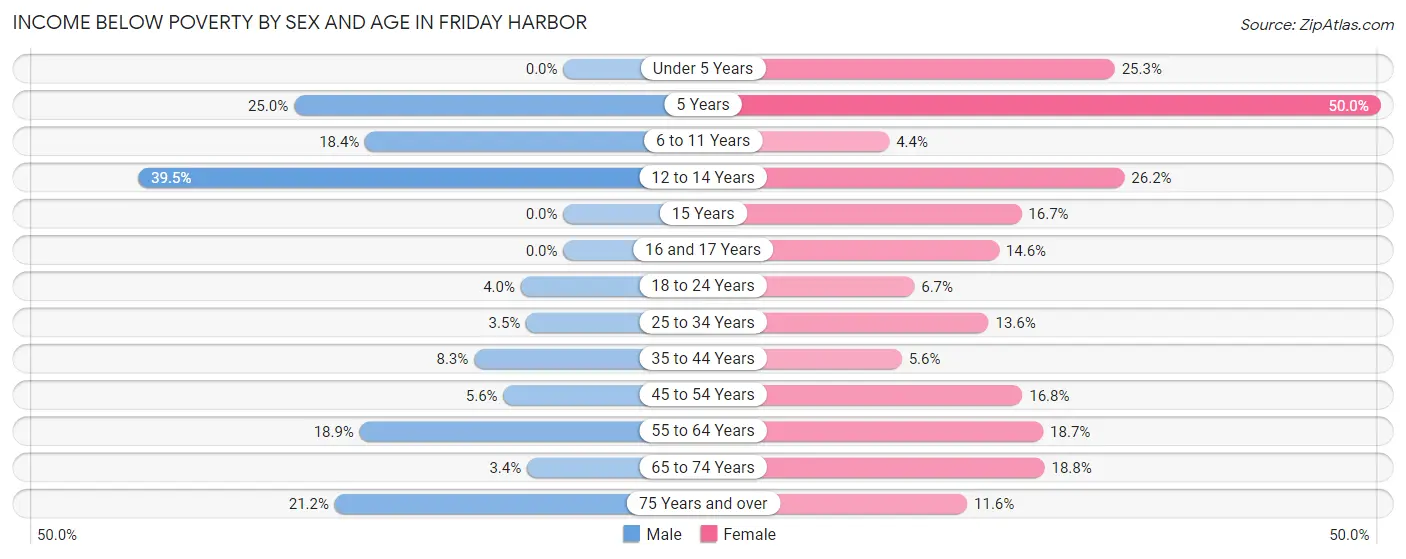
| Age Bracket | Male | Female |
| Under 5 Years | 0 (0.0%) | 19 (25.3%) |
| 5 Years | 5 (25.0%) | 7 (50.0%) |
| 6 to 11 Years | 16 (18.4%) | 4 (4.4%) |
| 12 to 14 Years | 15 (39.5%) | 16 (26.2%) |
| 15 Years | 0 (0.0%) | 2 (16.7%) |
| 16 and 17 Years | 0 (0.0%) | 7 (14.6%) |
| 18 to 24 Years | 3 (4.0%) | 7 (6.7%) |
| 25 to 34 Years | 5 (3.5%) | 32 (13.6%) |
| 35 to 44 Years | 13 (8.3%) | 9 (5.6%) |
| 45 to 54 Years | 10 (5.6%) | 34 (16.8%) |
| 55 to 64 Years | 24 (18.9%) | 37 (18.7%) |
| 65 to 74 Years | 3 (3.4%) | 35 (18.8%) |
| 75 Years and over | 14 (21.2%) | 10 (11.6%) |
| Total | 108 (10.2%) | 219 (14.8%) |
Income Above Poverty by Sex and Age in Friday Harbor
According to the poverty statistics in Friday Harbor, males aged under 5 years and females aged 6 to 11 years are the age groups that are most secure financially, with 100.0% of males and 95.6% of females in these age groups living above the poverty line.
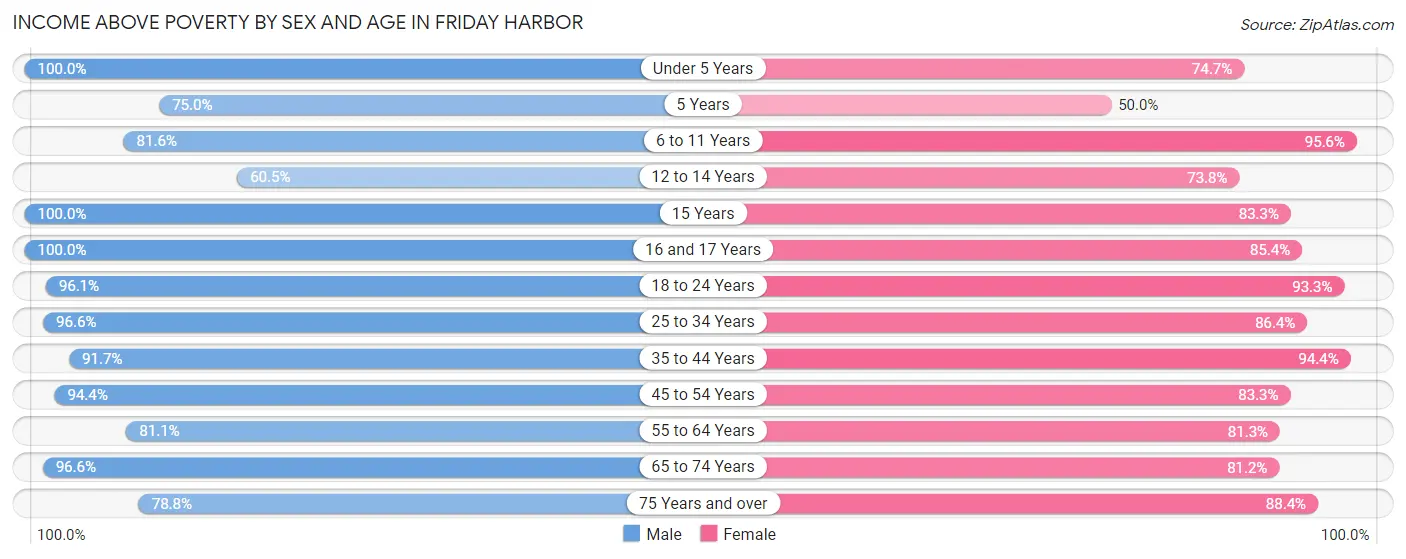
| Age Bracket | Male | Female |
| Under 5 Years | 30 (100.0%) | 56 (74.7%) |
| 5 Years | 15 (75.0%) | 7 (50.0%) |
| 6 to 11 Years | 71 (81.6%) | 87 (95.6%) |
| 12 to 14 Years | 23 (60.5%) | 45 (73.8%) |
| 15 Years | 33 (100.0%) | 10 (83.3%) |
| 16 and 17 Years | 13 (100.0%) | 41 (85.4%) |
| 18 to 24 Years | 73 (96.1%) | 97 (93.3%) |
| 25 to 34 Years | 140 (96.6%) | 203 (86.4%) |
| 35 to 44 Years | 144 (91.7%) | 153 (94.4%) |
| 45 to 54 Years | 170 (94.4%) | 169 (83.3%) |
| 55 to 64 Years | 103 (81.1%) | 161 (81.3%) |
| 65 to 74 Years | 86 (96.6%) | 151 (81.2%) |
| 75 Years and over | 52 (78.8%) | 76 (88.4%) |
| Total | 953 (89.8%) | 1,256 (85.2%) |
Income Below Poverty Among Married-Couple Families in Friday Harbor
The poverty statistics for married-couple families in Friday Harbor show that 5.2% or 23 of the total 443 families live below the poverty line. Families with no children have the highest poverty rate of 9.5%, comprising of 23 families. On the other hand, families with 1 or 2 children have the lowest poverty rate of 0.0%, which includes 0 families.
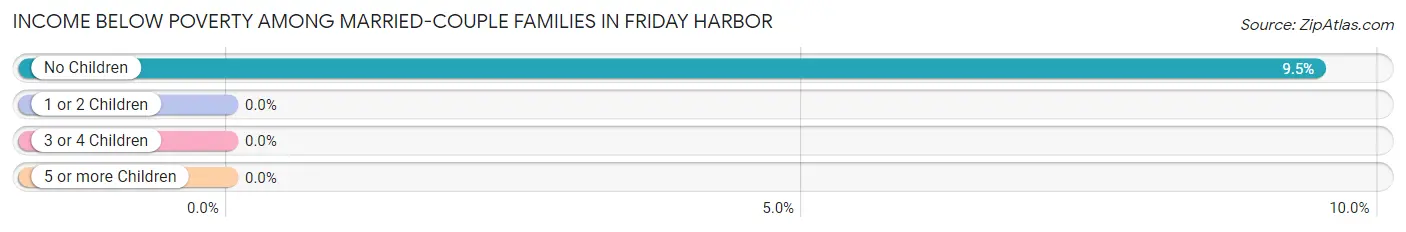
| Children | Above Poverty | Below Poverty |
| No Children | 220 (90.5%) | 23 (9.5%) |
| 1 or 2 Children | 148 (100.0%) | 0 (0.0%) |
| 3 or 4 Children | 28 (100.0%) | 0 (0.0%) |
| 5 or more Children | 24 (100.0%) | 0 (0.0%) |
| Total | 420 (94.8%) | 23 (5.2%) |
Income Below Poverty Among Single-Parent Households in Friday Harbor
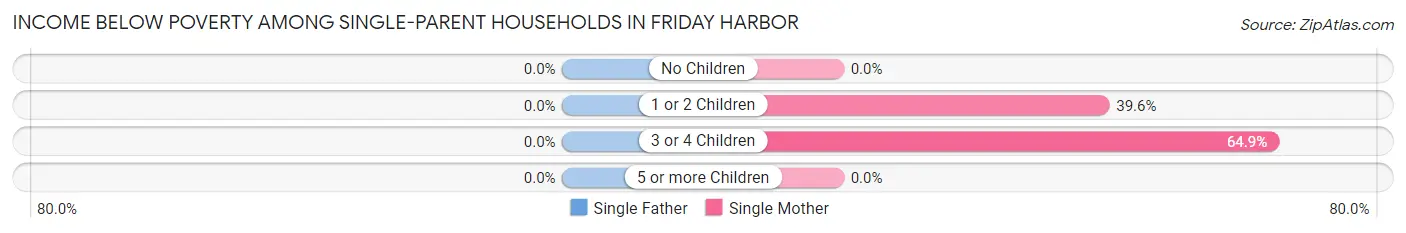
| Children | Single Father | Single Mother |
| No Children | 0 (0.0%) | 0 (0.0%) |
| 1 or 2 Children | 0 (0.0%) | 19 (39.6%) |
| 3 or 4 Children | 0 (0.0%) | 24 (64.9%) |
| 5 or more Children | 0 (0.0%) | 0 (0.0%) |
| Total | 0 (0.0%) | 43 (35.5%) |
Income Below Poverty Among Married-Couple vs Single-Parent Households in Friday Harbor
The poverty data for Friday Harbor shows that 23 of the married-couple family households (5.2%) and 43 of the single-parent households (27.9%) are living below the poverty level. Within the married-couple family households, those with no children have the highest poverty rate, with 23 households (9.5%) falling below the poverty line. Among the single-parent households, those with 3 or 4 children have the highest poverty rate, with 24 household (61.5%) living below poverty.
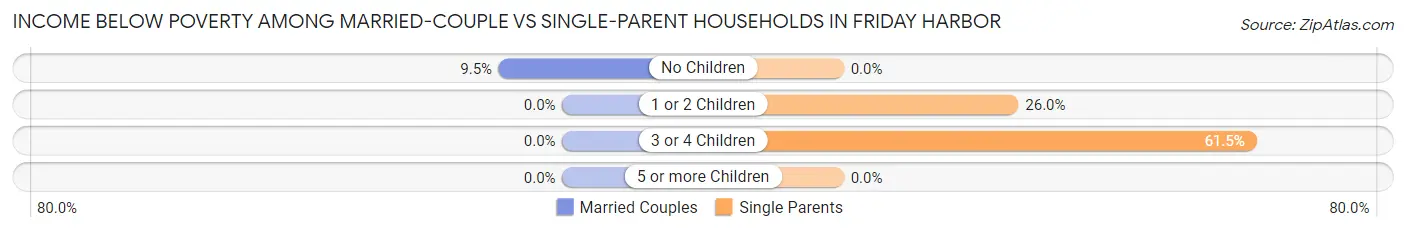
| Children | Married-Couple Families | Single-Parent Households |
| No Children | 23 (9.5%) | 0 (0.0%) |
| 1 or 2 Children | 0 (0.0%) | 19 (26.0%) |
| 3 or 4 Children | 0 (0.0%) | 24 (61.5%) |
| 5 or more Children | 0 (0.0%) | 0 (0.0%) |
| Total | 23 (5.2%) | 43 (27.9%) |
Race in Friday Harbor
The most populous races in Friday Harbor are White / Caucasian (2,208 | 83.4%), Hispanic or Latino (424 | 16.0%), and Some other Race (200 | 7.6%).
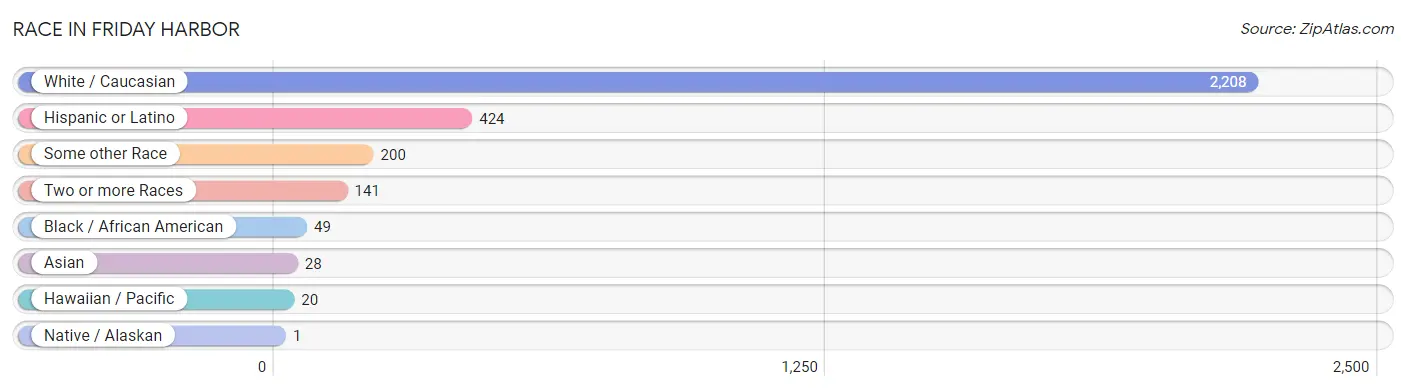
| Race | # Population | % Population |
| Asian | 28 | 1.1% |
| Black / African American | 49 | 1.8% |
| Hawaiian / Pacific | 20 | 0.8% |
| Hispanic or Latino | 424 | 16.0% |
| Native / Alaskan | 1 | 0.0% |
| White / Caucasian | 2,208 | 83.4% |
| Two or more Races | 141 | 5.3% |
| Some other Race | 200 | 7.6% |
| Total | 2,647 | 100.0% |
Ancestry in Friday Harbor
The most populous ancestries reported in Friday Harbor are German (348 | 13.2%), Mexican (335 | 12.7%), English (310 | 11.7%), Irish (238 | 9.0%), and Norwegian (136 | 5.1%), together accounting for 51.6% of all Friday Harbor residents.
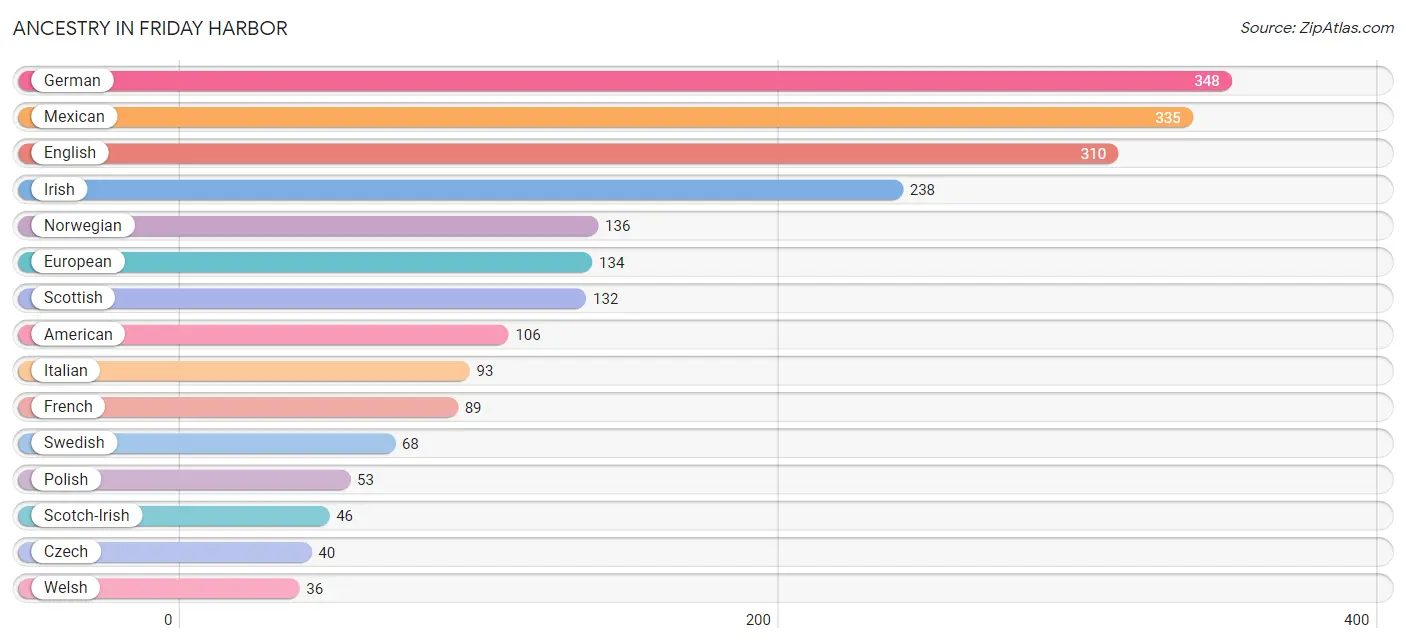
| Ancestry | # Population | % Population |
| American | 106 | 4.0% |
| Australian | 19 | 0.7% |
| Austrian | 2 | 0.1% |
| Basque | 3 | 0.1% |
| Belgian | 3 | 0.1% |
| Bhutanese | 13 | 0.5% |
| British | 27 | 1.0% |
| Burmese | 5 | 0.2% |
| Canadian | 15 | 0.6% |
| Celtic | 3 | 0.1% |
| Central American | 1 | 0.0% |
| Cherokee | 21 | 0.8% |
| Croatian | 7 | 0.3% |
| Czech | 40 | 1.5% |
| Czechoslovakian | 3 | 0.1% |
| Danish | 24 | 0.9% |
| Dutch | 14 | 0.5% |
| Eastern European | 4 | 0.2% |
| English | 310 | 11.7% |
| European | 134 | 5.1% |
| Filipino | 5 | 0.2% |
| Finnish | 8 | 0.3% |
| French | 89 | 3.4% |
| French Canadian | 23 | 0.9% |
| German | 348 | 13.2% |
| German Russian | 4 | 0.2% |
| Greek | 5 | 0.2% |
| Hungarian | 10 | 0.4% |
| Icelander | 3 | 0.1% |
| Indian (Asian) | 5 | 0.2% |
| Irish | 238 | 9.0% |
| Italian | 93 | 3.5% |
| Jamaican | 2 | 0.1% |
| Japanese | 3 | 0.1% |
| Kenyan | 2 | 0.1% |
| Korean | 6 | 0.2% |
| Laotian | 8 | 0.3% |
| Lithuanian | 19 | 0.7% |
| Mexican | 335 | 12.7% |
| Native Hawaiian | 7 | 0.3% |
| New Zealander | 1 | 0.0% |
| Northern European | 17 | 0.6% |
| Norwegian | 136 | 5.1% |
| Pakistani | 6 | 0.2% |
| Pennsylvania German | 3 | 0.1% |
| Polish | 53 | 2.0% |
| Portuguese | 18 | 0.7% |
| Puerto Rican | 3 | 0.1% |
| Russian | 9 | 0.3% |
| Salvadoran | 1 | 0.0% |
| Samoan | 13 | 0.5% |
| Scandinavian | 28 | 1.1% |
| Scotch-Irish | 46 | 1.7% |
| Scottish | 132 | 5.0% |
| Serbian | 15 | 0.6% |
| Spaniard | 8 | 0.3% |
| Spanish | 3 | 0.1% |
| Subsaharan African | 2 | 0.1% |
| Swedish | 68 | 2.6% |
| Swiss | 23 | 0.9% |
| Ukrainian | 1 | 0.0% |
| Welsh | 36 | 1.4% |
| Yugoslavian | 5 | 0.2% | View All 63 Rows |
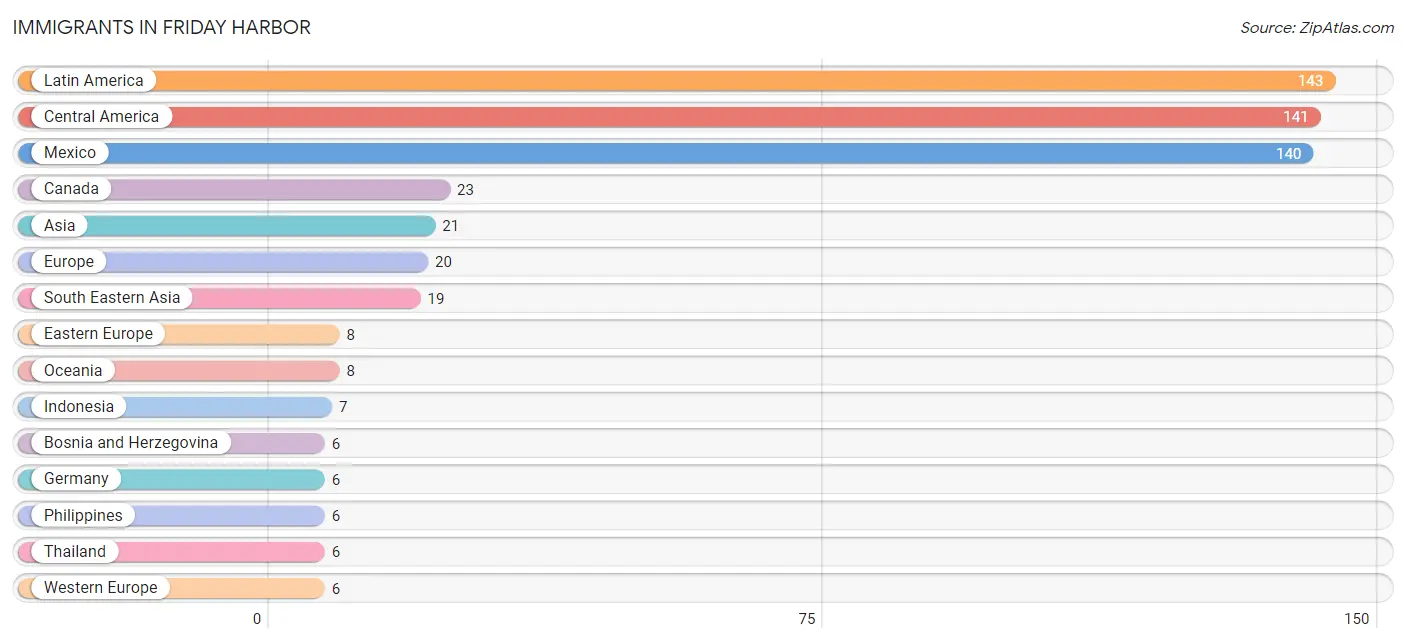
Immigrants in Friday Harbor
The most numerous immigrant groups reported in Friday Harbor came from Latin America (143 | 5.4%), Central America (141 | 5.3%), Mexico (140 | 5.3%), Canada (23 | 0.9%), and Asia (21 | 0.8%), together accounting for 17.7% of all Friday Harbor residents.
| Immigration Origin | # Population | % Population |
| Asia | 21 | 0.8% |
| Bosnia and Herzegovina | 6 | 0.2% |
| Canada | 23 | 0.9% |
| Caribbean | 2 | 0.1% |
| Central America | 141 | 5.3% |
| China | 2 | 0.1% |
| Eastern Asia | 2 | 0.1% |
| Eastern Europe | 8 | 0.3% |
| El Salvador | 1 | 0.0% |
| England | 1 | 0.0% |
| Europe | 20 | 0.8% |
| Germany | 6 | 0.2% |
| Indonesia | 7 | 0.3% |
| Jamaica | 2 | 0.1% |
| Latin America | 143 | 5.4% |
| Mexico | 140 | 5.3% |
| Northern Europe | 4 | 0.2% |
| Oceania | 8 | 0.3% |
| Philippines | 6 | 0.2% |
| Poland | 2 | 0.1% |
| South Eastern Asia | 19 | 0.7% |
| Southern Europe | 2 | 0.1% |
| Spain | 2 | 0.1% |
| Thailand | 6 | 0.2% |
| Western Europe | 6 | 0.2% | View All 25 Rows |
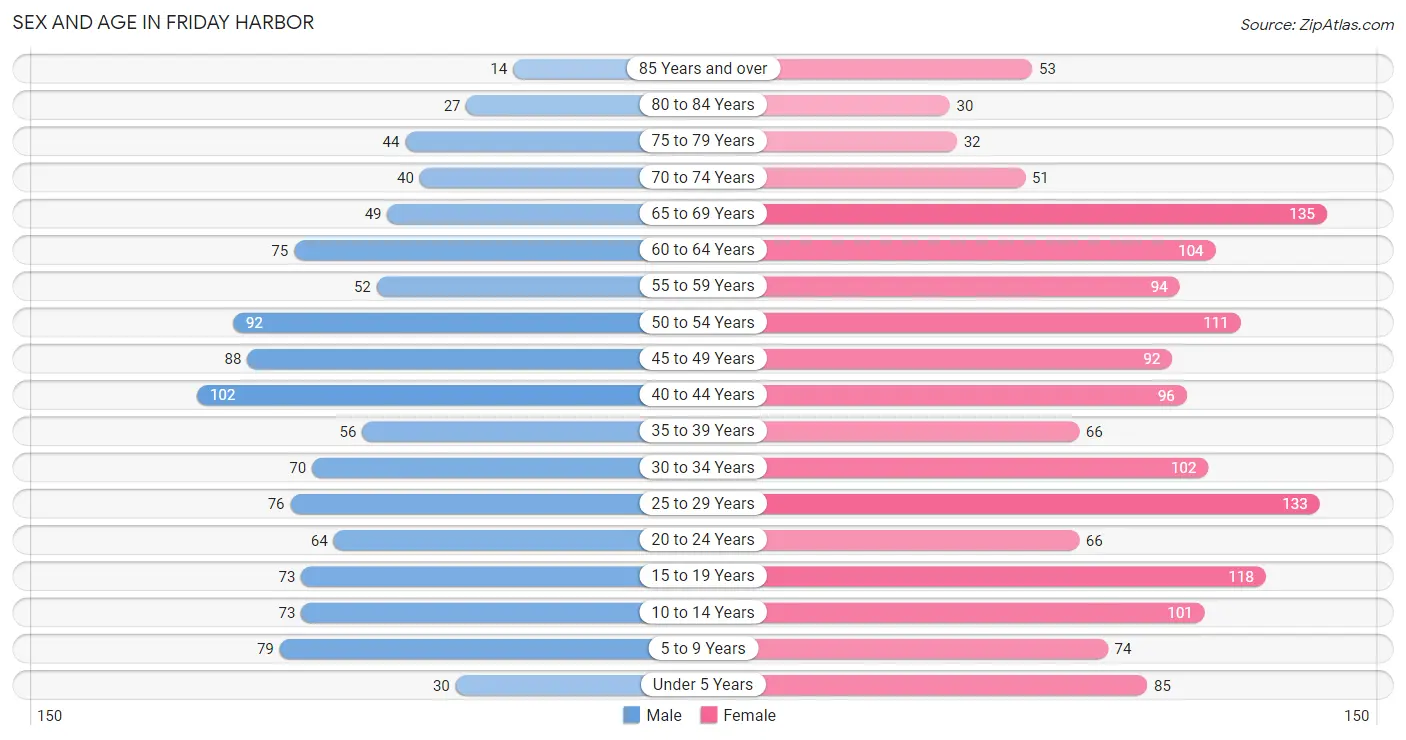
Sex and Age in Friday Harbor
Sex and Age in Friday Harbor
The most populous age groups in Friday Harbor are 40 to 44 Years (102 | 9.2%) for men and 65 to 69 Years (135 | 8.7%) for women.
| Age Bracket | Male | Female |
| Under 5 Years | 30 (2.7%) | 85 (5.5%) |
| 5 to 9 Years | 79 (7.2%) | 74 (4.8%) |
| 10 to 14 Years | 73 (6.6%) | 101 (6.6%) |
| 15 to 19 Years | 73 (6.6%) | 118 (7.6%) |
| 20 to 24 Years | 64 (5.8%) | 66 (4.3%) |
| 25 to 29 Years | 76 (6.9%) | 133 (8.6%) |
| 30 to 34 Years | 70 (6.3%) | 102 (6.6%) |
| 35 to 39 Years | 56 (5.1%) | 66 (4.3%) |
| 40 to 44 Years | 102 (9.2%) | 96 (6.2%) |
| 45 to 49 Years | 88 (8.0%) | 92 (6.0%) |
| 50 to 54 Years | 92 (8.3%) | 111 (7.2%) |
| 55 to 59 Years | 52 (4.7%) | 94 (6.1%) |
| 60 to 64 Years | 75 (6.8%) | 104 (6.7%) |
| 65 to 69 Years | 49 (4.4%) | 135 (8.7%) |
| 70 to 74 Years | 40 (3.6%) | 51 (3.3%) |
| 75 to 79 Years | 44 (4.0%) | 32 (2.1%) |
| 80 to 84 Years | 27 (2.5%) | 30 (1.9%) |
| 85 Years and over | 14 (1.3%) | 53 (3.4%) |
| Total | 1,104 (100.0%) | 1,543 (100.0%) |
Families and Households in Friday Harbor
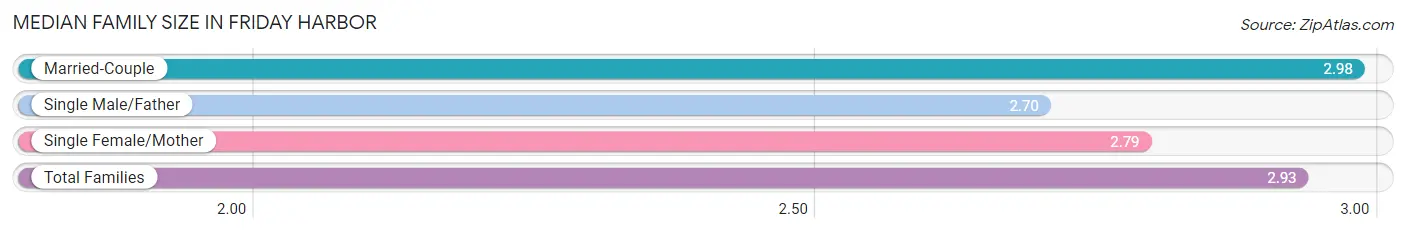
Median Family Size in Friday Harbor
The median family size in Friday Harbor is 2.93 persons per family, with married-couple families (443 | 74.2%) accounting for the largest median family size of 2.98 persons per family. On the other hand, single male/father families (33 | 5.5%) represent the smallest median family size with 2.70 persons per family.
| Family Type | # Families | Family Size |
| Married-Couple | 443 (74.2%) | 2.98 |
| Single Male/Father | 33 (5.5%) | 2.70 |
| Single Female/Mother | 121 (20.3%) | 2.79 |
| Total Families | 597 (100.0%) | 2.93 |
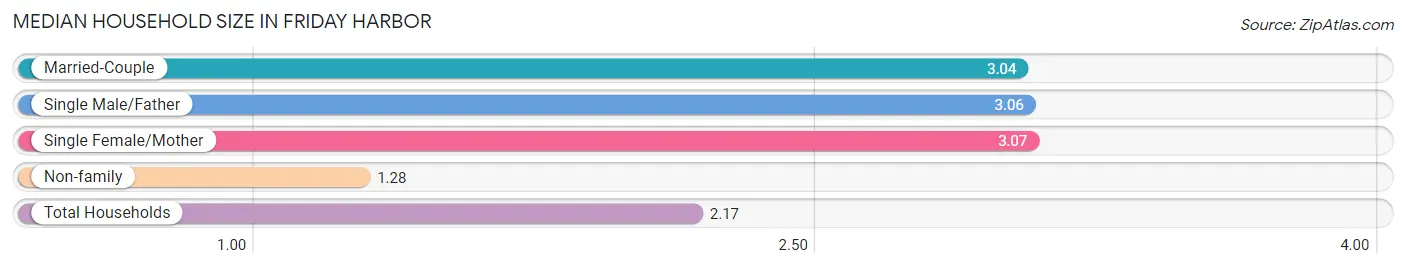
Median Household Size in Friday Harbor
The median household size in Friday Harbor is 2.17 persons per household, with single female/mother households (121 | 10.3%) accounting for the largest median household size of 3.07 persons per household. non-family households (581 | 49.3%) represent the smallest median household size with 1.28 persons per household.
| Household Type | # Households | Household Size |
| Married-Couple | 443 (37.6%) | 3.04 |
| Single Male/Father | 33 (2.8%) | 3.06 |
| Single Female/Mother | 121 (10.3%) | 3.07 |
| Non-family | 581 (49.3%) | 1.28 |
| Total Households | 1,178 (100.0%) | 2.17 |
Household Size by Marriage Status in Friday Harbor
Out of a total of 1,178 households in Friday Harbor, 597 (50.7%) are family households, while 581 (49.3%) are nonfamily households. The most numerous type of family households are 2-person households, comprising 240, and the most common type of nonfamily households are 1-person households, comprising 436.
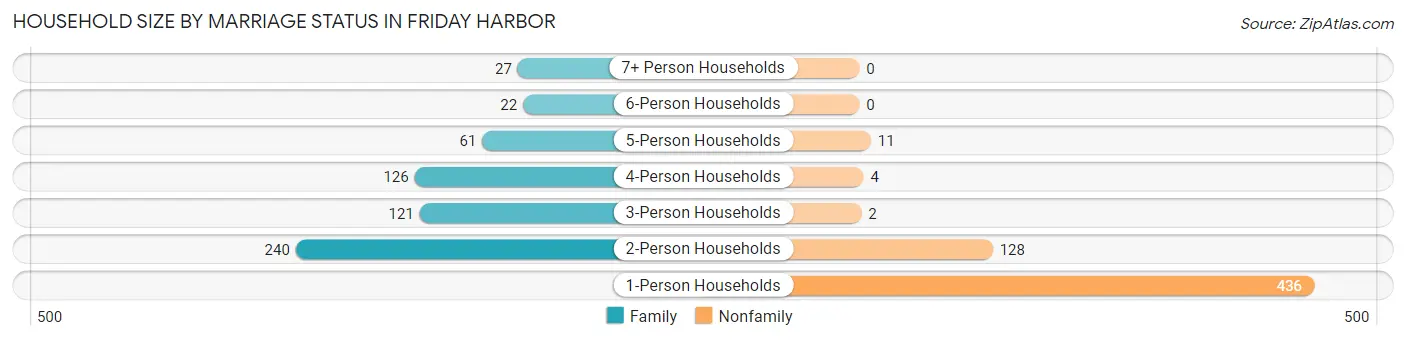
| Household Size | Family Households | Nonfamily Households |
| 1-Person Households | - | 436 (37.0%) |
| 2-Person Households | 240 (20.4%) | 128 (10.9%) |
| 3-Person Households | 121 (10.3%) | 2 (0.2%) |
| 4-Person Households | 126 (10.7%) | 4 (0.3%) |
| 5-Person Households | 61 (5.2%) | 11 (0.9%) |
| 6-Person Households | 22 (1.9%) | 0 (0.0%) |
| 7+ Person Households | 27 (2.3%) | 0 (0.0%) |
| Total | 597 (50.7%) | 581 (49.3%) |
Female Fertility in Friday Harbor
Fertility by Age in Friday Harbor
Average fertility rate in Friday Harbor is 27.0 births per 1,000 women. Women in the age bracket of 20 to 34 years have the highest fertility rate with 56.0 births per 1,000 women. Women in the age bracket of 20 to 34 years acount for 89.5% of all women with births.
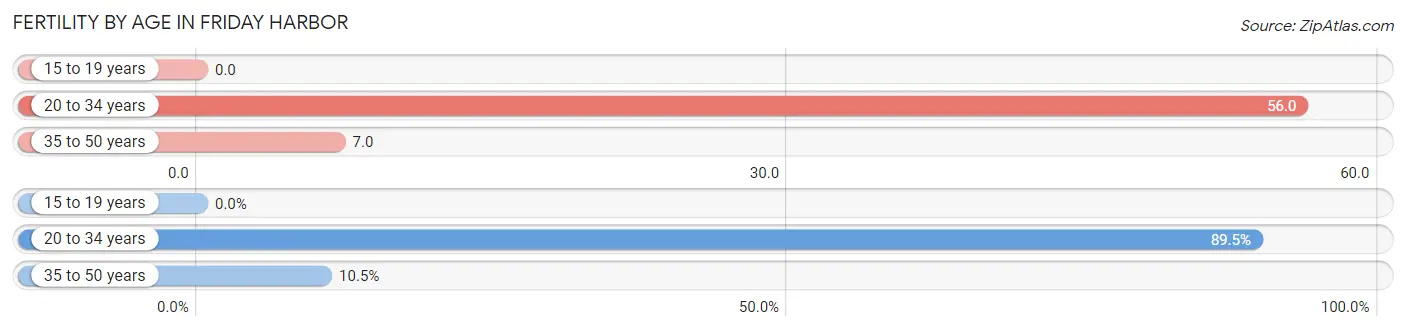
| Age Bracket | Women with Births | Births / 1,000 Women |
| 15 to 19 years | 0 (0.0%) | 0.0 |
| 20 to 34 years | 17 (89.5%) | 56.0 |
| 35 to 50 years | 2 (10.5%) | 7.0 |
| Total | 19 (100.0%) | 27.0 |
Fertility by Age by Marriage Status in Friday Harbor
36.8% of women with births (19) in Friday Harbor are married. The highest percentage of unmarried women with births falls into 20 to 34 years age bracket with 70.6% of them unmarried at the time of birth, while the lowest percentage of unmarried women with births belong to 35 to 50 years age bracket with 0.0% of them unmarried.
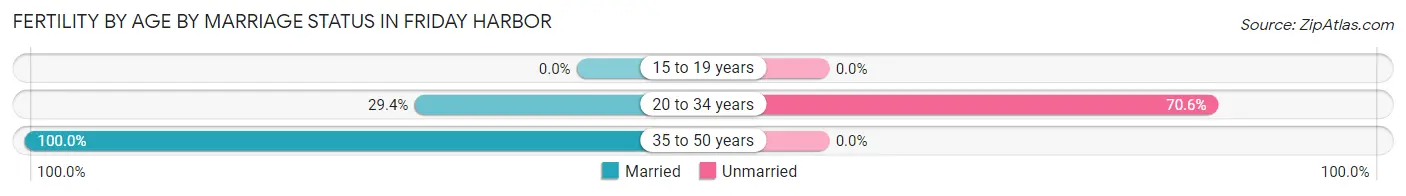
| Age Bracket | Married | Unmarried |
| 15 to 19 years | 0 (0.0%) | 0 (0.0%) |
| 20 to 34 years | 5 (29.4%) | 12 (70.6%) |
| 35 to 50 years | 2 (100.0%) | 0 (0.0%) |
| Total | 7 (36.8%) | 12 (63.2%) |
Fertility by Education in Friday Harbor
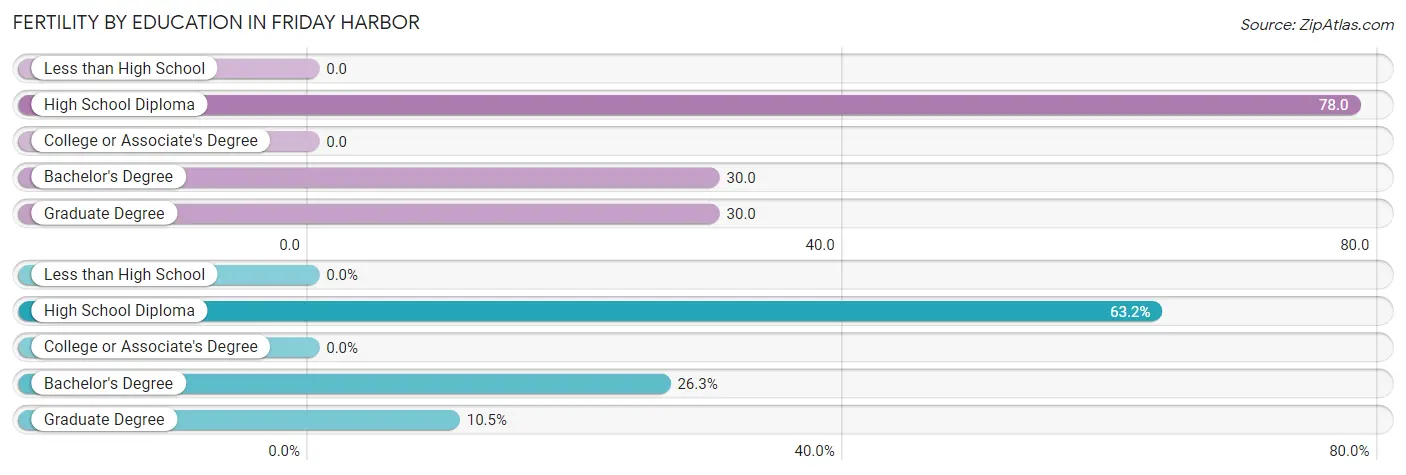
| Educational Attainment | Women with Births | Births / 1,000 Women |
| Less than High School | 0 (0.0%) | 0.0 |
| High School Diploma | 12 (63.2%) | 78.0 |
| College or Associate's Degree | 0 (0.0%) | 0.0 |
| Bachelor's Degree | 5 (26.3%) | 30.0 |
| Graduate Degree | 2 (10.5%) | 30.0 |
| Total | 19 (100.0%) | 27.0 |
Fertility by Education by Marriage Status in Friday Harbor
63.2% of women with births in Friday Harbor are unmarried. Women with the educational attainment of bachelor's degree are most likely to be married with 100.0% of them married at childbirth, while women with the educational attainment of high school diploma are least likely to be married with 100.0% of them unmarried at childbirth.
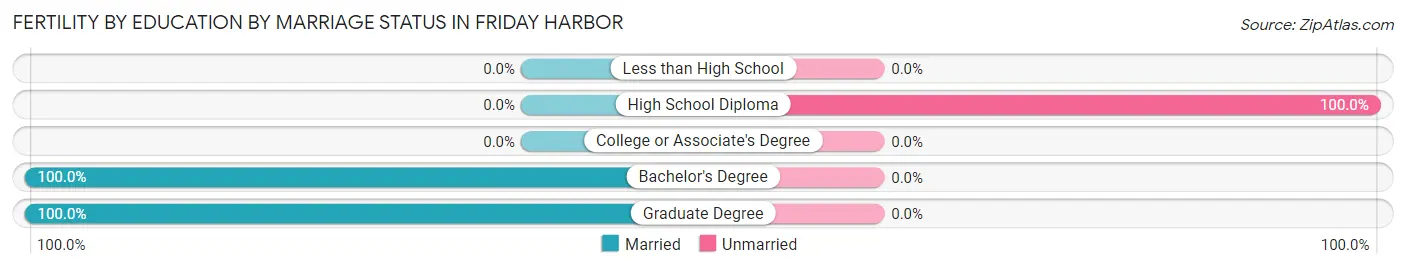
| Educational Attainment | Married | Unmarried |
| Less than High School | 0 (0.0%) | 0 (0.0%) |
| High School Diploma | 0 (0.0%) | 12 (100.0%) |
| College or Associate's Degree | 0 (0.0%) | 0 (0.0%) |
| Bachelor's Degree | 5 (100.0%) | 0 (0.0%) |
| Graduate Degree | 2 (100.0%) | 0 (0.0%) |
| Total | 7 (36.8%) | 12 (63.2%) |
Employment Characteristics in Friday Harbor
Employment by Class of Employer in Friday Harbor
Among the 1,402 employed individuals in Friday Harbor, private company employees (701 | 50.0%), local government employees (223 | 15.9%), and self-employed (not incorporated) (159 | 11.3%) make up the most common classes of employment.
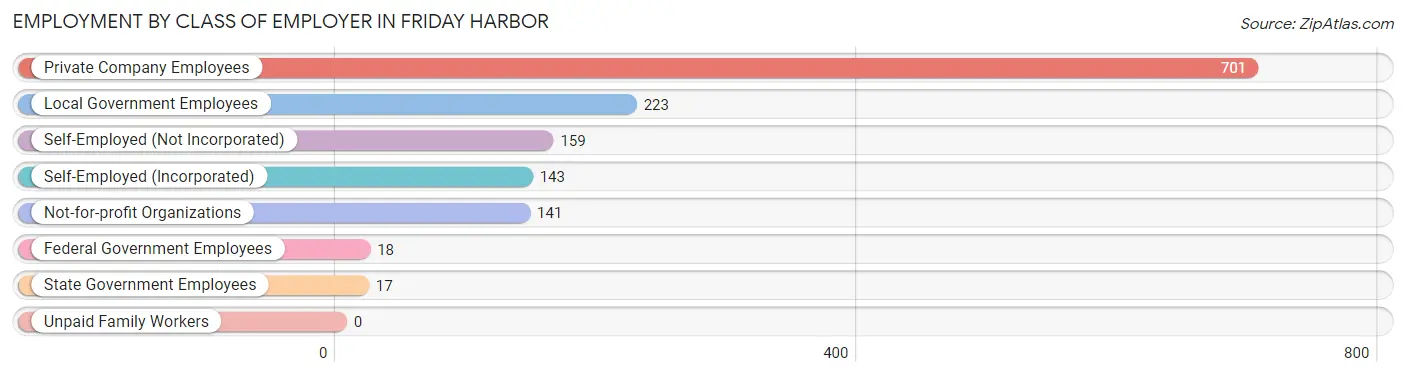
| Employer Class | # Employees | % Employees |
| Private Company Employees | 701 | 50.0% |
| Self-Employed (Incorporated) | 143 | 10.2% |
| Self-Employed (Not Incorporated) | 159 | 11.3% |
| Not-for-profit Organizations | 141 | 10.1% |
| Local Government Employees | 223 | 15.9% |
| State Government Employees | 17 | 1.2% |
| Federal Government Employees | 18 | 1.3% |
| Unpaid Family Workers | 0 | 0.0% |
| Total | 1,402 | 100.0% |
Employment Status by Age in Friday Harbor
According to the labor force statistics for Friday Harbor, out of the total population over 16 years of age (2,160), 68.2% or 1,473 individuals are in the labor force, with 2.7% or 40 of them unemployed. The age group with the highest labor force participation rate is 20 to 24 years, with 91.5% or 119 individuals in the labor force. Within the labor force, the 75 years and over age range has the highest percentage of unemployed individuals, with 12.5% or 3 of them being unemployed.
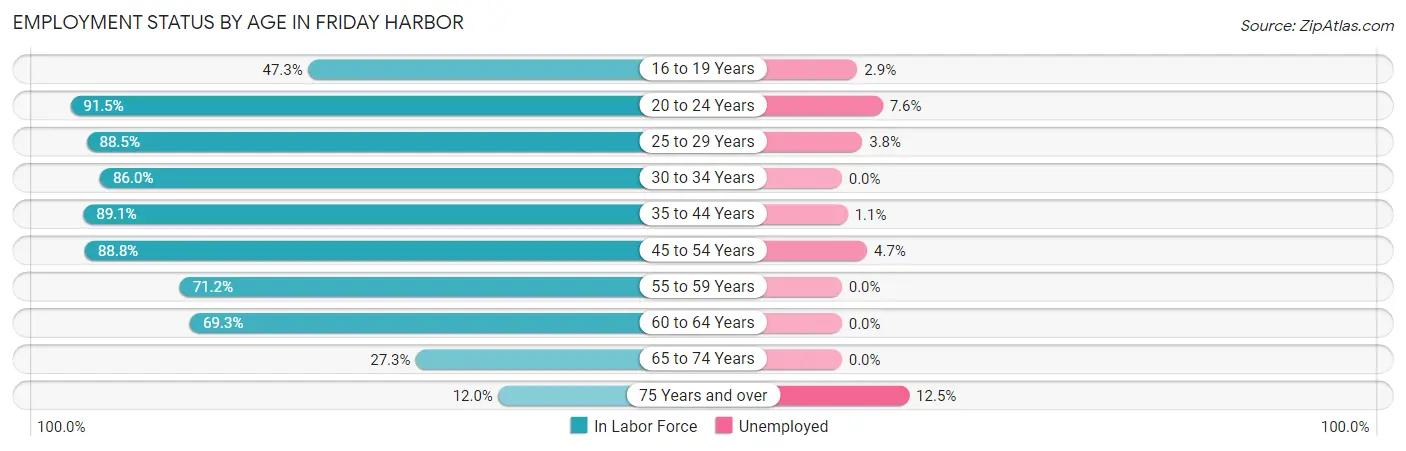
| Age Bracket | In Labor Force | Unemployed |
| 16 to 19 Years | 69 (47.3%) | 2 (2.9%) |
| 20 to 24 Years | 119 (91.5%) | 9 (7.6%) |
| 25 to 29 Years | 185 (88.5%) | 7 (3.8%) |
| 30 to 34 Years | 148 (86.0%) | 0 (0.0%) |
| 35 to 44 Years | 285 (89.1%) | 3 (1.1%) |
| 45 to 54 Years | 340 (88.8%) | 16 (4.7%) |
| 55 to 59 Years | 104 (71.2%) | 0 (0.0%) |
| 60 to 64 Years | 124 (69.3%) | 0 (0.0%) |
| 65 to 74 Years | 75 (27.3%) | 0 (0.0%) |
| 75 Years and over | 24 (12.0%) | 3 (12.5%) |
| Total | 1,473 (68.2%) | 40 (2.7%) |
Employment Status by Educational Attainment in Friday Harbor
According to labor force statistics for Friday Harbor, 84.2% of individuals (1,186) out of the total population between 25 and 64 years of age (1,409) are in the labor force, with 2.2% or 26 of them being unemployed. The group with the highest labor force participation rate are those with the educational attainment of bachelor's degree or higher, with 90.3% or 463 individuals in the labor force. Within the labor force, individuals with high school diploma education have the highest percentage of unemployment, with 4.9% or 15 of them being unemployed.
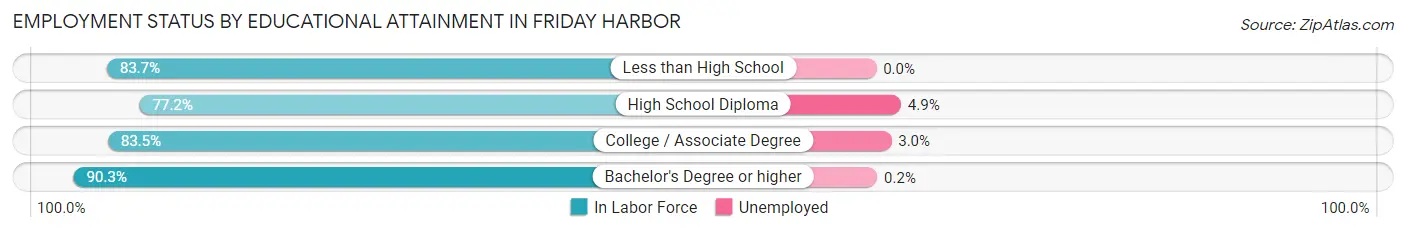
| Educational Attainment | In Labor Force | Unemployed |
| Less than High School | 82 (83.7%) | 0 (0.0%) |
| High School Diploma | 308 (77.2%) | 20 (4.9%) |
| College / Associate Degree | 333 (83.5%) | 12 (3.0%) |
| Bachelor's Degree or higher | 463 (90.3%) | 1 (0.2%) |
| Total | 1,186 (84.2%) | 31 (2.2%) |
Employment Occupations by Sex in Friday Harbor
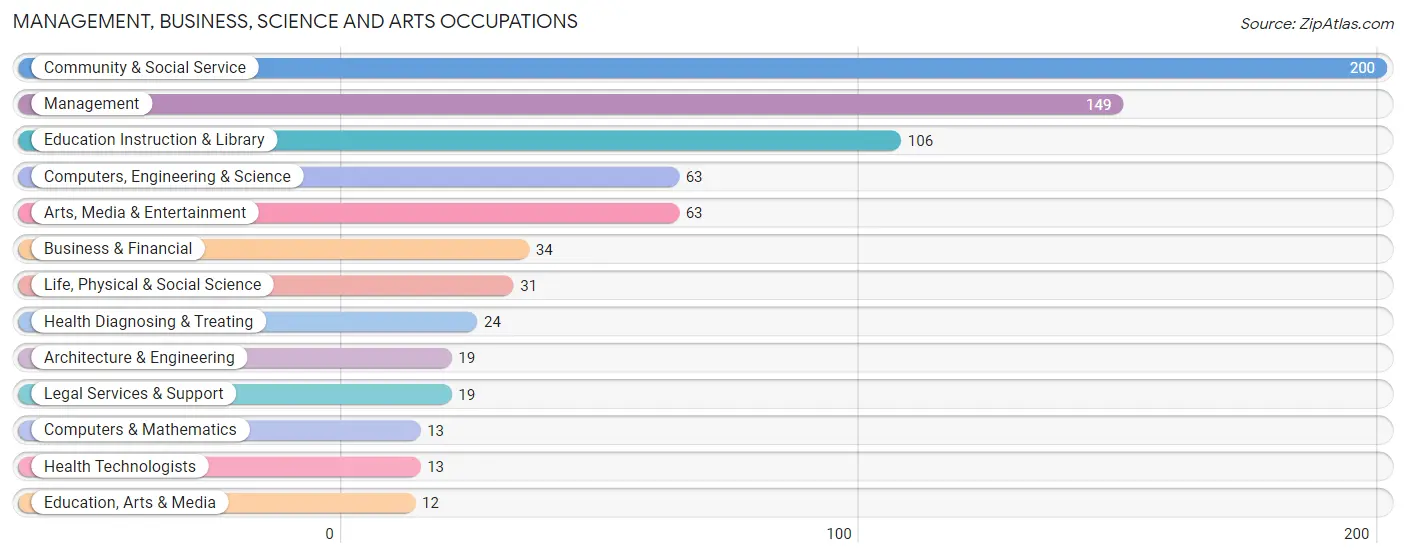
Management, Business, Science and Arts Occupations
The most common Management, Business, Science and Arts occupations in Friday Harbor are Community & Social Service (200 | 14.0%), Management (149 | 10.4%), Education Instruction & Library (106 | 7.4%), Computers, Engineering & Science (63 | 4.4%), and Arts, Media & Entertainment (63 | 4.4%).
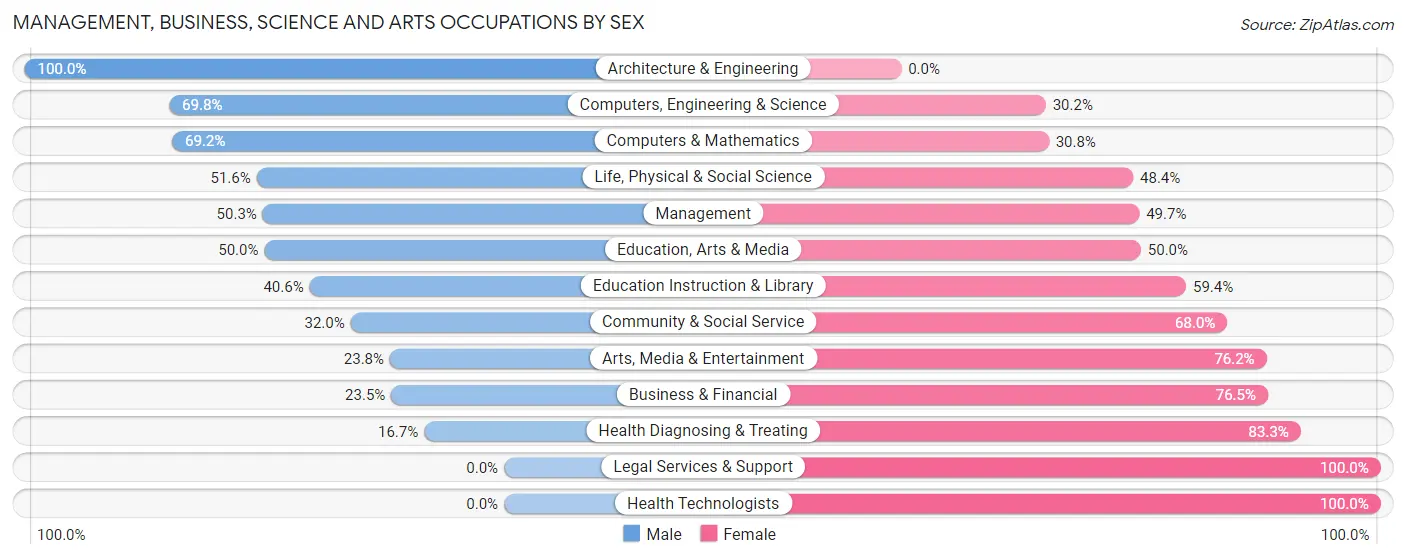
Management, Business, Science and Arts Occupations by Sex
Within the Management, Business, Science and Arts occupations in Friday Harbor, the most male-oriented occupations are Architecture & Engineering (100.0%), Computers, Engineering & Science (69.8%), and Computers & Mathematics (69.2%), while the most female-oriented occupations are Legal Services & Support (100.0%), Health Technologists (100.0%), and Health Diagnosing & Treating (83.3%).
| Occupation | Male | Female |
| Management | 75 (50.3%) | 74 (49.7%) |
| Business & Financial | 8 (23.5%) | 26 (76.5%) |
| Computers, Engineering & Science | 44 (69.8%) | 19 (30.2%) |
| Computers & Mathematics | 9 (69.2%) | 4 (30.8%) |
| Architecture & Engineering | 19 (100.0%) | 0 (0.0%) |
| Life, Physical & Social Science | 16 (51.6%) | 15 (48.4%) |
| Community & Social Service | 64 (32.0%) | 136 (68.0%) |
| Education, Arts & Media | 6 (50.0%) | 6 (50.0%) |
| Legal Services & Support | 0 (0.0%) | 19 (100.0%) |
| Education Instruction & Library | 43 (40.6%) | 63 (59.4%) |
| Arts, Media & Entertainment | 15 (23.8%) | 48 (76.2%) |
| Health Diagnosing & Treating | 4 (16.7%) | 20 (83.3%) |
| Health Technologists | 0 (0.0%) | 13 (100.0%) |
| Total (Category) | 195 (41.5%) | 275 (58.5%) |
| Total (Overall) | 643 (44.9%) | 790 (55.1%) |
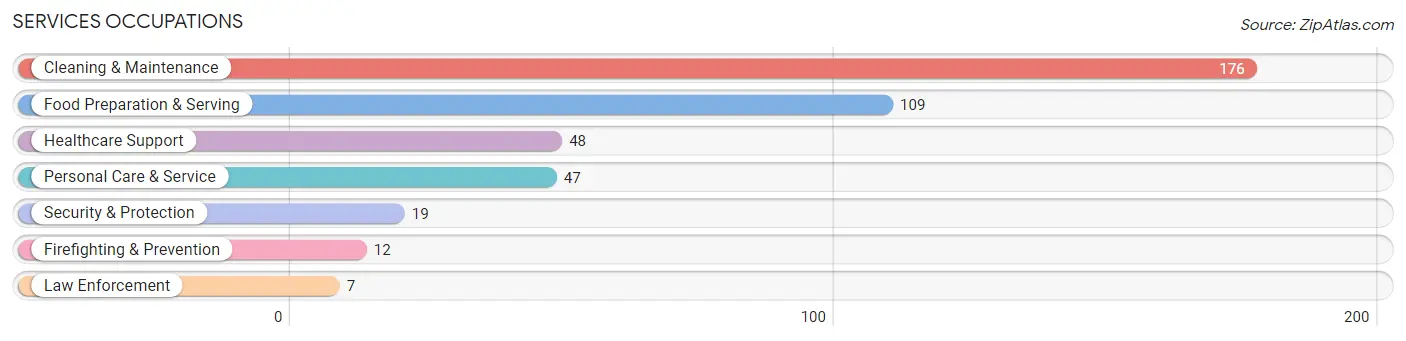
Services Occupations
The most common Services occupations in Friday Harbor are Cleaning & Maintenance (176 | 12.3%), Food Preparation & Serving (109 | 7.6%), Healthcare Support (48 | 3.4%), Personal Care & Service (47 | 3.3%), and Security & Protection (19 | 1.3%).
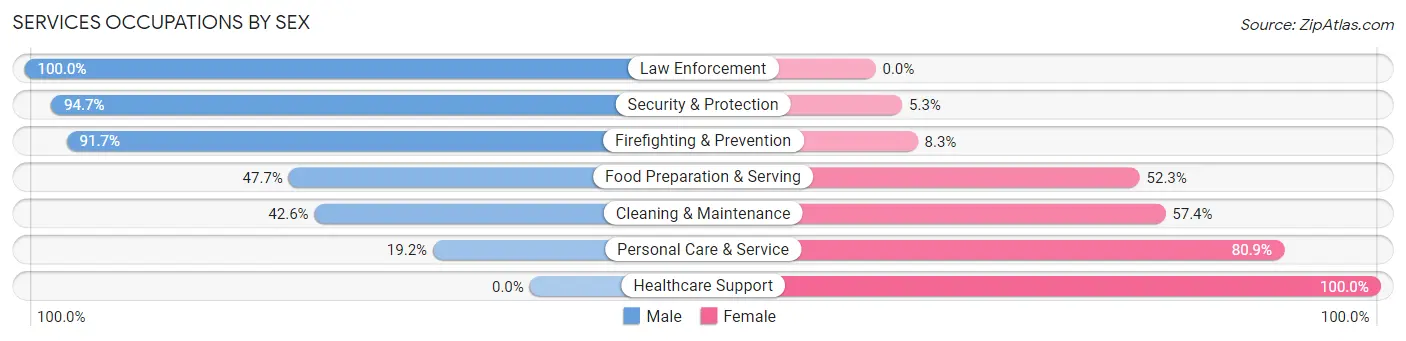
Services Occupations by Sex
Within the Services occupations in Friday Harbor, the most male-oriented occupations are Law Enforcement (100.0%), Security & Protection (94.7%), and Firefighting & Prevention (91.7%), while the most female-oriented occupations are Healthcare Support (100.0%), Personal Care & Service (80.8%), and Cleaning & Maintenance (57.4%).
| Occupation | Male | Female |
| Healthcare Support | 0 (0.0%) | 48 (100.0%) |
| Security & Protection | 18 (94.7%) | 1 (5.3%) |
| Firefighting & Prevention | 11 (91.7%) | 1 (8.3%) |
| Law Enforcement | 7 (100.0%) | 0 (0.0%) |
| Food Preparation & Serving | 52 (47.7%) | 57 (52.3%) |
| Cleaning & Maintenance | 75 (42.6%) | 101 (57.4%) |
| Personal Care & Service | 9 (19.2%) | 38 (80.8%) |
| Total (Category) | 154 (38.6%) | 245 (61.4%) |
| Total (Overall) | 643 (44.9%) | 790 (55.1%) |
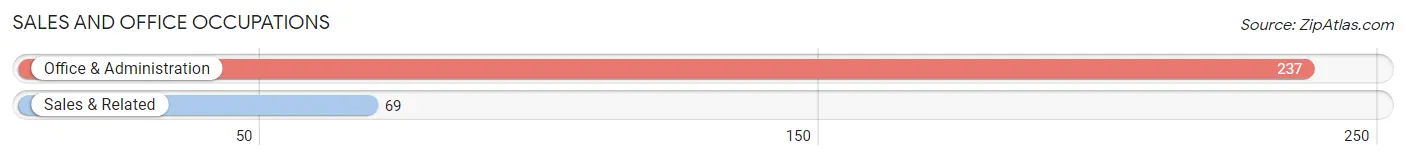
Sales and Office Occupations
The most common Sales and Office occupations in Friday Harbor are Office & Administration (237 | 16.5%), and Sales & Related (69 | 4.8%).
Sales and Office Occupations by Sex
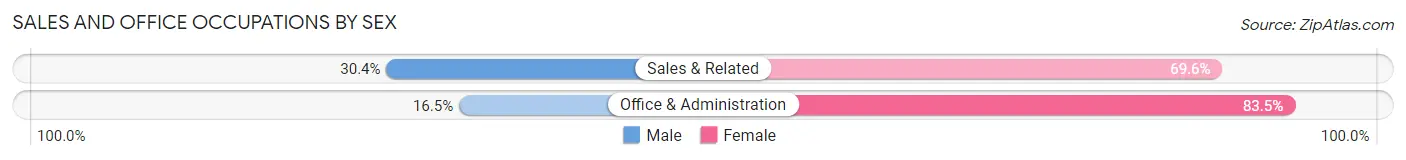
| Occupation | Male | Female |
| Sales & Related | 21 (30.4%) | 48 (69.6%) |
| Office & Administration | 39 (16.5%) | 198 (83.5%) |
| Total (Category) | 60 (19.6%) | 246 (80.4%) |
| Total (Overall) | 643 (44.9%) | 790 (55.1%) |
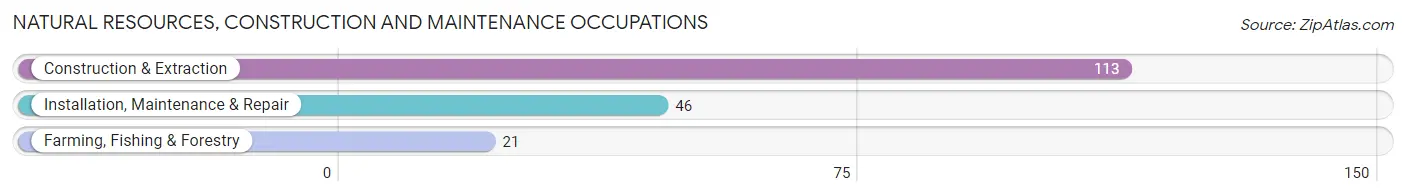
Natural Resources, Construction and Maintenance Occupations
The most common Natural Resources, Construction and Maintenance occupations in Friday Harbor are Construction & Extraction (113 | 7.9%), Installation, Maintenance & Repair (46 | 3.2%), and Farming, Fishing & Forestry (21 | 1.5%).
Natural Resources, Construction and Maintenance Occupations by Sex
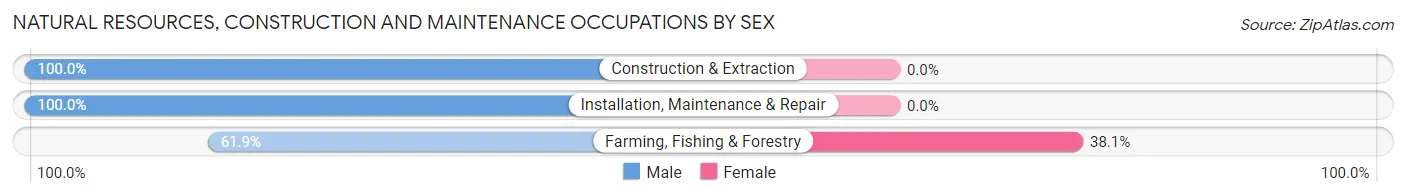
| Occupation | Male | Female |
| Farming, Fishing & Forestry | 13 (61.9%) | 8 (38.1%) |
| Construction & Extraction | 113 (100.0%) | 0 (0.0%) |
| Installation, Maintenance & Repair | 46 (100.0%) | 0 (0.0%) |
| Total (Category) | 172 (95.6%) | 8 (4.4%) |
| Total (Overall) | 643 (44.9%) | 790 (55.1%) |
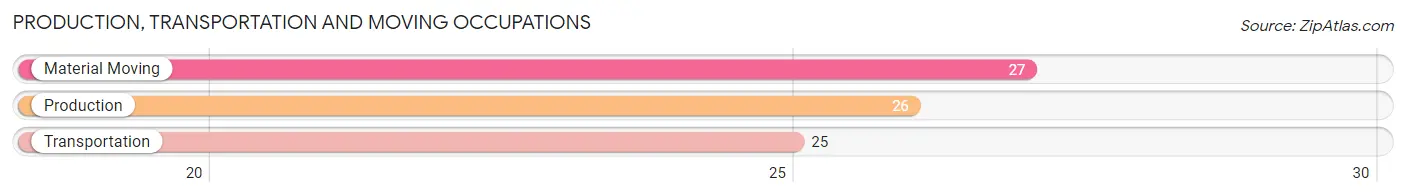
Production, Transportation and Moving Occupations
The most common Production, Transportation and Moving occupations in Friday Harbor are Material Moving (27 | 1.9%), Production (26 | 1.8%), and Transportation (25 | 1.7%).
Production, Transportation and Moving Occupations by Sex
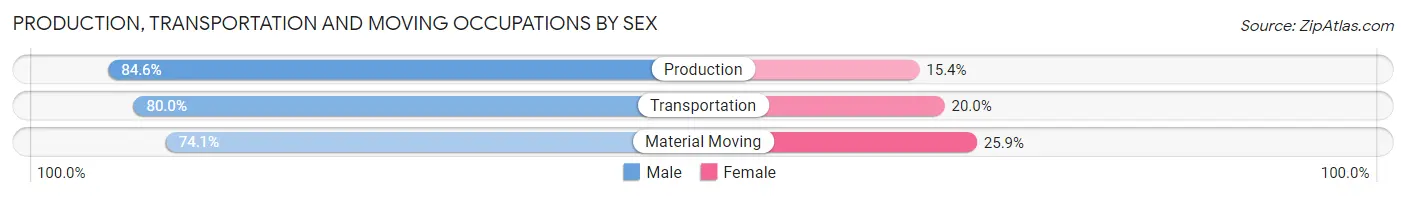
| Occupation | Male | Female |
| Production | 22 (84.6%) | 4 (15.4%) |
| Transportation | 20 (80.0%) | 5 (20.0%) |
| Material Moving | 20 (74.1%) | 7 (25.9%) |
| Total (Category) | 62 (79.5%) | 16 (20.5%) |
| Total (Overall) | 643 (44.9%) | 790 (55.1%) |
Employment Industries by Sex in Friday Harbor
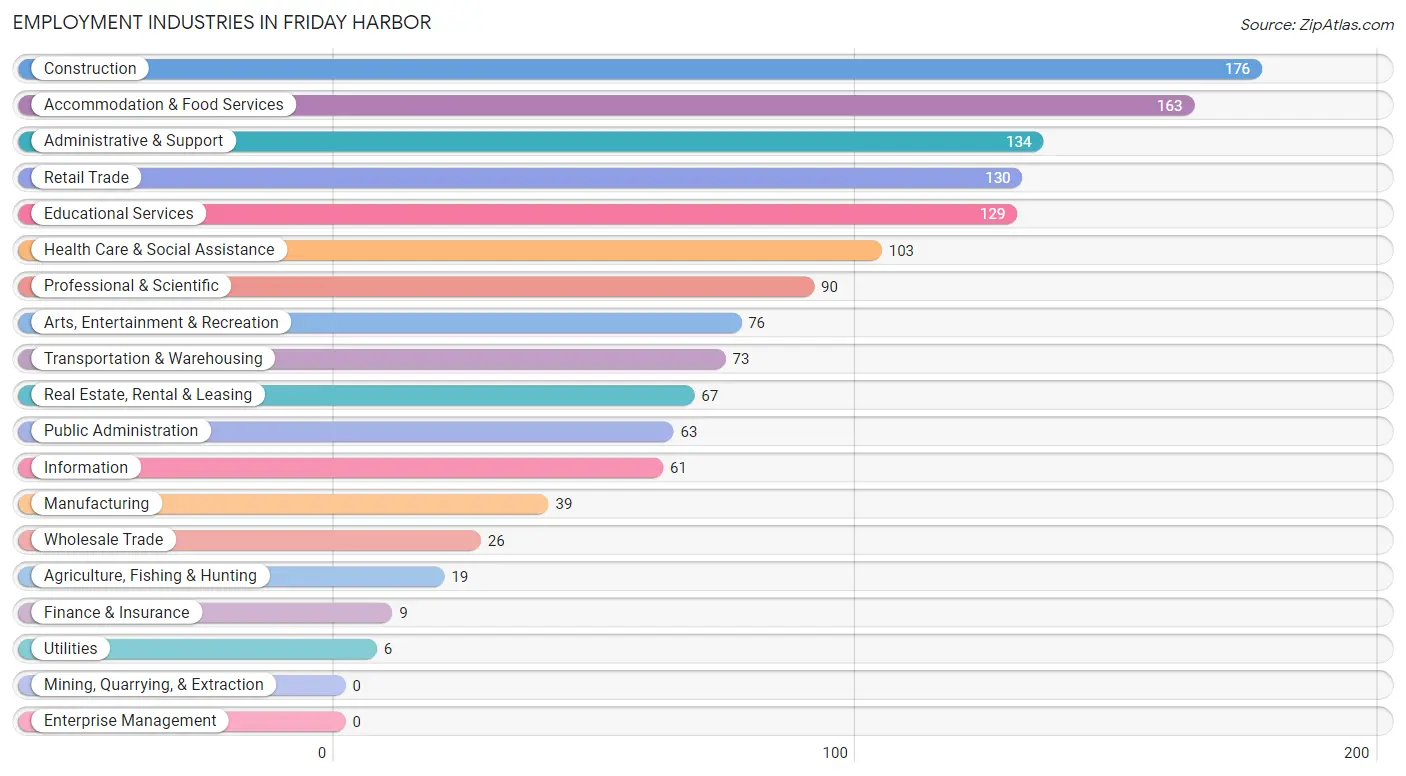
Employment Industries in Friday Harbor
The major employment industries in Friday Harbor include Construction (176 | 12.3%), Accommodation & Food Services (163 | 11.4%), Administrative & Support (134 | 9.3%), Retail Trade (130 | 9.1%), and Educational Services (129 | 9.0%).
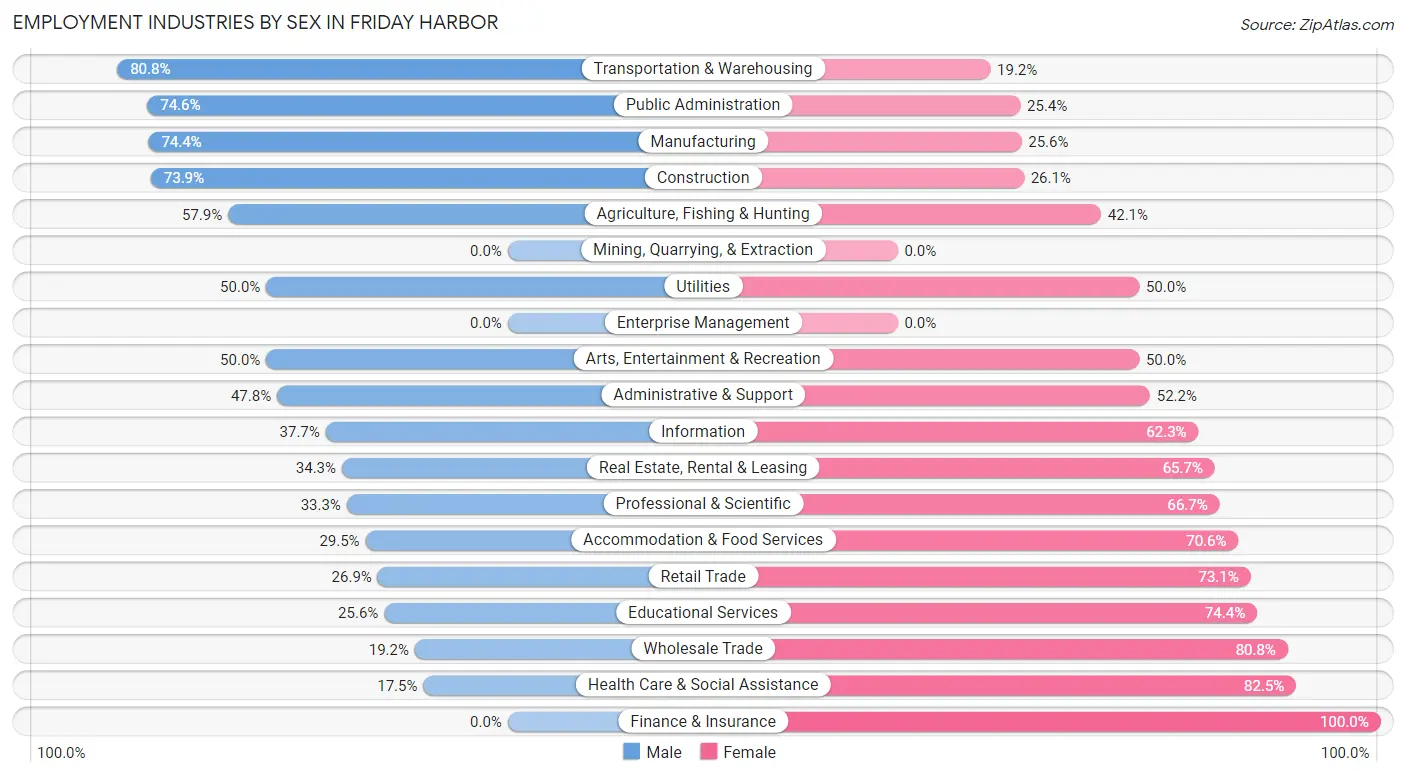
Employment Industries by Sex in Friday Harbor
The Friday Harbor industries that see more men than women are Transportation & Warehousing (80.8%), Public Administration (74.6%), and Manufacturing (74.4%), whereas the industries that tend to have a higher number of women are Finance & Insurance (100.0%), Health Care & Social Assistance (82.5%), and Wholesale Trade (80.8%).
| Industry | Male | Female |
| Agriculture, Fishing & Hunting | 11 (57.9%) | 8 (42.1%) |
| Mining, Quarrying, & Extraction | 0 (0.0%) | 0 (0.0%) |
| Construction | 130 (73.9%) | 46 (26.1%) |
| Manufacturing | 29 (74.4%) | 10 (25.6%) |
| Wholesale Trade | 5 (19.2%) | 21 (80.8%) |
| Retail Trade | 35 (26.9%) | 95 (73.1%) |
| Transportation & Warehousing | 59 (80.8%) | 14 (19.2%) |
| Utilities | 3 (50.0%) | 3 (50.0%) |
| Information | 23 (37.7%) | 38 (62.3%) |
| Finance & Insurance | 0 (0.0%) | 9 (100.0%) |
| Real Estate, Rental & Leasing | 23 (34.3%) | 44 (65.7%) |
| Professional & Scientific | 30 (33.3%) | 60 (66.7%) |
| Enterprise Management | 0 (0.0%) | 0 (0.0%) |
| Administrative & Support | 64 (47.8%) | 70 (52.2%) |
| Educational Services | 33 (25.6%) | 96 (74.4%) |
| Health Care & Social Assistance | 18 (17.5%) | 85 (82.5%) |
| Arts, Entertainment & Recreation | 38 (50.0%) | 38 (50.0%) |
| Accommodation & Food Services | 48 (29.4%) | 115 (70.6%) |
| Public Administration | 47 (74.6%) | 16 (25.4%) |
| Total | 643 (44.9%) | 790 (55.1%) |
Education in Friday Harbor
School Enrollment in Friday Harbor
The most common levels of schooling among the 597 students in Friday Harbor are high school (168 | 28.1%), middle school (139 | 23.3%), and elementary school (132 | 22.1%).
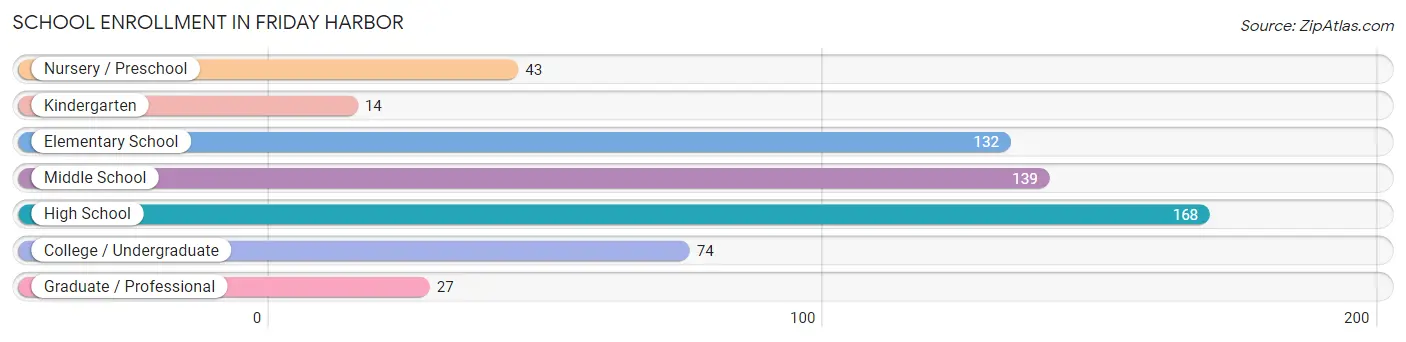
| School Level | # Students | % Students |
| Nursery / Preschool | 43 | 7.2% |
| Kindergarten | 14 | 2.4% |
| Elementary School | 132 | 22.1% |
| Middle School | 139 | 23.3% |
| High School | 168 | 28.1% |
| College / Undergraduate | 74 | 12.4% |
| Graduate / Professional | 27 | 4.5% |
| Total | 597 | 100.0% |
School Enrollment by Age by Funding Source in Friday Harbor
Out of a total of 597 students who are enrolled in schools in Friday Harbor, 152 (25.5%) attend a private institution, while the remaining 445 (74.5%) are enrolled in public schools. The age group of 20 to 24 year olds has the highest likelihood of being enrolled in private schools, with 23 (69.7% in the age bracket) enrolled. Conversely, the age group of 25 to 34 year olds has the lowest likelihood of being enrolled in a private school, with 11 (100.0% in the age bracket) attending a public institution.
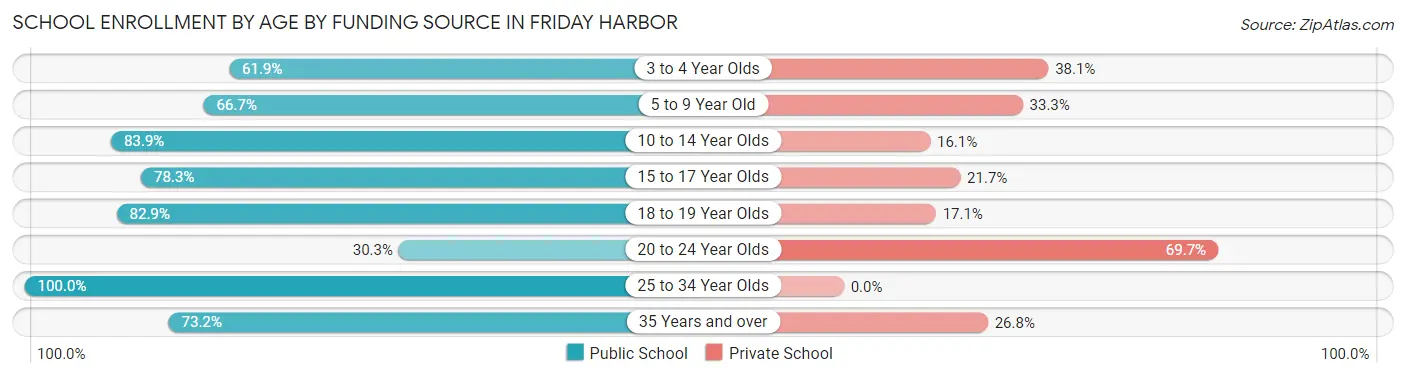
| Age Bracket | Public School | Private School |
| 3 to 4 Year Olds | 13 (61.9%) | 8 (38.1%) |
| 5 to 9 Year Old | 94 (66.7%) | 47 (33.3%) |
| 10 to 14 Year Olds | 146 (83.9%) | 28 (16.1%) |
| 15 to 17 Year Olds | 83 (78.3%) | 23 (21.7%) |
| 18 to 19 Year Olds | 58 (82.9%) | 12 (17.1%) |
| 20 to 24 Year Olds | 10 (30.3%) | 23 (69.7%) |
| 25 to 34 Year Olds | 11 (100.0%) | 0 (0.0%) |
| 35 Years and over | 30 (73.2%) | 11 (26.8%) |
| Total | 445 (74.5%) | 152 (25.5%) |
Educational Attainment by Field of Study in Friday Harbor
Bio, nature & agricultural (111 | 13.4%), business (92 | 11.1%), social sciences (91 | 11.0%), literature & languages (88 | 10.6%), and visual & performing arts (84 | 10.1%) are the most common fields of study among 830 individuals in Friday Harbor who have obtained a bachelor's degree or higher.
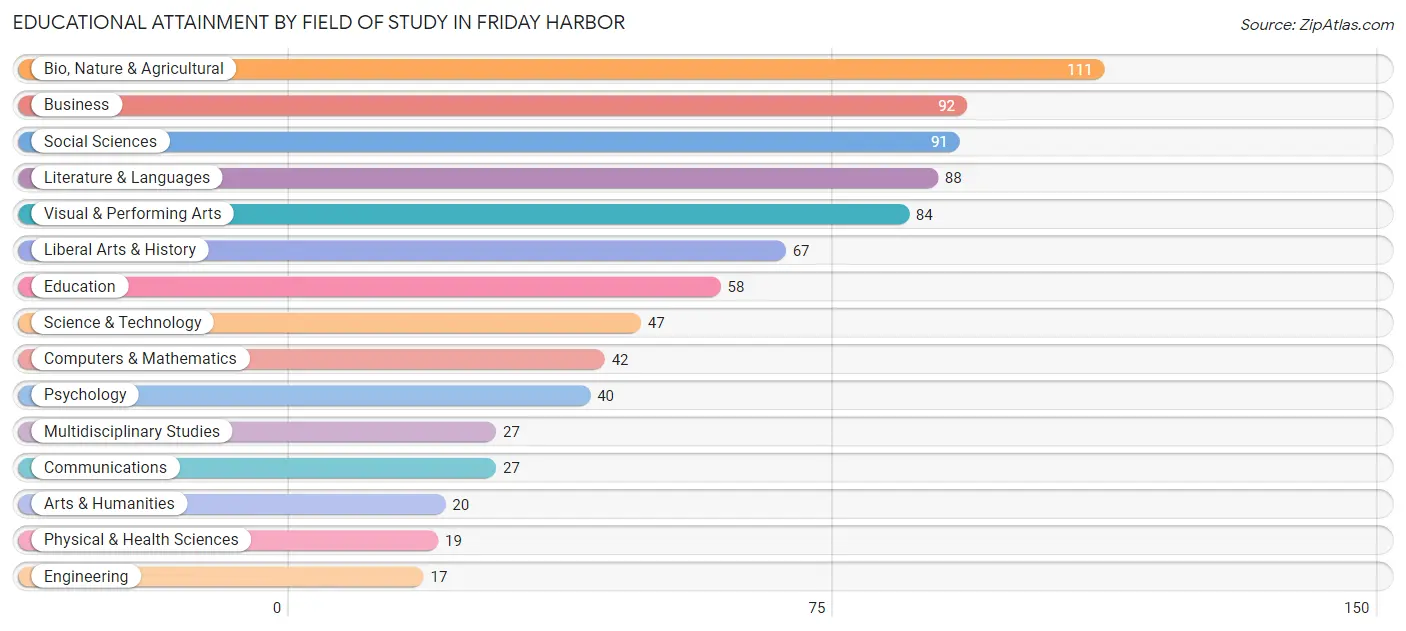
| Field of Study | # Graduates | % Graduates |
| Computers & Mathematics | 42 | 5.1% |
| Bio, Nature & Agricultural | 111 | 13.4% |
| Physical & Health Sciences | 19 | 2.3% |
| Psychology | 40 | 4.8% |
| Social Sciences | 91 | 11.0% |
| Engineering | 17 | 2.1% |
| Multidisciplinary Studies | 27 | 3.3% |
| Science & Technology | 47 | 5.7% |
| Business | 92 | 11.1% |
| Education | 58 | 7.0% |
| Literature & Languages | 88 | 10.6% |
| Liberal Arts & History | 67 | 8.1% |
| Visual & Performing Arts | 84 | 10.1% |
| Communications | 27 | 3.3% |
| Arts & Humanities | 20 | 2.4% |
| Total | 830 | 100.0% |
Transportation & Commute in Friday Harbor
Vehicle Availability by Sex in Friday Harbor
The most prevalent vehicle ownership categories in Friday Harbor are males with 2 vehicles (300, accounting for 47.8%) and females with 2 vehicles (353, making up 40.0%).
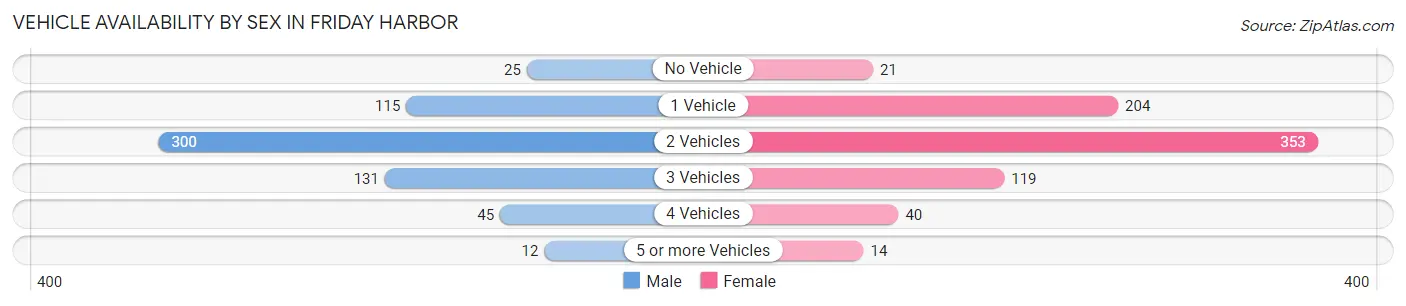
| Vehicles Available | Male | Female |
| No Vehicle | 25 (4.0%) | 21 (2.8%) |
| 1 Vehicle | 115 (18.3%) | 204 (27.2%) |
| 2 Vehicles | 300 (47.8%) | 353 (47.0%) |
| 3 Vehicles | 131 (20.9%) | 119 (15.9%) |
| 4 Vehicles | 45 (7.2%) | 40 (5.3%) |
| 5 or more Vehicles | 12 (1.9%) | 14 (1.9%) |
| Total | 628 (100.0%) | 751 (100.0%) |
Commute Time in Friday Harbor
The most frequently occuring commute durations in Friday Harbor are 5 to 9 minutes (454 commuters, 36.8%), 10 to 14 minutes (299 commuters, 24.2%), and less than 5 minutes (285 commuters, 23.1%).
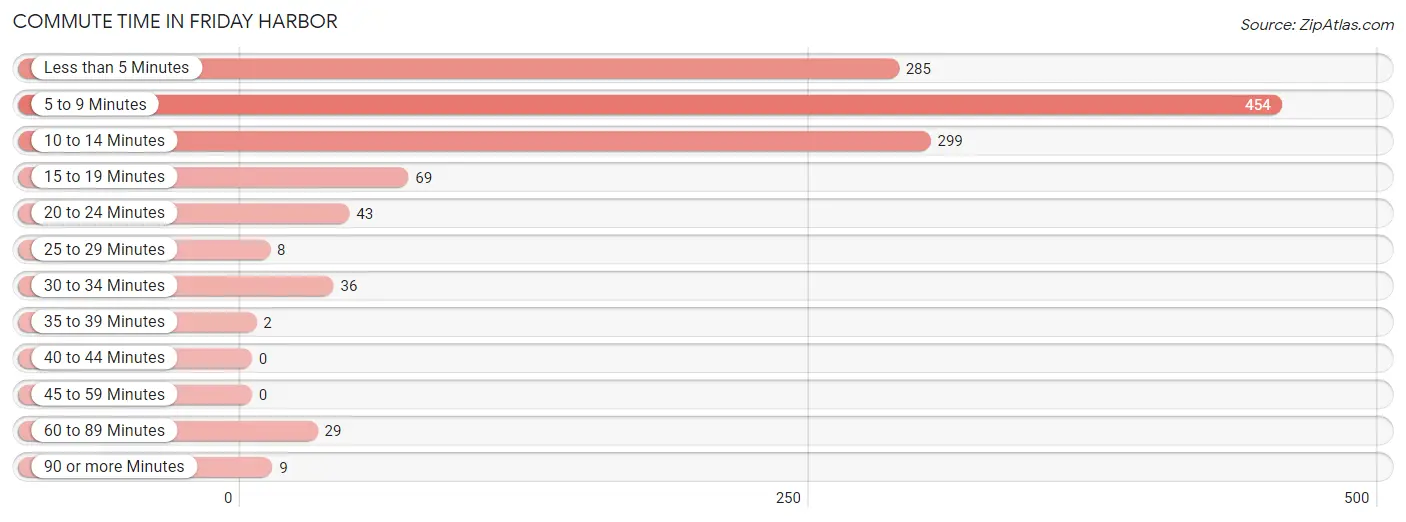
| Commute Time | # Commuters | % Commuters |
| Less than 5 Minutes | 285 | 23.1% |
| 5 to 9 Minutes | 454 | 36.8% |
| 10 to 14 Minutes | 299 | 24.2% |
| 15 to 19 Minutes | 69 | 5.6% |
| 20 to 24 Minutes | 43 | 3.5% |
| 25 to 29 Minutes | 8 | 0.6% |
| 30 to 34 Minutes | 36 | 2.9% |
| 35 to 39 Minutes | 2 | 0.2% |
| 40 to 44 Minutes | 0 | 0.0% |
| 45 to 59 Minutes | 0 | 0.0% |
| 60 to 89 Minutes | 29 | 2.4% |
| 90 or more Minutes | 9 | 0.7% |
Commute Time by Sex in Friday Harbor
The most common commute times in Friday Harbor are 5 to 9 minutes (212 commuters, 37.2%) for males and 5 to 9 minutes (242 commuters, 36.4%) for females.
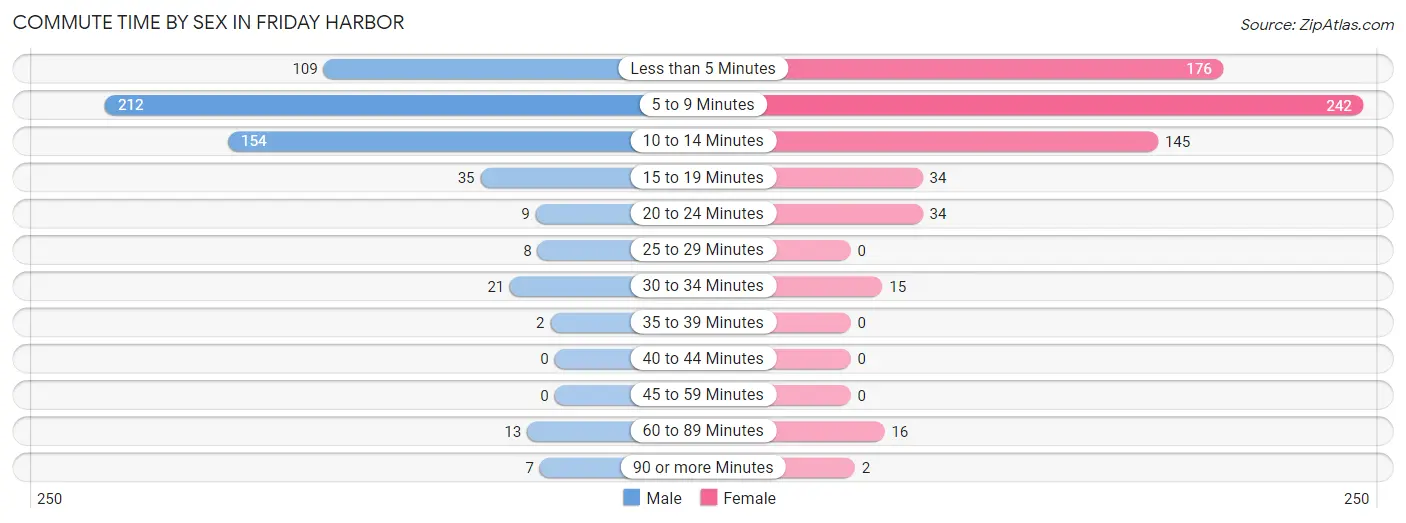
| Commute Time | Male | Female |
| Less than 5 Minutes | 109 (19.1%) | 176 (26.5%) |
| 5 to 9 Minutes | 212 (37.2%) | 242 (36.4%) |
| 10 to 14 Minutes | 154 (27.0%) | 145 (21.8%) |
| 15 to 19 Minutes | 35 (6.1%) | 34 (5.1%) |
| 20 to 24 Minutes | 9 (1.6%) | 34 (5.1%) |
| 25 to 29 Minutes | 8 (1.4%) | 0 (0.0%) |
| 30 to 34 Minutes | 21 (3.7%) | 15 (2.3%) |
| 35 to 39 Minutes | 2 (0.4%) | 0 (0.0%) |
| 40 to 44 Minutes | 0 (0.0%) | 0 (0.0%) |
| 45 to 59 Minutes | 0 (0.0%) | 0 (0.0%) |
| 60 to 89 Minutes | 13 (2.3%) | 16 (2.4%) |
| 90 or more Minutes | 7 (1.2%) | 2 (0.3%) |
Time of Departure to Work by Sex in Friday Harbor
The most frequent times of departure to work in Friday Harbor are 7:30 AM to 7:59 AM (143, 25.1%) for males and 7:30 AM to 7:59 AM (96, 14.5%) for females.
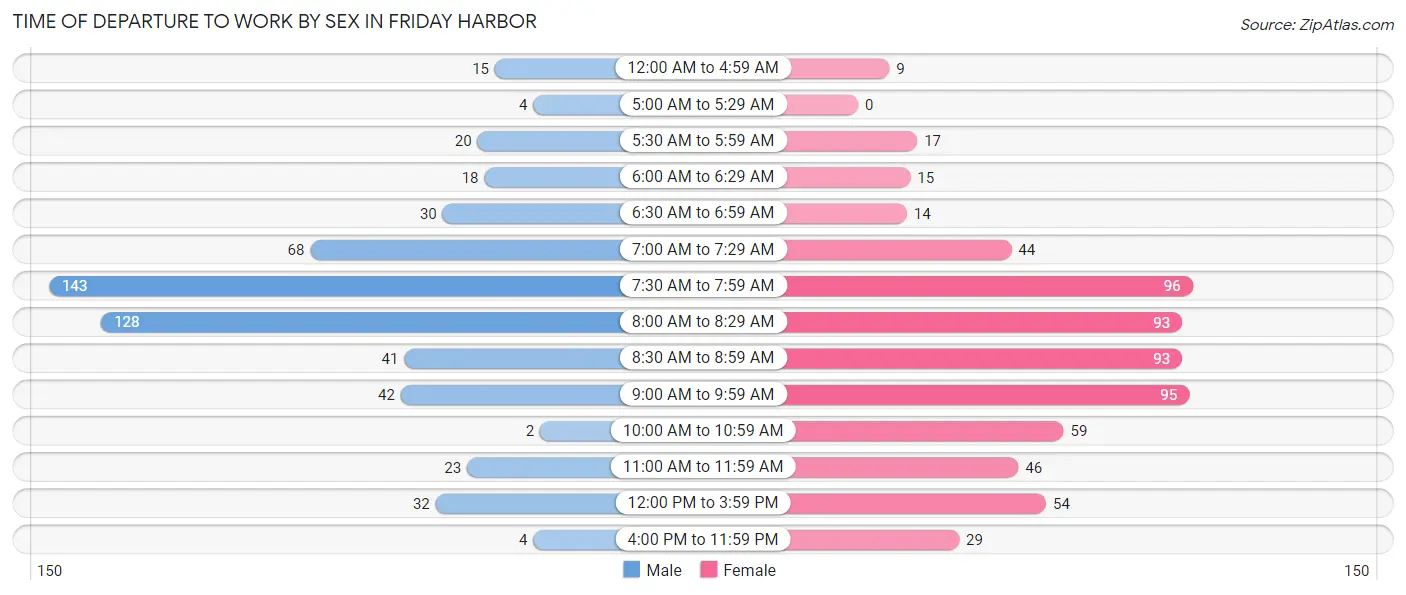
| Time of Departure | Male | Female |
| 12:00 AM to 4:59 AM | 15 (2.6%) | 9 (1.4%) |
| 5:00 AM to 5:29 AM | 4 (0.7%) | 0 (0.0%) |
| 5:30 AM to 5:59 AM | 20 (3.5%) | 17 (2.6%) |
| 6:00 AM to 6:29 AM | 18 (3.2%) | 15 (2.3%) |
| 6:30 AM to 6:59 AM | 30 (5.3%) | 14 (2.1%) |
| 7:00 AM to 7:29 AM | 68 (11.9%) | 44 (6.6%) |
| 7:30 AM to 7:59 AM | 143 (25.1%) | 96 (14.5%) |
| 8:00 AM to 8:29 AM | 128 (22.5%) | 93 (14.0%) |
| 8:30 AM to 8:59 AM | 41 (7.2%) | 93 (14.0%) |
| 9:00 AM to 9:59 AM | 42 (7.4%) | 95 (14.3%) |
| 10:00 AM to 10:59 AM | 2 (0.4%) | 59 (8.9%) |
| 11:00 AM to 11:59 AM | 23 (4.0%) | 46 (6.9%) |
| 12:00 PM to 3:59 PM | 32 (5.6%) | 54 (8.1%) |
| 4:00 PM to 11:59 PM | 4 (0.7%) | 29 (4.4%) |
| Total | 570 (100.0%) | 664 (100.0%) |
Housing Occupancy in Friday Harbor
Occupancy by Ownership in Friday Harbor
Of the total 1,178 dwellings in Friday Harbor, owner-occupied units account for 680 (57.7%), while renter-occupied units make up 498 (42.3%).
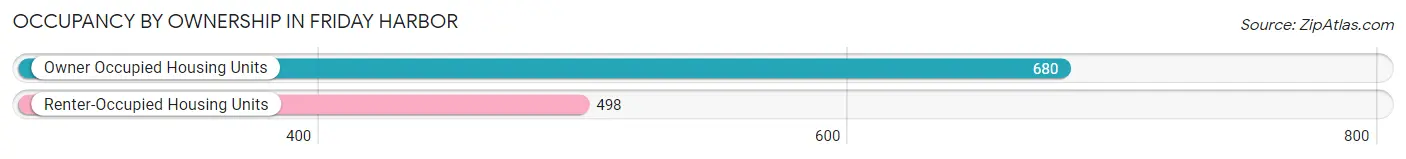
| Occupancy | # Housing Units | % Housing Units |
| Owner Occupied Housing Units | 680 | 57.7% |
| Renter-Occupied Housing Units | 498 | 42.3% |
| Total Occupied Housing Units | 1,178 | 100.0% |
Occupancy by Household Size in Friday Harbor
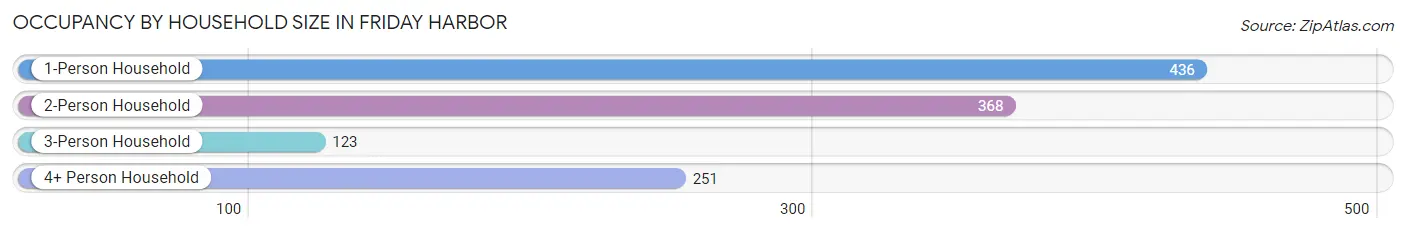
| Household Size | # Housing Units | % Housing Units |
| 1-Person Household | 436 | 37.0% |
| 2-Person Household | 368 | 31.2% |
| 3-Person Household | 123 | 10.4% |
| 4+ Person Household | 251 | 21.3% |
| Total Housing Units | 1,178 | 100.0% |
Occupancy by Ownership by Household Size in Friday Harbor
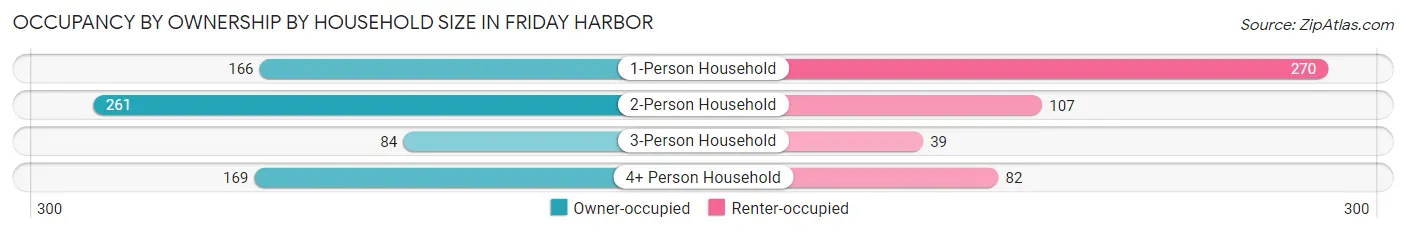
| Household Size | Owner-occupied | Renter-occupied |
| 1-Person Household | 166 (38.1%) | 270 (61.9%) |
| 2-Person Household | 261 (70.9%) | 107 (29.1%) |
| 3-Person Household | 84 (68.3%) | 39 (31.7%) |
| 4+ Person Household | 169 (67.3%) | 82 (32.7%) |
| Total Housing Units | 680 (57.7%) | 498 (42.3%) |
Occupancy by Educational Attainment in Friday Harbor
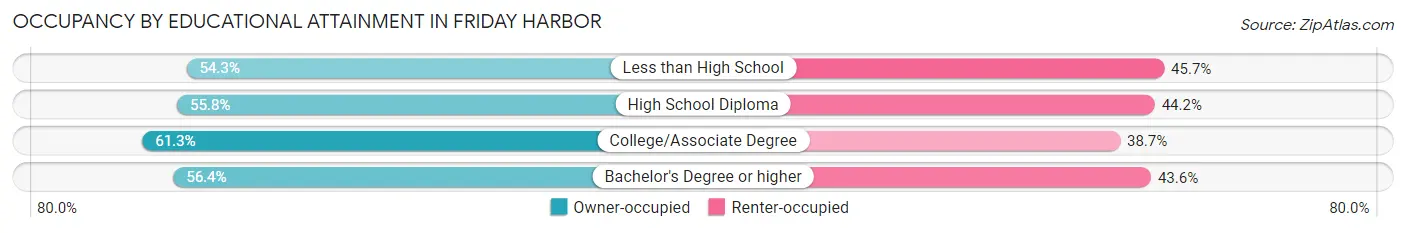
| Household Size | Owner-occupied | Renter-occupied |
| Less than High School | 44 (54.3%) | 37 (45.7%) |
| High School Diploma | 139 (55.8%) | 110 (44.2%) |
| College/Associate Degree | 233 (61.3%) | 147 (38.7%) |
| Bachelor's Degree or higher | 264 (56.4%) | 204 (43.6%) |
Occupancy by Age of Householder in Friday Harbor
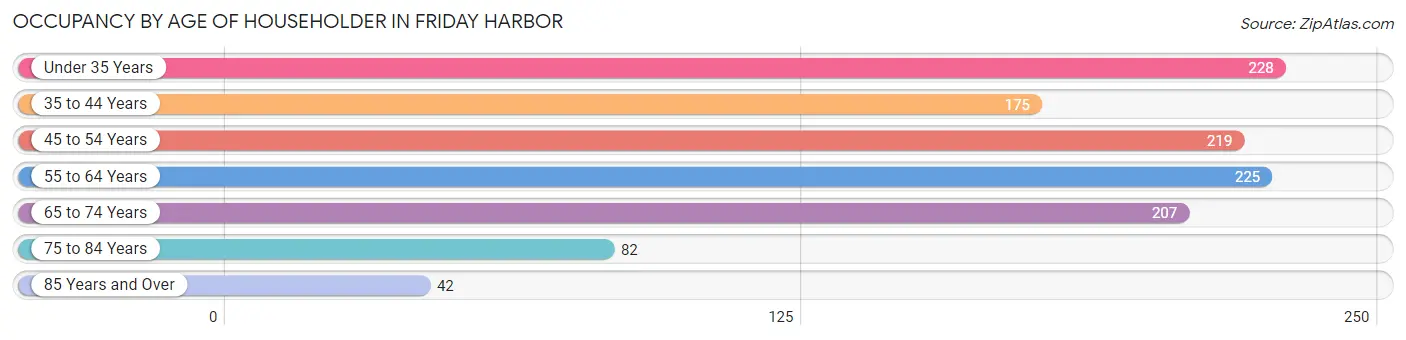
| Age Bracket | # Households | % Households |
| Under 35 Years | 228 | 19.4% |
| 35 to 44 Years | 175 | 14.9% |
| 45 to 54 Years | 219 | 18.6% |
| 55 to 64 Years | 225 | 19.1% |
| 65 to 74 Years | 207 | 17.6% |
| 75 to 84 Years | 82 | 7.0% |
| 85 Years and Over | 42 | 3.6% |
| Total | 1,178 | 100.0% |
Housing Finances in Friday Harbor
Median Income by Occupancy in Friday Harbor
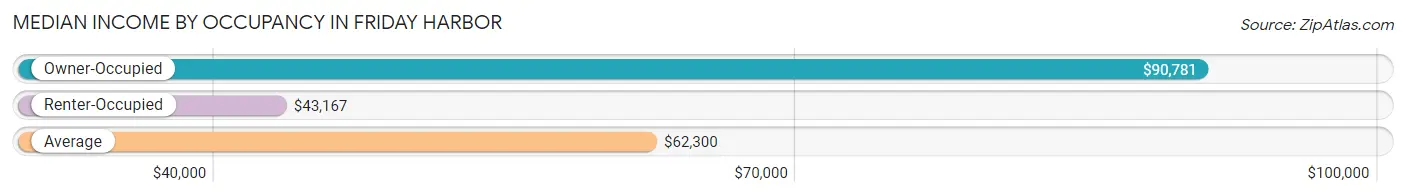
| Occupancy Type | # Households | Median Income |
| Owner-Occupied | 680 (57.7%) | $90,781 |
| Renter-Occupied | 498 (42.3%) | $43,167 |
| Average | 1,178 (100.0%) | $62,300 |
Occupancy by Householder Income Bracket in Friday Harbor
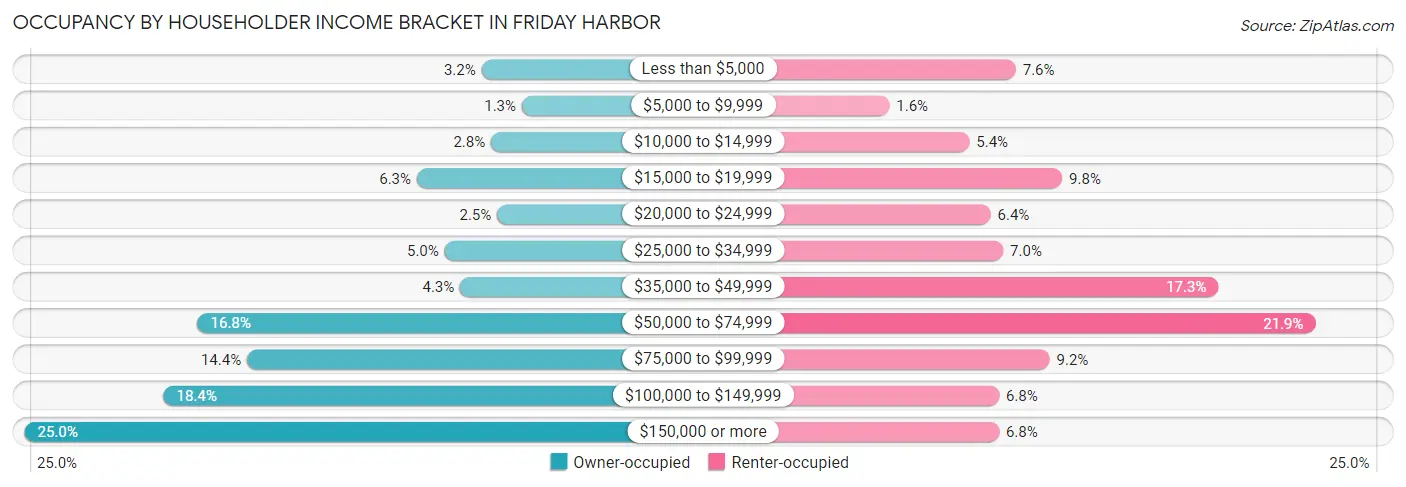
| Income Bracket | Owner-occupied | Renter-occupied |
| Less than $5,000 | 22 (3.2%) | 38 (7.6%) |
| $5,000 to $9,999 | 9 (1.3%) | 8 (1.6%) |
| $10,000 to $14,999 | 19 (2.8%) | 27 (5.4%) |
| $15,000 to $19,999 | 43 (6.3%) | 49 (9.8%) |
| $20,000 to $24,999 | 17 (2.5%) | 32 (6.4%) |
| $25,000 to $34,999 | 34 (5.0%) | 35 (7.0%) |
| $35,000 to $49,999 | 29 (4.3%) | 86 (17.3%) |
| $50,000 to $74,999 | 114 (16.8%) | 109 (21.9%) |
| $75,000 to $99,999 | 98 (14.4%) | 46 (9.2%) |
| $100,000 to $149,999 | 125 (18.4%) | 34 (6.8%) |
| $150,000 or more | 170 (25.0%) | 34 (6.8%) |
| Total | 680 (100.0%) | 498 (100.0%) |
Monthly Housing Cost Tiers in Friday Harbor
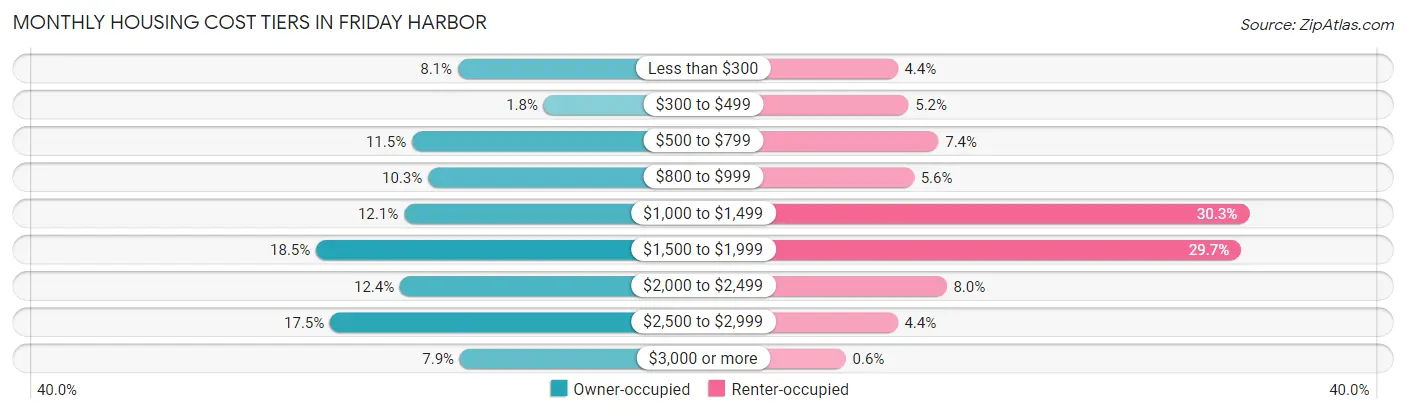
| Monthly Cost | Owner-occupied | Renter-occupied |
| Less than $300 | 55 (8.1%) | 22 (4.4%) |
| $300 to $499 | 12 (1.8%) | 26 (5.2%) |
| $500 to $799 | 78 (11.5%) | 37 (7.4%) |
| $800 to $999 | 70 (10.3%) | 28 (5.6%) |
| $1,000 to $1,499 | 82 (12.1%) | 151 (30.3%) |
| $1,500 to $1,999 | 126 (18.5%) | 148 (29.7%) |
| $2,000 to $2,499 | 84 (12.3%) | 40 (8.0%) |
| $2,500 to $2,999 | 119 (17.5%) | 22 (4.4%) |
| $3,000 or more | 54 (7.9%) | 3 (0.6%) |
| Total | 680 (100.0%) | 498 (100.0%) |
Physical Housing Characteristics in Friday Harbor
Housing Structures in Friday Harbor
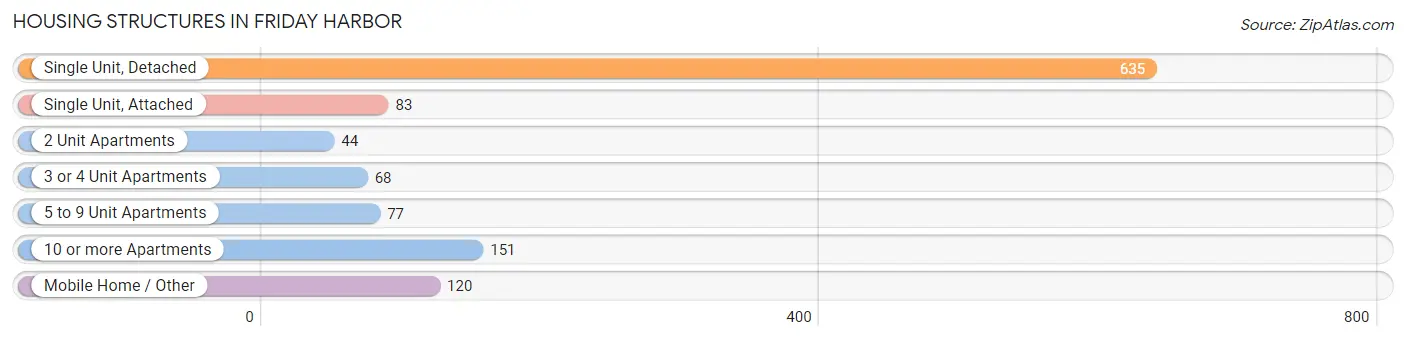
| Structure Type | # Housing Units | % Housing Units |
| Single Unit, Detached | 635 | 53.9% |
| Single Unit, Attached | 83 | 7.0% |
| 2 Unit Apartments | 44 | 3.7% |
| 3 or 4 Unit Apartments | 68 | 5.8% |
| 5 to 9 Unit Apartments | 77 | 6.5% |
| 10 or more Apartments | 151 | 12.8% |
| Mobile Home / Other | 120 | 10.2% |
| Total | 1,178 | 100.0% |
Housing Structures by Occupancy in Friday Harbor
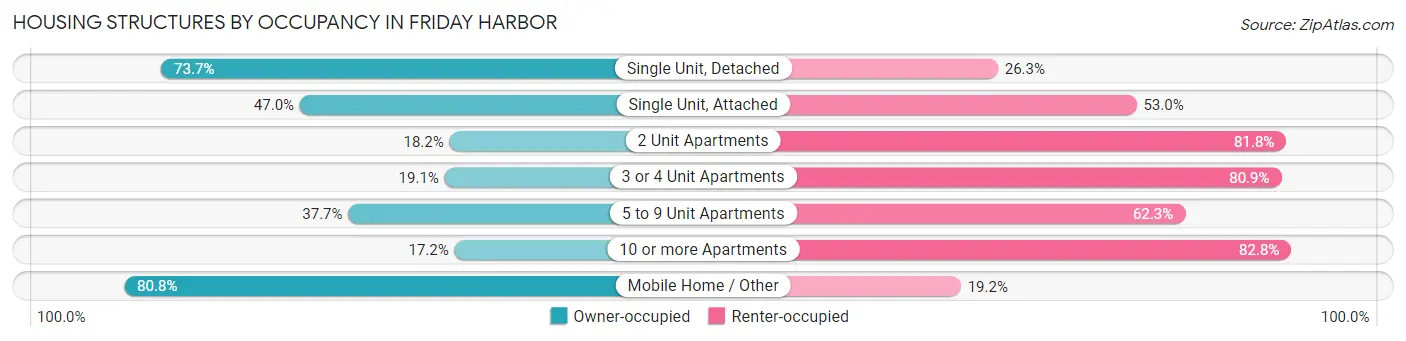
| Structure Type | Owner-occupied | Renter-occupied |
| Single Unit, Detached | 468 (73.7%) | 167 (26.3%) |
| Single Unit, Attached | 39 (47.0%) | 44 (53.0%) |
| 2 Unit Apartments | 8 (18.2%) | 36 (81.8%) |
| 3 or 4 Unit Apartments | 13 (19.1%) | 55 (80.9%) |
| 5 to 9 Unit Apartments | 29 (37.7%) | 48 (62.3%) |
| 10 or more Apartments | 26 (17.2%) | 125 (82.8%) |
| Mobile Home / Other | 97 (80.8%) | 23 (19.2%) |
| Total | 680 (57.7%) | 498 (42.3%) |
Housing Structures by Number of Rooms in Friday Harbor
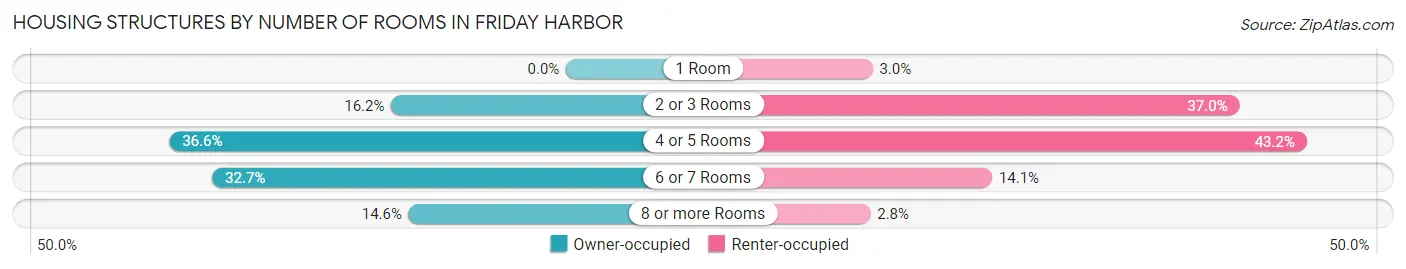
| Number of Rooms | Owner-occupied | Renter-occupied |
| 1 Room | 0 (0.0%) | 15 (3.0%) |
| 2 or 3 Rooms | 110 (16.2%) | 184 (36.9%) |
| 4 or 5 Rooms | 249 (36.6%) | 215 (43.2%) |
| 6 or 7 Rooms | 222 (32.7%) | 70 (14.1%) |
| 8 or more Rooms | 99 (14.6%) | 14 (2.8%) |
| Total | 680 (100.0%) | 498 (100.0%) |
Housing Structure by Heating Type in Friday Harbor
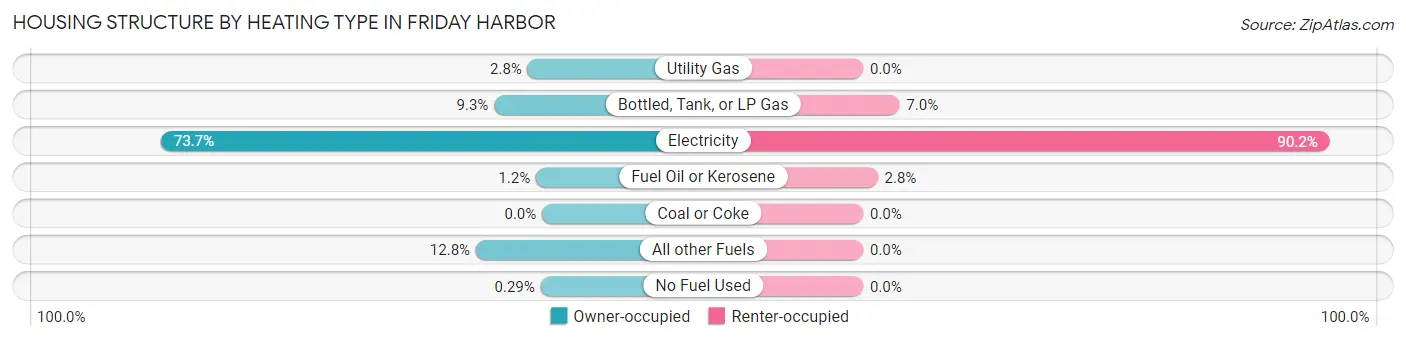
| Heating Type | Owner-occupied | Renter-occupied |
| Utility Gas | 19 (2.8%) | 0 (0.0%) |
| Bottled, Tank, or LP Gas | 63 (9.3%) | 35 (7.0%) |
| Electricity | 501 (73.7%) | 449 (90.2%) |
| Fuel Oil or Kerosene | 8 (1.2%) | 14 (2.8%) |
| Coal or Coke | 0 (0.0%) | 0 (0.0%) |
| All other Fuels | 87 (12.8%) | 0 (0.0%) |
| No Fuel Used | 2 (0.3%) | 0 (0.0%) |
| Total | 680 (100.0%) | 498 (100.0%) |
Household Vehicle Usage in Friday Harbor
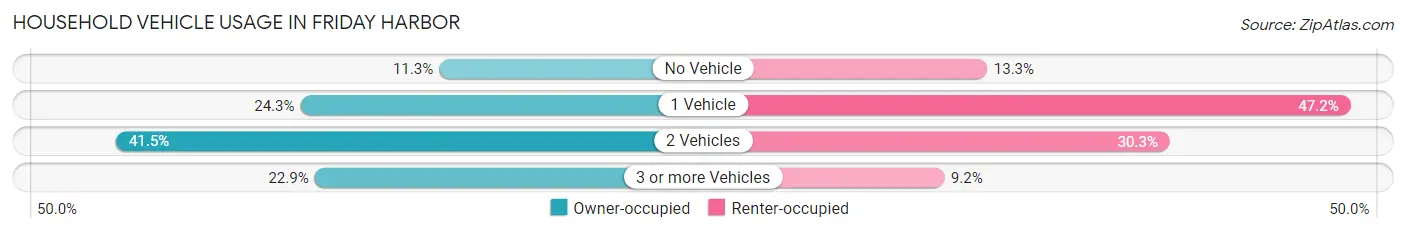
| Vehicles per Household | Owner-occupied | Renter-occupied |
| No Vehicle | 77 (11.3%) | 66 (13.3%) |
| 1 Vehicle | 165 (24.3%) | 235 (47.2%) |
| 2 Vehicles | 282 (41.5%) | 151 (30.3%) |
| 3 or more Vehicles | 156 (22.9%) | 46 (9.2%) |
| Total | 680 (100.0%) | 498 (100.0%) |
Real Estate & Mortgages in Friday Harbor
Real Estate and Mortgage Overview in Friday Harbor
| Characteristic | Without Mortgage | With Mortgage |
| Housing Units | 249 | 431 |
| Median Property Value | $408,700 | $514,100 |
| Median Household Income | $68,542 | $116 |
| Monthly Housing Costs | $680 | $54 |
| Real Estate Taxes | $2,593 | $13 |
Property Value by Mortgage Status in Friday Harbor
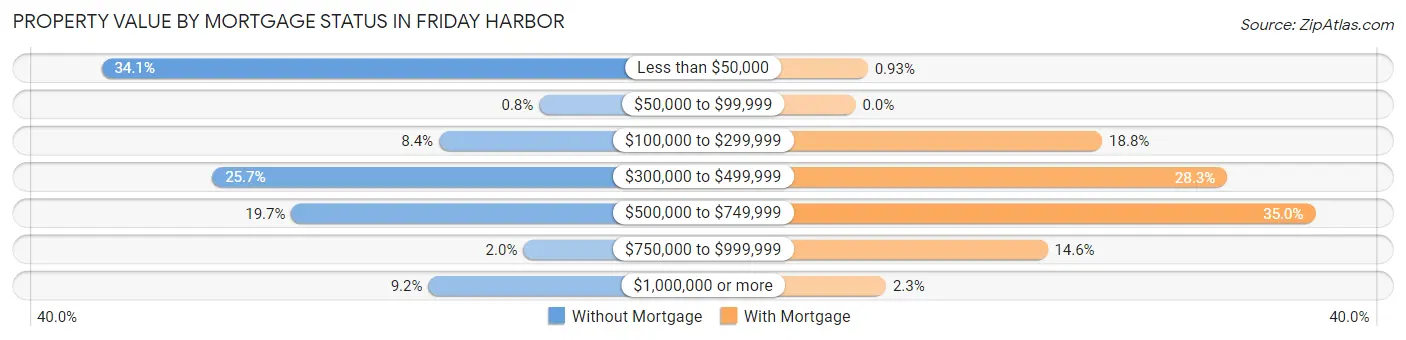
| Property Value | Without Mortgage | With Mortgage |
| Less than $50,000 | 85 (34.1%) | 4 (0.9%) |
| $50,000 to $99,999 | 2 (0.8%) | 0 (0.0%) |
| $100,000 to $299,999 | 21 (8.4%) | 81 (18.8%) |
| $300,000 to $499,999 | 64 (25.7%) | 122 (28.3%) |
| $500,000 to $749,999 | 49 (19.7%) | 151 (35.0%) |
| $750,000 to $999,999 | 5 (2.0%) | 63 (14.6%) |
| $1,000,000 or more | 23 (9.2%) | 10 (2.3%) |
| Total | 249 (100.0%) | 431 (100.0%) |
Household Income by Mortgage Status in Friday Harbor
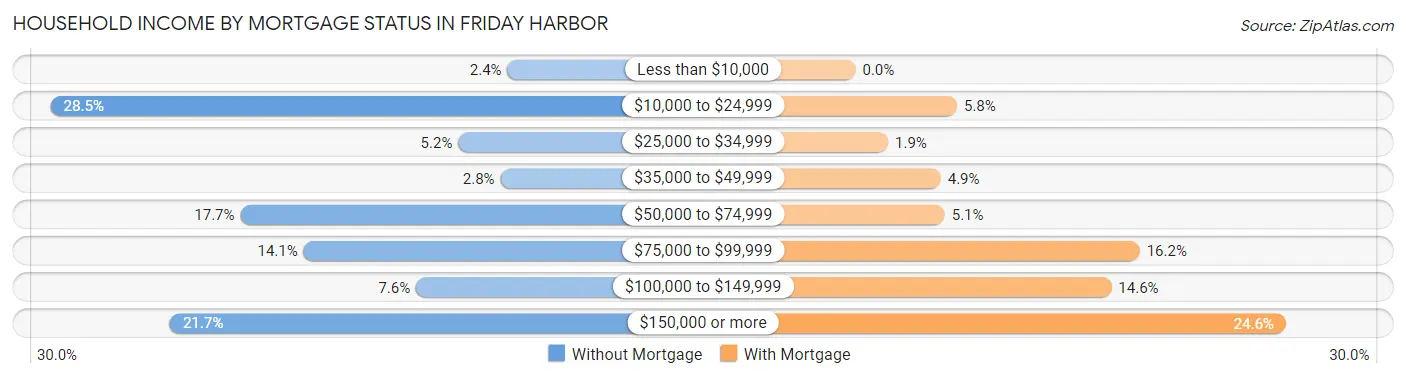
| Household Income | Without Mortgage | With Mortgage |
| Less than $10,000 | 6 (2.4%) | 0 (0.0%) |
| $10,000 to $24,999 | 71 (28.5%) | 25 (5.8%) |
| $25,000 to $34,999 | 13 (5.2%) | 8 (1.9%) |
| $35,000 to $49,999 | 7 (2.8%) | 21 (4.9%) |
| $50,000 to $74,999 | 44 (17.7%) | 22 (5.1%) |
| $75,000 to $99,999 | 35 (14.1%) | 70 (16.2%) |
| $100,000 to $149,999 | 19 (7.6%) | 63 (14.6%) |
| $150,000 or more | 54 (21.7%) | 106 (24.6%) |
| Total | 249 (100.0%) | 431 (100.0%) |
Property Value to Household Income Ratio in Friday Harbor
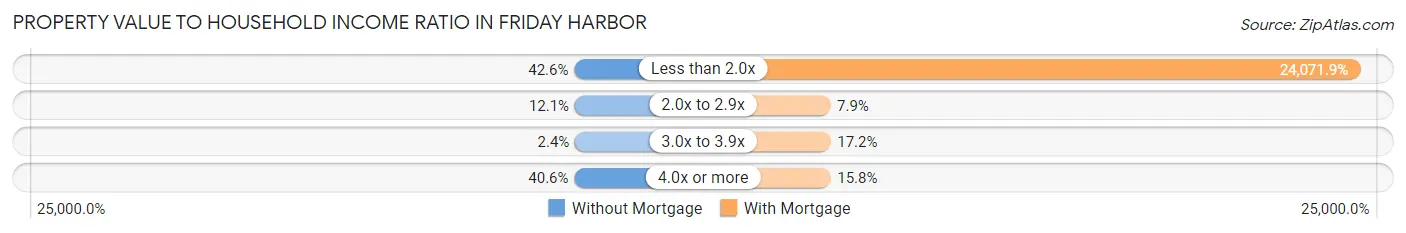
| Value-to-Income Ratio | Without Mortgage | With Mortgage |
| Less than 2.0x | 106 (42.6%) | 103,750 (24,071.9%) |
| 2.0x to 2.9x | 30 (12.0%) | 34 (7.9%) |
| 3.0x to 3.9x | 6 (2.4%) | 74 (17.2%) |
| 4.0x or more | 101 (40.6%) | 68 (15.8%) |
| Total | 249 (100.0%) | 431 (100.0%) |
Real Estate Taxes by Mortgage Status in Friday Harbor
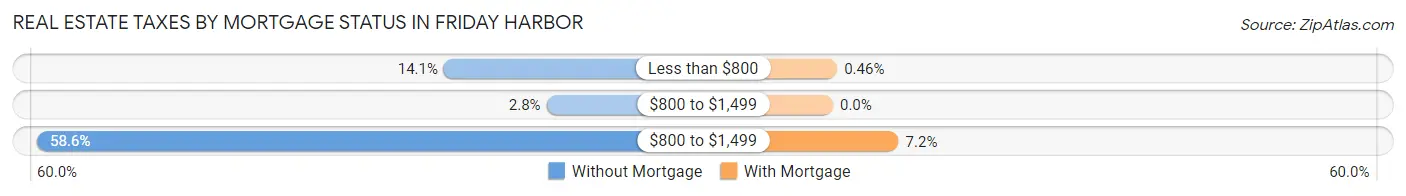
| Property Taxes | Without Mortgage | With Mortgage |
| Less than $800 | 35 (14.1%) | 2 (0.5%) |
| $800 to $1,499 | 7 (2.8%) | 0 (0.0%) |
| $800 to $1,499 | 146 (58.6%) | 31 (7.2%) |
| Total | 249 (100.0%) | 431 (100.0%) |
Health & Disability in Friday Harbor
Health Insurance Coverage by Age in Friday Harbor
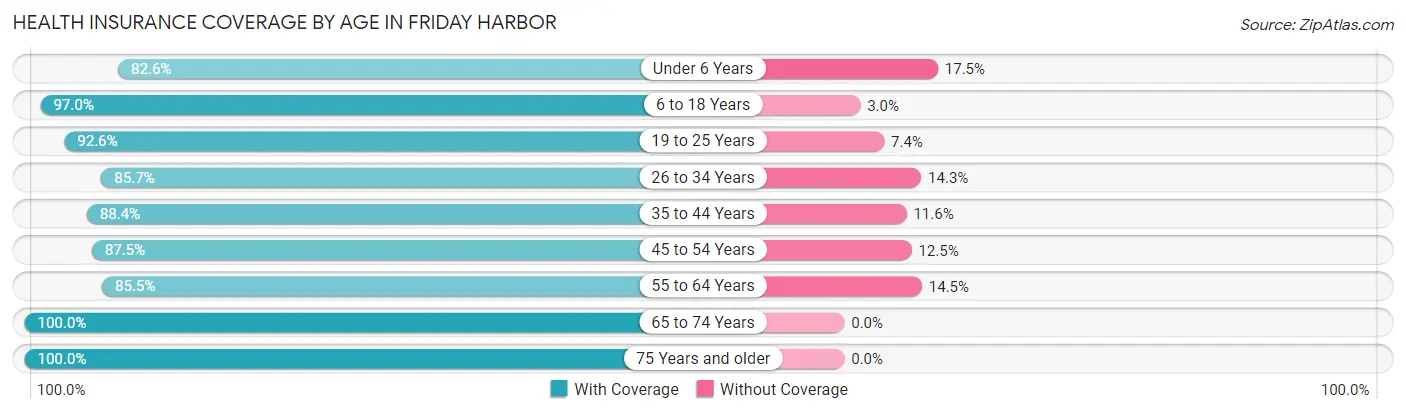
| Age Bracket | With Coverage | Without Coverage |
| Under 6 Years | 123 (82.6%) | 26 (17.4%) |
| 6 to 18 Years | 424 (97.0%) | 13 (3.0%) |
| 19 to 25 Years | 212 (92.6%) | 17 (7.4%) |
| 26 to 34 Years | 281 (85.7%) | 47 (14.3%) |
| 35 to 44 Years | 282 (88.4%) | 37 (11.6%) |
| 45 to 54 Years | 335 (87.5%) | 48 (12.5%) |
| 55 to 64 Years | 278 (85.5%) | 47 (14.5%) |
| 65 to 74 Years | 275 (100.0%) | 0 (0.0%) |
| 75 Years and older | 152 (100.0%) | 0 (0.0%) |
| Total | 2,362 (90.9%) | 235 (9.0%) |
Health Insurance Coverage by Citizenship Status in Friday Harbor
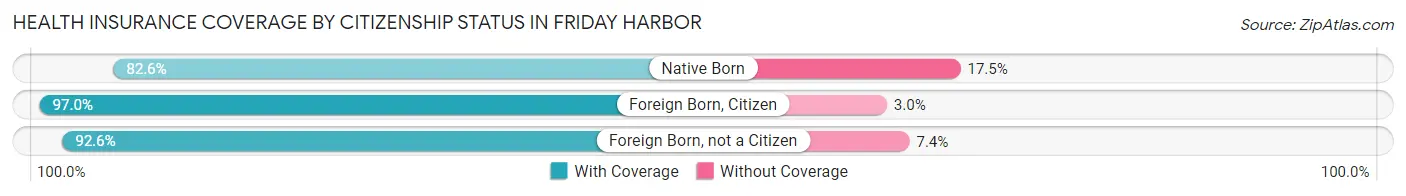
| Citizenship Status | With Coverage | Without Coverage |
| Native Born | 123 (82.6%) | 26 (17.4%) |
| Foreign Born, Citizen | 424 (97.0%) | 13 (3.0%) |
| Foreign Born, not a Citizen | 212 (92.6%) | 17 (7.4%) |
Health Insurance Coverage by Household Income in Friday Harbor
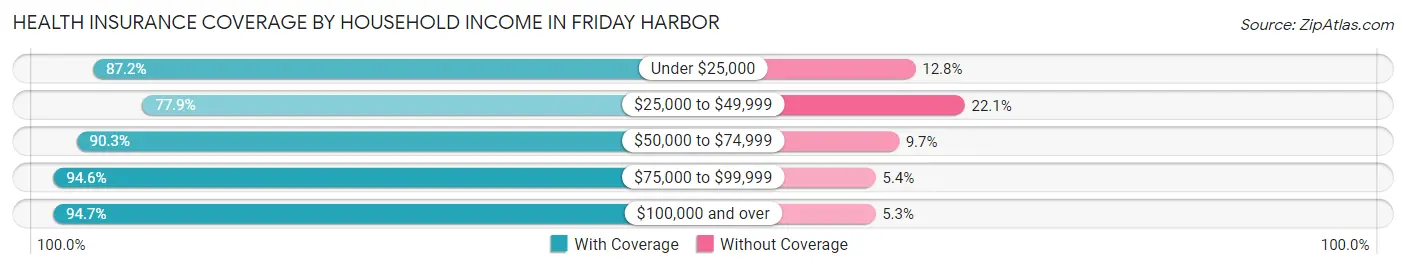
| Household Income | With Coverage | Without Coverage |
| Under $25,000 | 333 (87.2%) | 49 (12.8%) |
| $25,000 to $49,999 | 219 (77.9%) | 62 (22.1%) |
| $50,000 to $74,999 | 464 (90.3%) | 50 (9.7%) |
| $75,000 to $99,999 | 369 (94.6%) | 21 (5.4%) |
| $100,000 and over | 942 (94.7%) | 53 (5.3%) |
Public vs Private Health Insurance Coverage by Age in Friday Harbor
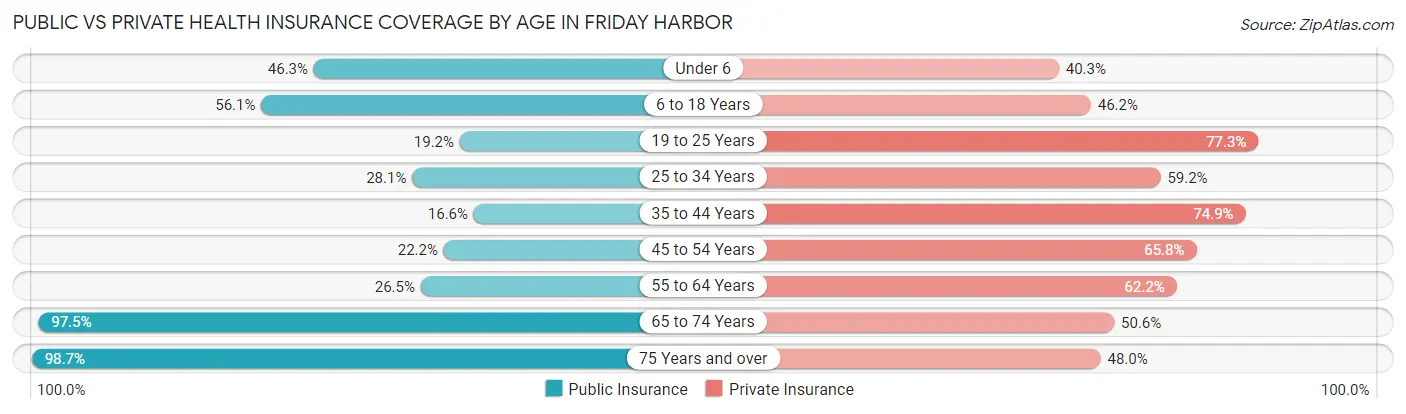
| Age Bracket | Public Insurance | Private Insurance |
| Under 6 | 69 (46.3%) | 60 (40.3%) |
| 6 to 18 Years | 245 (56.1%) | 202 (46.2%) |
| 19 to 25 Years | 44 (19.2%) | 177 (77.3%) |
| 25 to 34 Years | 92 (28.1%) | 194 (59.2%) |
| 35 to 44 Years | 53 (16.6%) | 239 (74.9%) |
| 45 to 54 Years | 85 (22.2%) | 252 (65.8%) |
| 55 to 64 Years | 86 (26.5%) | 202 (62.2%) |
| 65 to 74 Years | 268 (97.5%) | 139 (50.5%) |
| 75 Years and over | 150 (98.7%) | 73 (48.0%) |
| Total | 1,092 (42.0%) | 1,538 (59.2%) |
Disability Status by Sex by Age in Friday Harbor
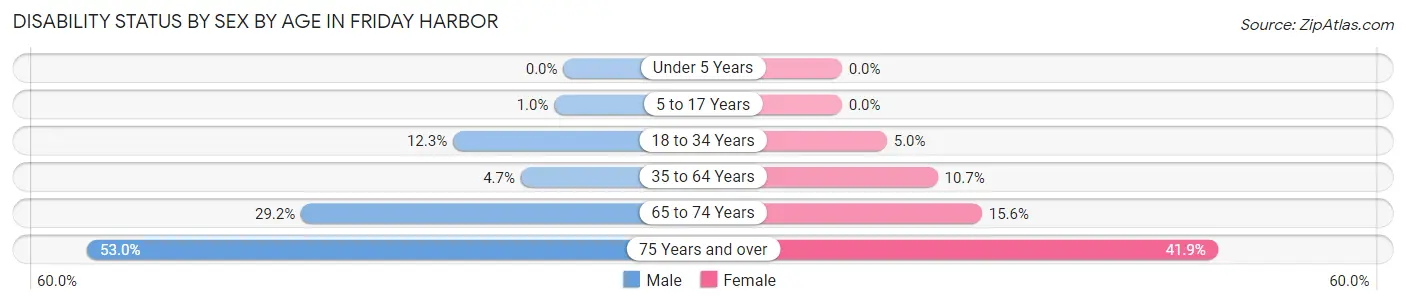
| Age Bracket | Male | Female |
| Under 5 Years | 0 (0.0%) | 0 (0.0%) |
| 5 to 17 Years | 2 (1.0%) | 0 (0.0%) |
| 18 to 34 Years | 29 (12.3%) | 18 (5.0%) |
| 35 to 64 Years | 22 (4.7%) | 60 (10.7%) |
| 65 to 74 Years | 26 (29.2%) | 29 (15.6%) |
| 75 Years and over | 35 (53.0%) | 36 (41.9%) |
Disability Class by Sex by Age in Friday Harbor
Disability Class: Hearing Difficulty
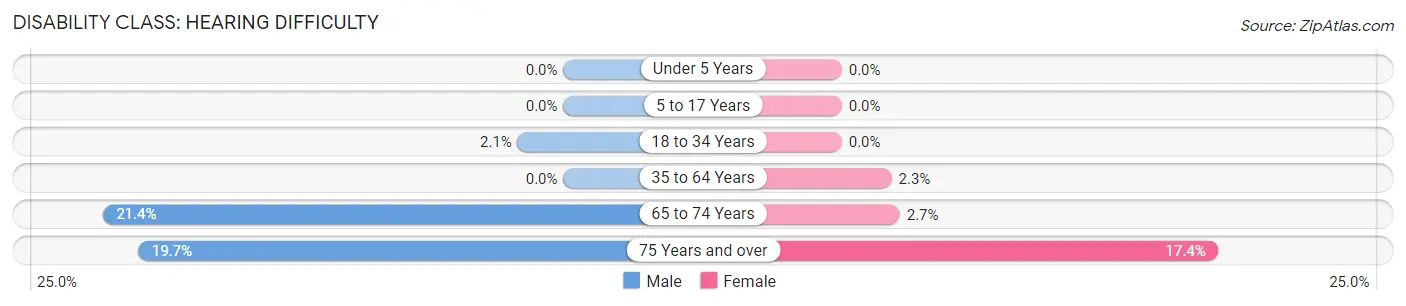
| Age Bracket | Male | Female |
| Under 5 Years | 0 (0.0%) | 0 (0.0%) |
| 5 to 17 Years | 0 (0.0%) | 0 (0.0%) |
| 18 to 34 Years | 5 (2.1%) | 0 (0.0%) |
| 35 to 64 Years | 0 (0.0%) | 13 (2.3%) |
| 65 to 74 Years | 19 (21.3%) | 5 (2.7%) |
| 75 Years and over | 13 (19.7%) | 15 (17.4%) |
Disability Class: Vision Difficulty
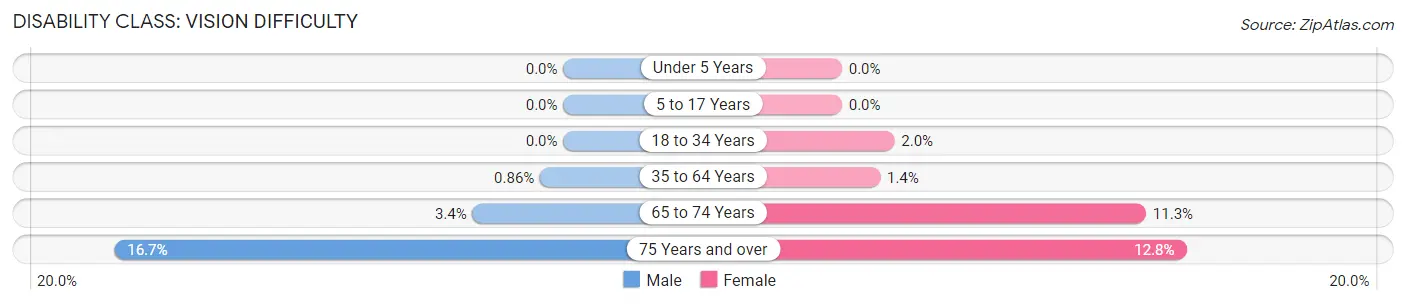
| Age Bracket | Male | Female |
| Under 5 Years | 0 (0.0%) | 0 (0.0%) |
| 5 to 17 Years | 0 (0.0%) | 0 (0.0%) |
| 18 to 34 Years | 0 (0.0%) | 7 (1.9%) |
| 35 to 64 Years | 4 (0.9%) | 8 (1.4%) |
| 65 to 74 Years | 3 (3.4%) | 21 (11.3%) |
| 75 Years and over | 11 (16.7%) | 11 (12.8%) |
Disability Class: Cognitive Difficulty
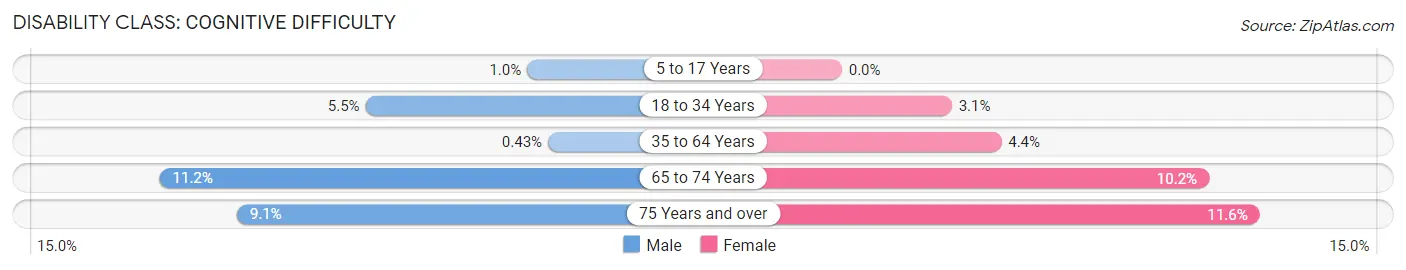
| Age Bracket | Male | Female |
| 5 to 17 Years | 2 (1.0%) | 0 (0.0%) |
| 18 to 34 Years | 13 (5.5%) | 11 (3.1%) |
| 35 to 64 Years | 2 (0.4%) | 25 (4.4%) |
| 65 to 74 Years | 10 (11.2%) | 19 (10.2%) |
| 75 Years and over | 6 (9.1%) | 10 (11.6%) |
Disability Class: Ambulatory Difficulty
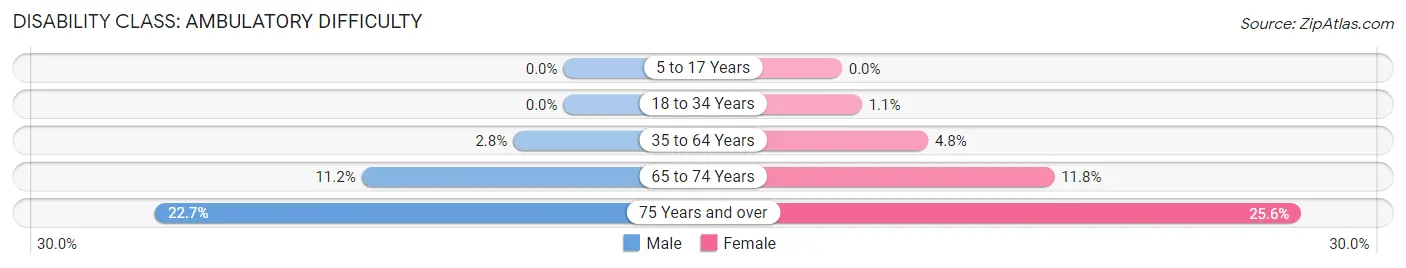
| Age Bracket | Male | Female |
| 5 to 17 Years | 0 (0.0%) | 0 (0.0%) |
| 18 to 34 Years | 0 (0.0%) | 4 (1.1%) |
| 35 to 64 Years | 13 (2.8%) | 27 (4.8%) |
| 65 to 74 Years | 10 (11.2%) | 22 (11.8%) |
| 75 Years and over | 15 (22.7%) | 22 (25.6%) |
Disability Class: Self-Care Difficulty
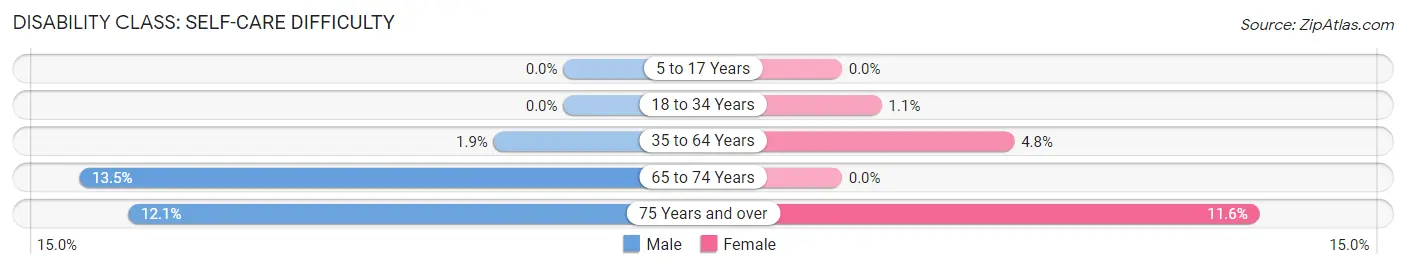
| Age Bracket | Male | Female |
| 5 to 17 Years | 0 (0.0%) | 0 (0.0%) |
| 18 to 34 Years | 0 (0.0%) | 4 (1.1%) |
| 35 to 64 Years | 9 (1.9%) | 27 (4.8%) |
| 65 to 74 Years | 12 (13.5%) | 0 (0.0%) |
| 75 Years and over | 8 (12.1%) | 10 (11.6%) |
Technology Access in Friday Harbor
Computing Device Access in Friday Harbor
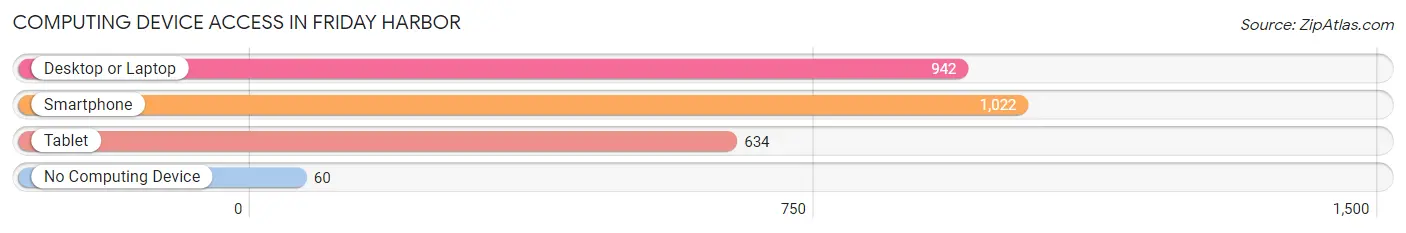
| Device Type | # Households | % Households |
| Desktop or Laptop | 942 | 80.0% |
| Smartphone | 1,022 | 86.8% |
| Tablet | 634 | 53.8% |
| No Computing Device | 60 | 5.1% |
| Total | 1,178 | 100.0% |
Internet Access in Friday Harbor
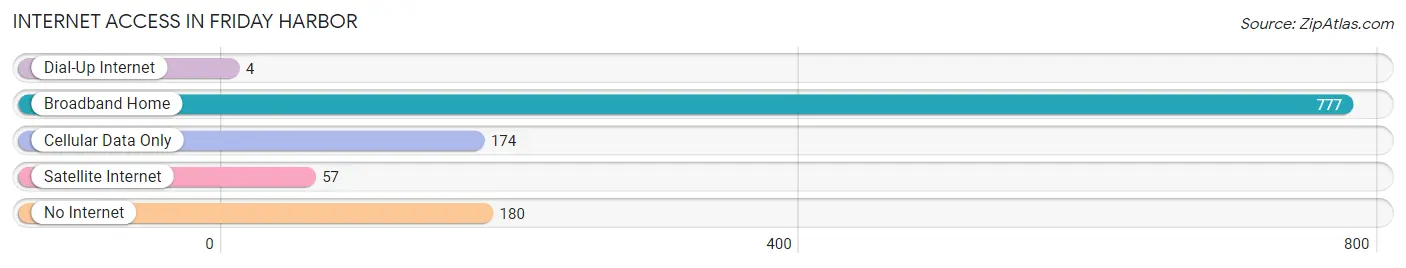
| Internet Type | # Households | % Households |
| Dial-Up Internet | 4 | 0.3% |
| Broadband Home | 777 | 66.0% |
| Cellular Data Only | 174 | 14.8% |
| Satellite Internet | 57 | 4.8% |
| No Internet | 180 | 15.3% |
| Total | 1,178 | 100.0% |
Friday Harbor Summary
Introduction
Friday Harbor is a small town located on San Juan Island in the San Juan Islands archipelago of Washington State. It is the county seat of San Juan County and the only incorporated town in the archipelago. The town is known for its picturesque harbor, its vibrant arts and culture scene, and its proximity to the stunning natural beauty of the San Juan Islands.
History
The first known inhabitants of the San Juan Islands were the Coast Salish people, who lived in the area for thousands of years before the arrival of Europeans. The first Europeans to explore the area were Spanish explorers, who arrived in 1791. The first permanent settlement in the area was established in 1853 by the Hudson’s Bay Company, which established a trading post at what is now Friday Harbor. The town was named after Joseph Poalie Friday, a Hawaiian sailor who was the first to settle in the area.
In 1859, the San Juan Islands were the site of the Pig War, a dispute between the United States and Great Britain over the ownership of the islands. The dispute was eventually resolved in 1872, when the islands were declared to be part of the United States.
In the late 19th century, the town of Friday Harbor began to grow as a fishing and logging center. In the early 20th century, the town became a popular tourist destination, and the population began to grow. In 1965, the town was officially incorporated as a town.
Geography
Friday Harbor is located on San Juan Island, the second-largest island in the San Juan Islands archipelago. The town is situated on the eastern shore of the island, at the entrance to San Juan Channel. The town is surrounded by the waters of the Salish Sea, which is part of the Pacific Ocean.
The town of Friday Harbor covers an area of 2.3 square miles, and has a population of 2,162 people, as of the 2010 census. The town is located in a temperate rainforest climate, with mild temperatures and abundant rainfall throughout the year.
Economy
The economy of Friday Harbor is largely based on tourism and fishing. The town is a popular destination for tourists, who come to enjoy the natural beauty of the San Juan Islands and the vibrant arts and culture scene of the town. The town is also home to a number of fishing fleets, which provide fresh seafood to the local restaurants and markets.
The town is also home to a number of businesses, including restaurants, shops, galleries, and hotels. The town is also home to a number of government offices, including the San Juan County Courthouse and the San Juan County Sheriff’s Office.
Demographics
As of the 2010 census, the population of Friday Harbor was 2,162 people, with a population density of 930 people per square mile. The median age of the population was 48.7 years, and the median household income was $50,945.
The racial makeup of the town was 94.2% White, 0.7% African American, 0.7% Native American, 1.2% Asian, 0.2% Pacific Islander, 0.7% from other races, and 2.1% from two or more races. Hispanic or Latino of any race were 3.2% of the population.
Conclusion
Friday Harbor is a small town located on San Juan Island in the San Juan Islands archipelago of Washington State. The town is known for its picturesque harbor, its vibrant arts and culture scene, and its proximity to the stunning natural beauty of the San Juan Islands. The economy of the town is largely based on tourism and fishing, and the population is largely white and middle-aged. Friday Harbor is a popular destination for tourists, and is a great place to visit for those looking to experience the beauty and culture of the San Juan Islands.
Common Questions
What is Per Capita Income in Friday Harbor?
Per Capita income in Friday Harbor is $40,906.
What is the Median Family Income in Friday Harbor?
Median Family Income in Friday Harbor is $88,125.
What is the Median Household income in Friday Harbor?
Median Household Income in Friday Harbor is $62,300.
What is Income or Wage Gap in Friday Harbor?
Income or Wage Gap in Friday Harbor is 41.8%.
Women in Friday Harbor earn 58.2 cents for every dollar earned by a man.
What is Family Income Deficit in Friday Harbor?
Family Income Deficit in Friday Harbor is $14,730.
Families that are below poverty line in Friday Harbor earn $14,730 less on average than the poverty threshold level.
What is Inequality or Gini Index in Friday Harbor?
Inequality or Gini Index in Friday Harbor is 0.50.
What is the Total Population of Friday Harbor?
Total Population of Friday Harbor is 2,647.
What is the Total Male Population of Friday Harbor?
Total Male Population of Friday Harbor is 1,104.
What is the Total Female Population of Friday Harbor?
Total Female Population of Friday Harbor is 1,543.
What is the Ratio of Males per 100 Females in Friday Harbor?
There are 71.55 Males per 100 Females in Friday Harbor.
What is the Ratio of Females per 100 Males in Friday Harbor?
There are 139.76 Females per 100 Males in Friday Harbor.
What is the Median Population Age in Friday Harbor?
Median Population Age in Friday Harbor is 40.9 Years.
What is the Average Family Size in Friday Harbor
Average Family Size in Friday Harbor is 2.9 People.
What is the Average Household Size in Friday Harbor
Average Household Size in Friday Harbor is 2.2 People.
How Large is the Labor Force in Friday Harbor?
There are 1,473 People in the Labor Forcein in Friday Harbor.
What is the Percentage of People in the Labor Force in Friday Harbor?
68.2% of People are in the Labor Force in Friday Harbor.
What is the Unemployment Rate in Friday Harbor?
Unemployment Rate in Friday Harbor is 2.7%.