Zip Codes with the Highest Percentage of Population Employed in Real Estate, Rental & Leasing in Puyallup, WA
RELATED REPORTS & OPTIONS
Real Estate, Rental & Leasing
Puyallup
Compare Zip Codes
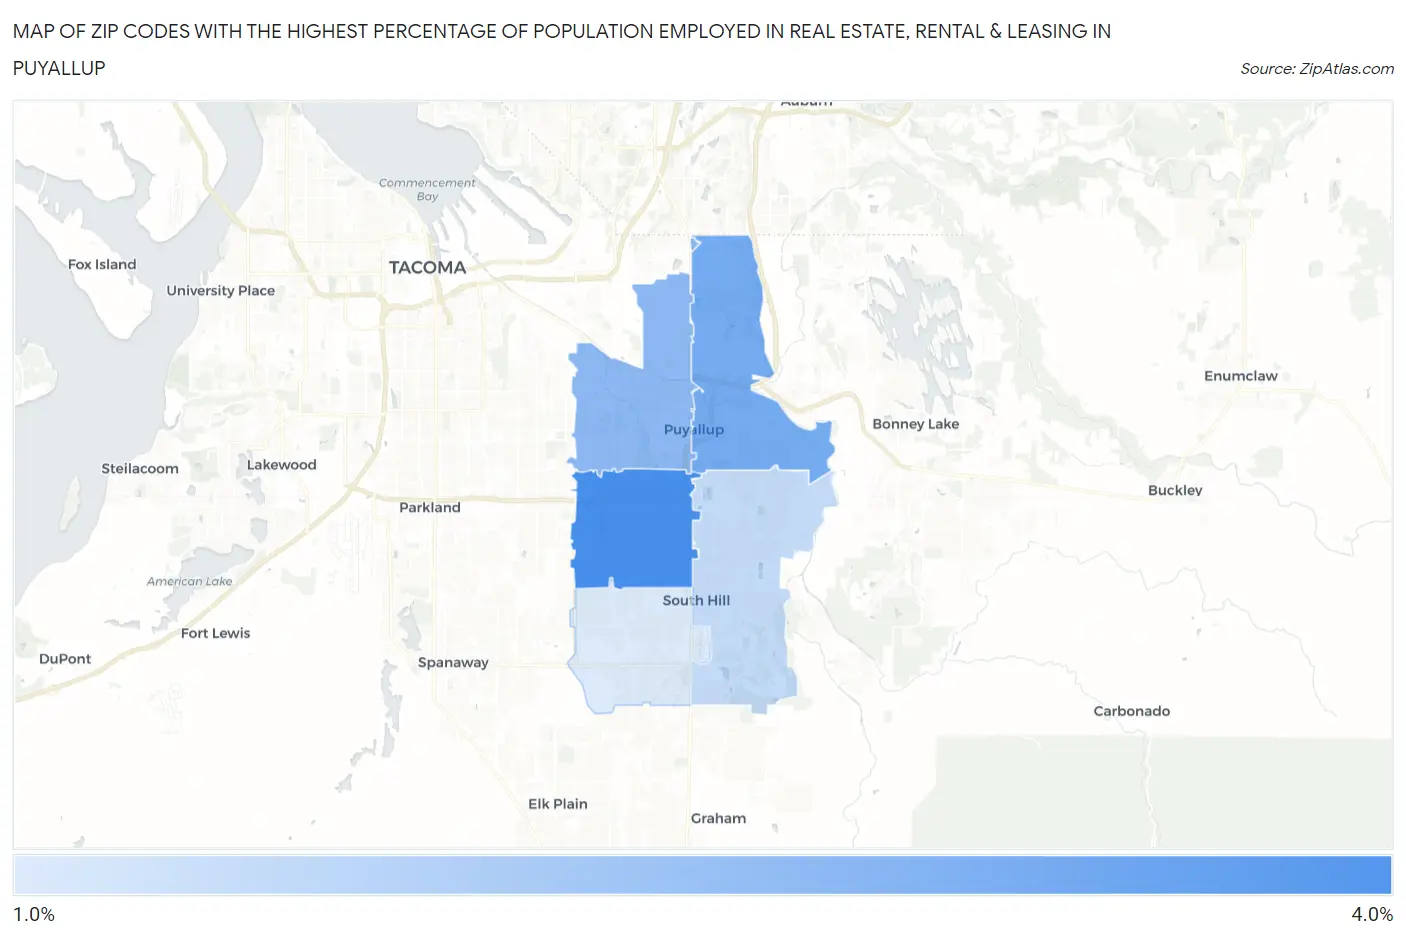
Map of Zip Codes with the Highest Percentage of Population Employed in Real Estate, Rental & Leasing in Puyallup
1.7%
3.2%
Zip Codes with the Highest Percentage of Population Employed in Real Estate, Rental & Leasing in Puyallup, WA
| Zip Code | % Employed | vs State | vs National | |
| 1. | 98373 | 3.2% | 2.1%(+1.06)#83 | 1.9%(+1.27)#3,497 |
| 2. | 98372 | 2.7% | 2.1%(+0.594)#122 | 1.9%(+0.799)#4,779 |
| 3. | 98371 | 2.5% | 2.1%(+0.371)#155 | 1.9%(+0.576)#5,602 |
| 4. | 98374 | 1.9% | 2.1%(-0.163)#232 | 1.9%(+0.043)#8,221 |
| 5. | 98375 | 1.7% | 2.1%(-0.423)#276 | 1.9%(-0.218)#9,947 |
1
Common Questions
What are the Top 3 Zip Codes with the Highest Percentage of Population Employed in Real Estate, Rental & Leasing in Puyallup, WA?
Top 3 Zip Codes with the Highest Percentage of Population Employed in Real Estate, Rental & Leasing in Puyallup, WA are:
What zip code has the Highest Percentage of Population Employed in Real Estate, Rental & Leasing in Puyallup, WA?
98373 has the Highest Percentage of Population Employed in Real Estate, Rental & Leasing in Puyallup, WA with 3.2%.
What is the Percentage of Population Employed in Real Estate, Rental & Leasing in Puyallup, WA?
Percentage of Population Employed in Real Estate, Rental & Leasing in Puyallup is 2.4%.
What is the Percentage of Population Employed in Real Estate, Rental & Leasing in Washington?
Percentage of Population Employed in Real Estate, Rental & Leasing in Washington is 2.1%.
What is the Percentage of Population Employed in Real Estate, Rental & Leasing in the United States?
Percentage of Population Employed in Real Estate, Rental & Leasing in the United States is 1.9%.