Hazel Dell, WA Map & Demographics
Hazel Dell Map
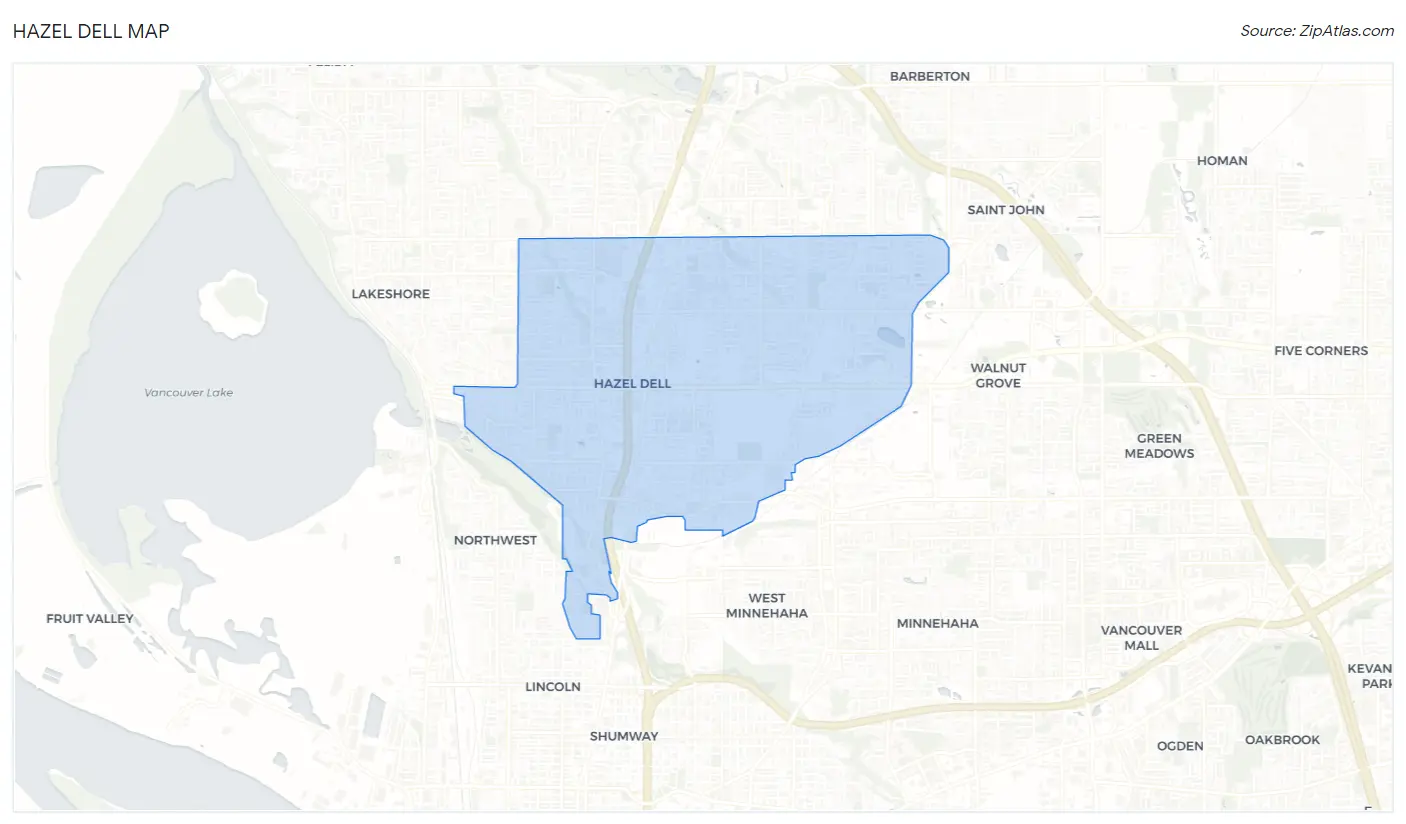
Hazel Dell Overview
$36,839
PER CAPITA INCOME
$82,802
AVG FAMILY INCOME
$72,299
AVG HOUSEHOLD INCOME
26.8%
WAGE / INCOME GAP [ % ]
73.2¢/ $1
WAGE / INCOME GAP [ $ ]
0.40
INEQUALITY / GINI INDEX
22,714
TOTAL POPULATION
11,178
MALE POPULATION
11,536
FEMALE POPULATION
96.90
MALES / 100 FEMALES
103.20
FEMALES / 100 MALES
38.0
MEDIAN AGE
2.9
AVG FAMILY SIZE
2.4
AVG HOUSEHOLD SIZE
12,469
LABOR FORCE [ PEOPLE ]
65.9%
PERCENT IN LABOR FORCE
7.7%
UNEMPLOYMENT RATE
Income in Hazel Dell
Income Overview in Hazel Dell
Per Capita Income in Hazel Dell is $36,839, while median incomes of families and households are $82,802 and $72,299 respectively.
| Characteristic | Number | Measure |
| Per Capita Income | 22,714 | $36,839 |
| Median Family Income | 5,650 | $82,802 |
| Mean Family Income | 5,650 | $95,519 |
| Median Household Income | 9,533 | $72,299 |
| Mean Household Income | 9,533 | $86,270 |
| Income Deficit | 5,650 | $0 |
| Wage / Income Gap (%) | 22,714 | 26.77% |
| Wage / Income Gap ($) | 22,714 | 73.23¢ per $1 |
| Gini / Inequality Index | 22,714 | 0.40 |
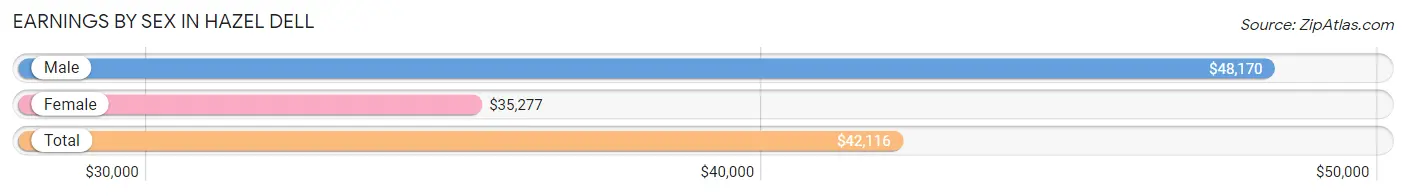
Earnings by Sex in Hazel Dell
Average Earnings in Hazel Dell are $42,116, $48,170 for men and $35,277 for women, a difference of 26.8%.
| Sex | Number | Average Earnings |
| Male | 7,235 (55.6%) | $48,170 |
| Female | 5,781 (44.4%) | $35,277 |
| Total | 13,016 (100.0%) | $42,116 |
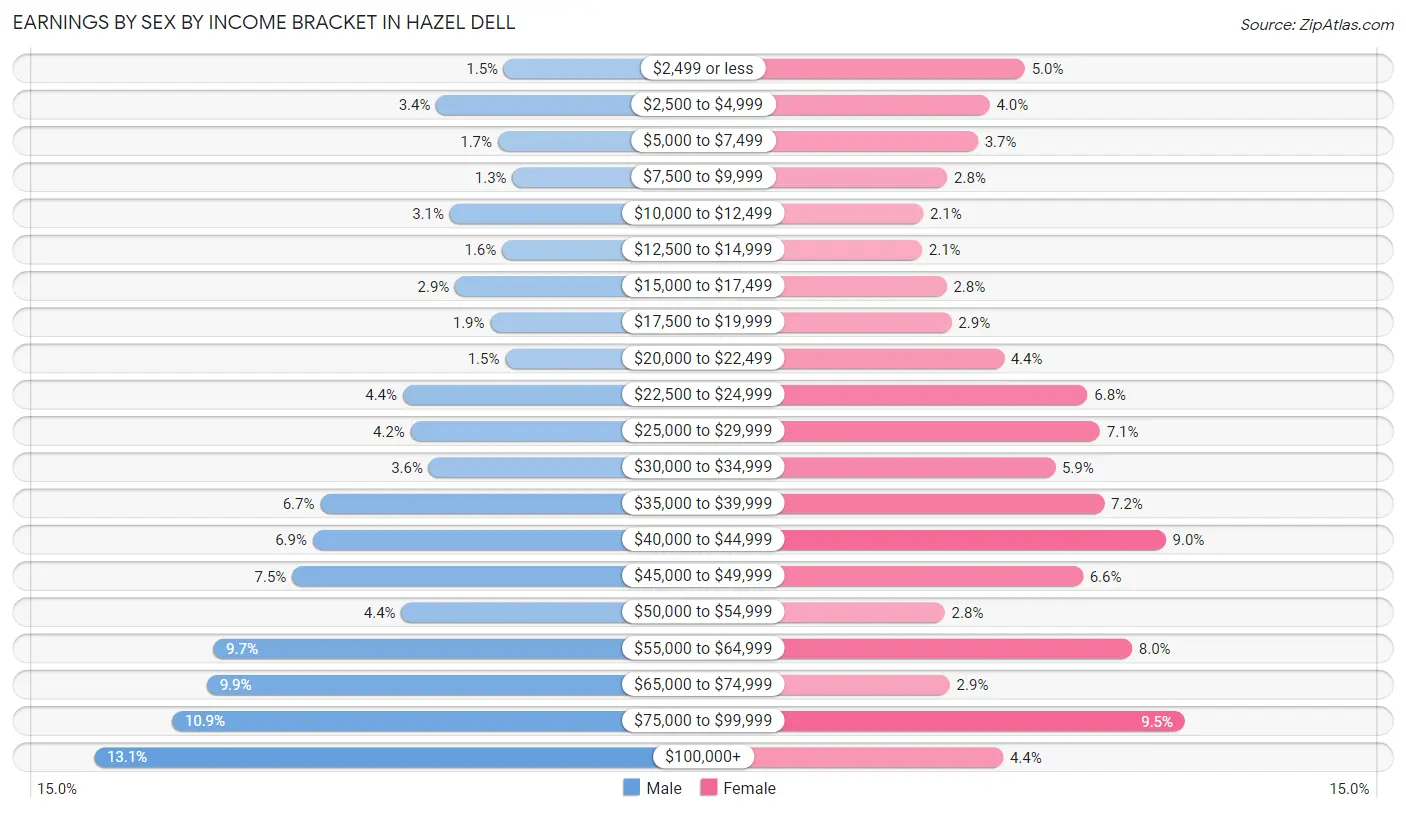
Earnings by Sex by Income Bracket in Hazel Dell
The most common earnings brackets in Hazel Dell are $100,000+ for men (944 | 13.1%) and $75,000 to $99,999 for women (549 | 9.5%).
| Income | Male | Female |
| $2,499 or less | 111 (1.5%) | 289 (5.0%) |
| $2,500 to $4,999 | 248 (3.4%) | 232 (4.0%) |
| $5,000 to $7,499 | 123 (1.7%) | 213 (3.7%) |
| $7,500 to $9,999 | 93 (1.3%) | 163 (2.8%) |
| $10,000 to $12,499 | 221 (3.0%) | 124 (2.1%) |
| $12,500 to $14,999 | 114 (1.6%) | 122 (2.1%) |
| $15,000 to $17,499 | 210 (2.9%) | 162 (2.8%) |
| $17,500 to $19,999 | 138 (1.9%) | 170 (2.9%) |
| $20,000 to $22,499 | 108 (1.5%) | 255 (4.4%) |
| $22,500 to $24,999 | 316 (4.4%) | 391 (6.8%) |
| $25,000 to $29,999 | 300 (4.2%) | 411 (7.1%) |
| $30,000 to $34,999 | 263 (3.6%) | 338 (5.9%) |
| $35,000 to $39,999 | 484 (6.7%) | 418 (7.2%) |
| $40,000 to $44,999 | 499 (6.9%) | 518 (9.0%) |
| $45,000 to $49,999 | 541 (7.5%) | 383 (6.6%) |
| $50,000 to $54,999 | 319 (4.4%) | 159 (2.8%) |
| $55,000 to $64,999 | 702 (9.7%) | 463 (8.0%) |
| $65,000 to $74,999 | 715 (9.9%) | 167 (2.9%) |
| $75,000 to $99,999 | 786 (10.9%) | 549 (9.5%) |
| $100,000+ | 944 (13.1%) | 254 (4.4%) |
| Total | 7,235 (100.0%) | 5,781 (100.0%) |
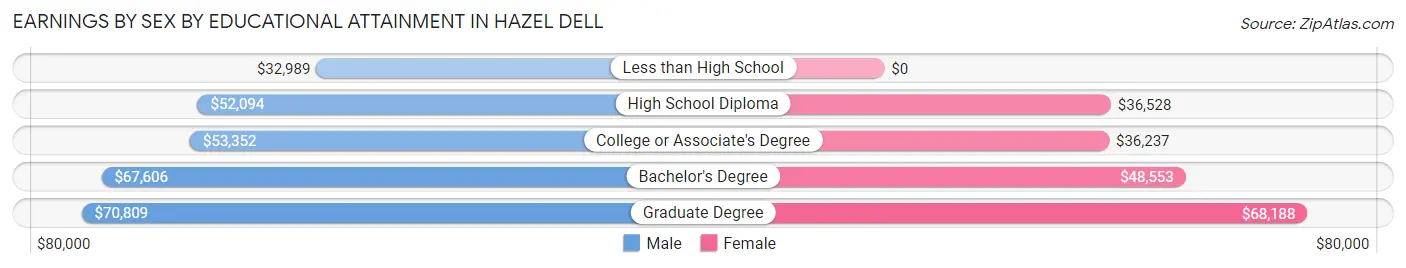
Earnings by Sex by Educational Attainment in Hazel Dell
Average earnings in Hazel Dell are $54,401 for men and $39,500 for women, a difference of 27.4%. Men with an educational attainment of graduate degree enjoy the highest average annual earnings of $70,809, while those with less than high school education earn the least with $32,989. Women with an educational attainment of graduate degree earn the most with the average annual earnings of $68,188, while those with college or associate's degree education have the smallest earnings of $36,237.
| Educational Attainment | Male Income | Female Income |
| Less than High School | $32,989 | $0 |
| High School Diploma | $52,094 | $36,528 |
| College or Associate's Degree | $53,352 | $36,237 |
| Bachelor's Degree | $67,606 | $48,553 |
| Graduate Degree | $70,809 | $68,188 |
| Total | $54,401 | $39,500 |
Family Income in Hazel Dell
Family Income Brackets in Hazel Dell
According to the Hazel Dell family income data, there are 1,384 families falling into the $100,000 to $149,999 income range, which is the most common income bracket and makes up 24.5% of all families. Conversely, the $10,000 to $14,999 income bracket is the least frequent group with only 90 families (1.6%) belonging to this category.
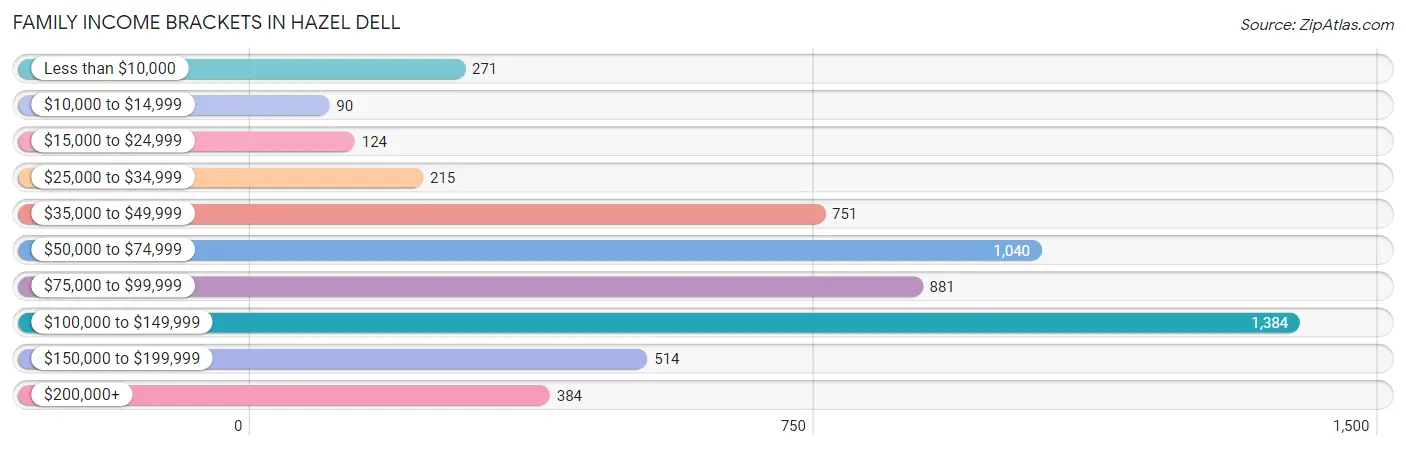
| Income Bracket | # Families | % Families |
| Less than $10,000 | 271 | 4.8% |
| $10,000 to $14,999 | 90 | 1.6% |
| $15,000 to $24,999 | 124 | 2.2% |
| $25,000 to $34,999 | 215 | 3.8% |
| $35,000 to $49,999 | 751 | 13.3% |
| $50,000 to $74,999 | 1,040 | 18.4% |
| $75,000 to $99,999 | 881 | 15.6% |
| $100,000 to $149,999 | 1,384 | 24.5% |
| $150,000 to $199,999 | 514 | 9.1% |
| $200,000+ | 384 | 6.8% |
Family Income by Famaliy Size in Hazel Dell
5-person families (327 | 5.8%) account for the highest median family income in Hazel Dell with $112,404 per family, while 2-person families (2,859 | 50.6%) have the highest median income of $36,336 per family member.
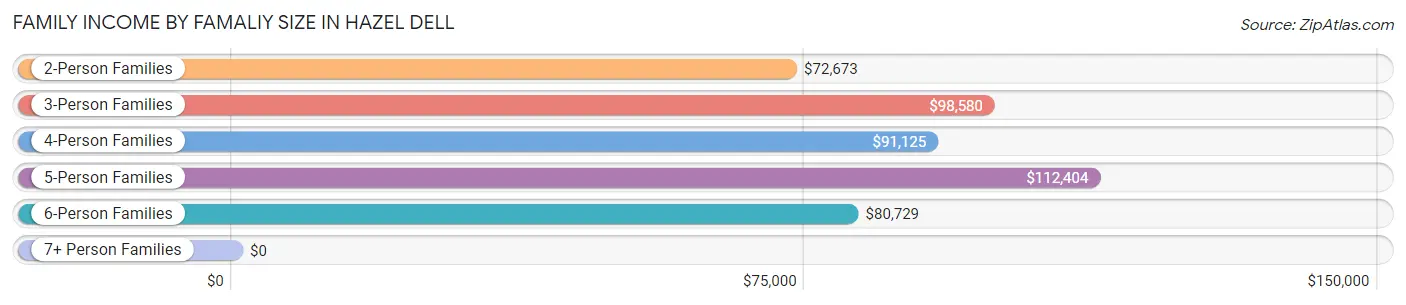
| Income Bracket | # Families | Median Income |
| 2-Person Families | 2,859 (50.6%) | $72,673 |
| 3-Person Families | 1,309 (23.2%) | $98,580 |
| 4-Person Families | 995 (17.6%) | $91,125 |
| 5-Person Families | 327 (5.8%) | $112,404 |
| 6-Person Families | 156 (2.8%) | $80,729 |
| 7+ Person Families | 4 (0.1%) | $0 |
| Total | 5,650 (100.0%) | $82,802 |
Family Income by Number of Earners in Hazel Dell
The median family income in Hazel Dell is $82,802, with families comprising 3+ earners (627) having the highest median family income of $158,693, while families with 1 earner (2,092) have the lowest median family income of $58,250, accounting for 11.1% and 37.0% of families, respectively.
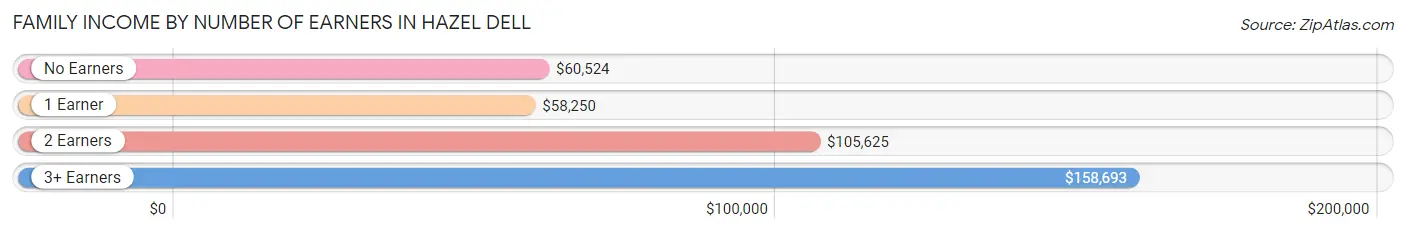
| Number of Earners | # Families | Median Income |
| No Earners | 677 (12.0%) | $60,524 |
| 1 Earner | 2,092 (37.0%) | $58,250 |
| 2 Earners | 2,254 (39.9%) | $105,625 |
| 3+ Earners | 627 (11.1%) | $158,693 |
| Total | 5,650 (100.0%) | $82,802 |
Household Income in Hazel Dell
Household Income Brackets in Hazel Dell
With 1,897 households falling in the category, the $100,000 to $149,999 income range is the most frequent in Hazel Dell, accounting for 19.9% of all households. In contrast, only 400 households (4.2%) fall into the $10,000 to $14,999 income bracket, making it the least populous group.
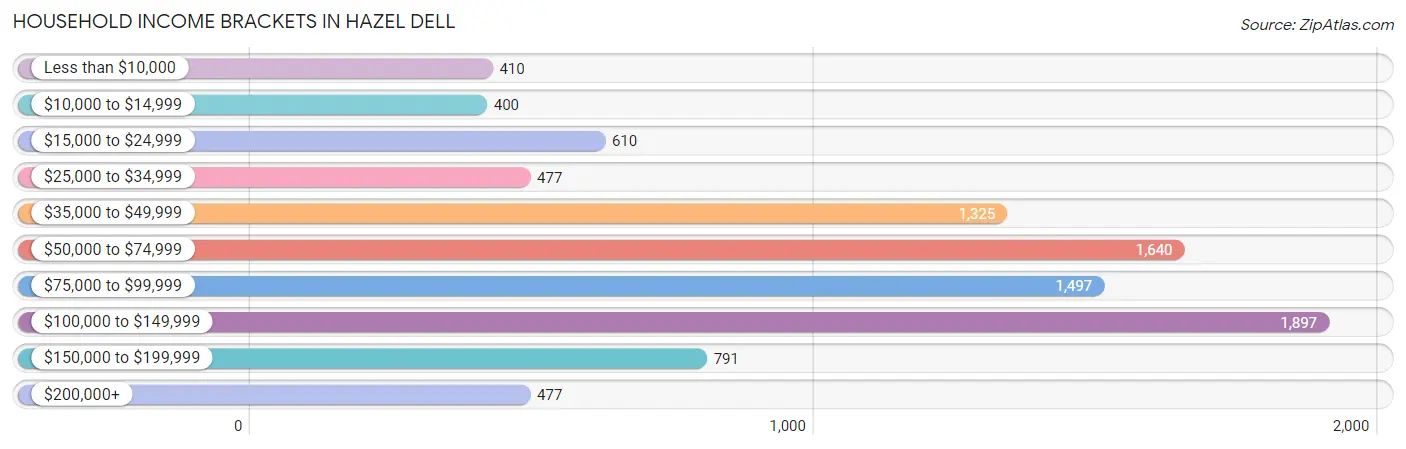
| Income Bracket | # Households | % Households |
| Less than $10,000 | 410 | 4.3% |
| $10,000 to $14,999 | 400 | 4.2% |
| $15,000 to $24,999 | 610 | 6.4% |
| $25,000 to $34,999 | 477 | 5.0% |
| $35,000 to $49,999 | 1,325 | 13.9% |
| $50,000 to $74,999 | 1,640 | 17.2% |
| $75,000 to $99,999 | 1,497 | 15.7% |
| $100,000 to $149,999 | 1,897 | 19.9% |
| $150,000 to $199,999 | 791 | 8.3% |
| $200,000+ | 477 | 5.0% |
Household Income by Householder Age in Hazel Dell
The median household income in Hazel Dell is $72,299, with the highest median household income of $85,188 found in the 45 to 64 years age bracket for the primary householder. A total of 3,389 households (35.5%) fall into this category. Meanwhile, the 65+ years age bracket for the primary householder has the lowest median household income of $42,434, with 2,128 households (22.3%) in this group.
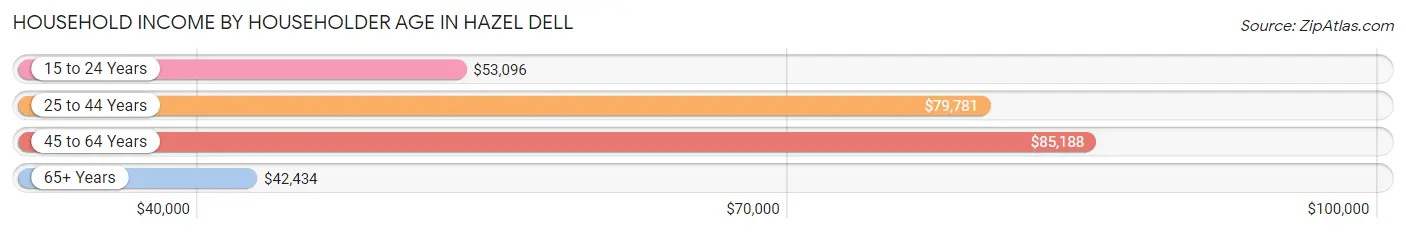
| Income Bracket | # Households | Median Income |
| 15 to 24 Years | 503 (5.3%) | $53,096 |
| 25 to 44 Years | 3,513 (36.8%) | $79,781 |
| 45 to 64 Years | 3,389 (35.5%) | $85,188 |
| 65+ Years | 2,128 (22.3%) | $42,434 |
| Total | 9,533 (100.0%) | $72,299 |
Poverty in Hazel Dell
Income Below Poverty by Sex and Age in Hazel Dell
With 8.5% poverty level for males and 11.3% for females among the residents of Hazel Dell, 15 year old males and 45 to 54 year old females are the most vulnerable to poverty, with 34 males (75.6%) and 217 females (17.7%) in their respective age groups living below the poverty level.
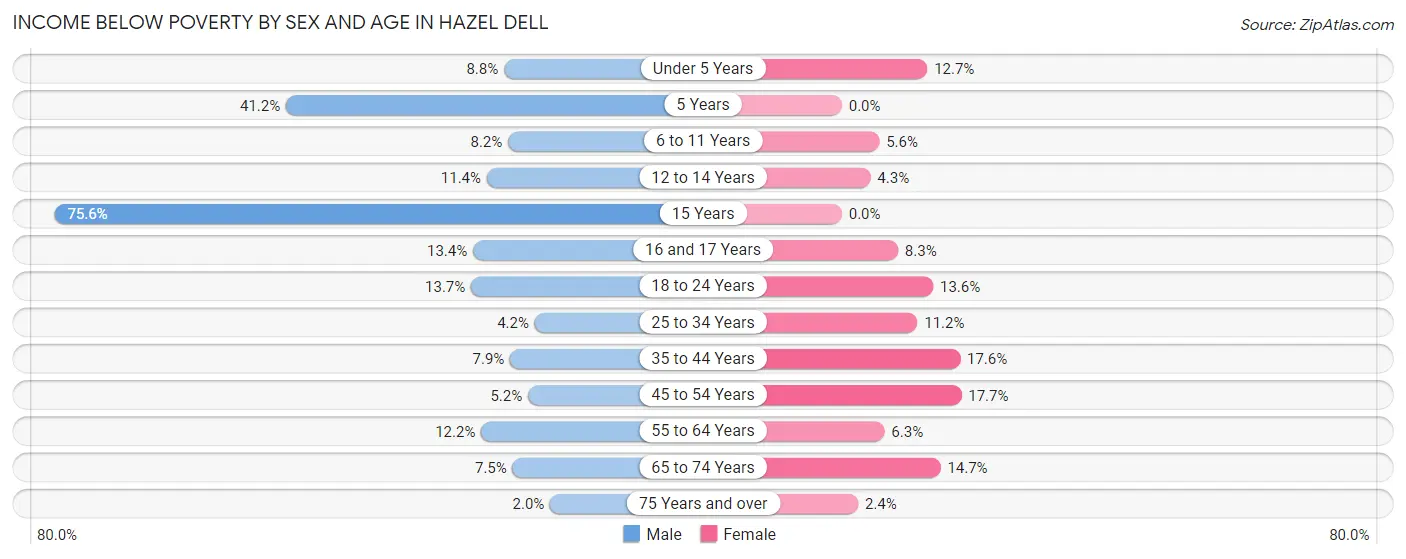
| Age Bracket | Male | Female |
| Under 5 Years | 48 (8.8%) | 98 (12.7%) |
| 5 Years | 35 (41.2%) | 0 (0.0%) |
| 6 to 11 Years | 62 (8.2%) | 36 (5.6%) |
| 12 to 14 Years | 20 (11.4%) | 17 (4.3%) |
| 15 Years | 34 (75.6%) | 0 (0.0%) |
| 16 and 17 Years | 35 (13.4%) | 29 (8.3%) |
| 18 to 24 Years | 163 (13.7%) | 137 (13.6%) |
| 25 to 34 Years | 86 (4.2%) | 184 (11.2%) |
| 35 to 44 Years | 134 (7.9%) | 288 (17.6%) |
| 45 to 54 Years | 73 (5.2%) | 217 (17.7%) |
| 55 to 64 Years | 184 (12.2%) | 94 (6.3%) |
| 65 to 74 Years | 62 (7.5%) | 165 (14.6%) |
| 75 Years and over | 12 (2.0%) | 20 (2.4%) |
| Total | 948 (8.5%) | 1,285 (11.3%) |
Income Above Poverty by Sex and Age in Hazel Dell
According to the poverty statistics in Hazel Dell, males aged 75 years and over and females aged 5 years are the age groups that are most secure financially, with 98.0% of males and 100.0% of females in these age groups living above the poverty line.
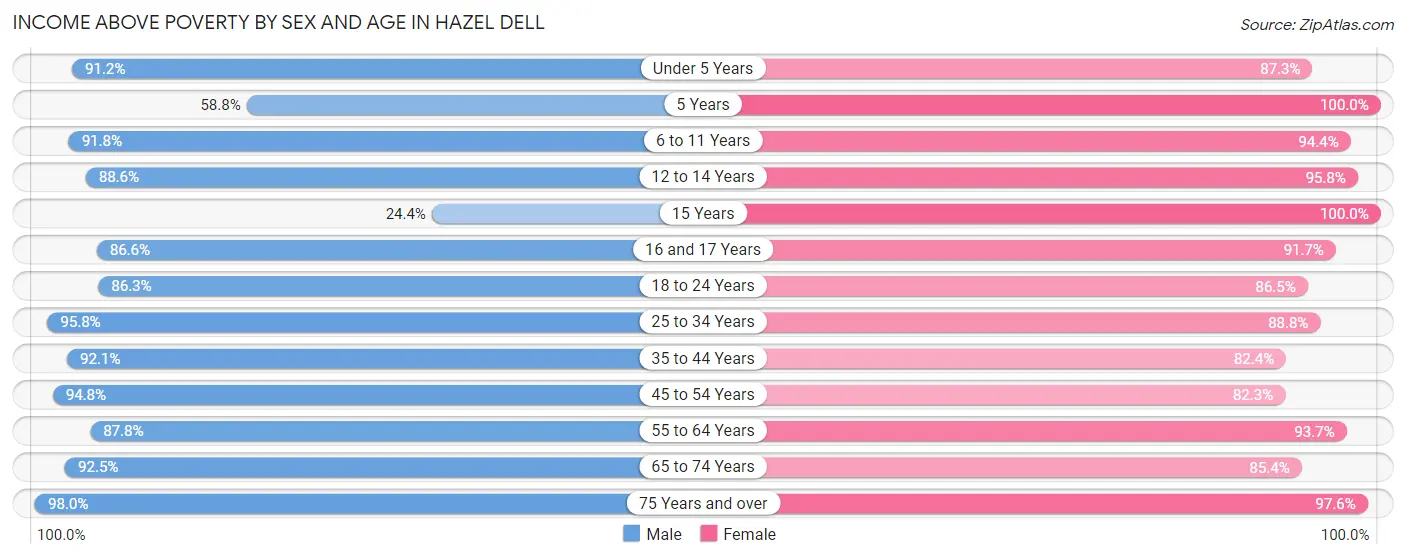
| Age Bracket | Male | Female |
| Under 5 Years | 497 (91.2%) | 675 (87.3%) |
| 5 Years | 50 (58.8%) | 95 (100.0%) |
| 6 to 11 Years | 694 (91.8%) | 612 (94.4%) |
| 12 to 14 Years | 156 (88.6%) | 383 (95.8%) |
| 15 Years | 11 (24.4%) | 165 (100.0%) |
| 16 and 17 Years | 226 (86.6%) | 319 (91.7%) |
| 18 to 24 Years | 1,027 (86.3%) | 874 (86.5%) |
| 25 to 34 Years | 1,943 (95.8%) | 1,457 (88.8%) |
| 35 to 44 Years | 1,562 (92.1%) | 1,352 (82.4%) |
| 45 to 54 Years | 1,319 (94.8%) | 1,006 (82.3%) |
| 55 to 64 Years | 1,325 (87.8%) | 1,391 (93.7%) |
| 65 to 74 Years | 761 (92.5%) | 961 (85.4%) |
| 75 Years and over | 599 (98.0%) | 811 (97.6%) |
| Total | 10,170 (91.5%) | 10,101 (88.7%) |
Income Below Poverty Among Married-Couple Families in Hazel Dell
The poverty statistics for married-couple families in Hazel Dell show that 6.7% or 261 of the total 3,894 families live below the poverty line. Families with 3 or 4 children have the highest poverty rate of 8.9%, comprising of 17 families. On the other hand, families with 1 or 2 children have the lowest poverty rate of 2.0%, which includes 23 families.
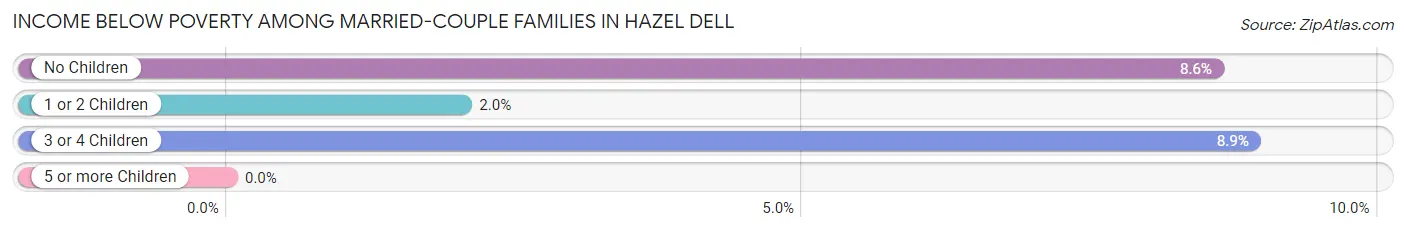
| Children | Above Poverty | Below Poverty |
| No Children | 2,355 (91.4%) | 221 (8.6%) |
| 1 or 2 Children | 1,104 (98.0%) | 23 (2.0%) |
| 3 or 4 Children | 174 (91.1%) | 17 (8.9%) |
| 5 or more Children | 0 (0.0%) | 0 (0.0%) |
| Total | 3,633 (93.3%) | 261 (6.7%) |
Income Below Poverty Among Single-Parent Households in Hazel Dell
According to the poverty data in Hazel Dell, 2.4% or 16 single-father households and 10.7% or 116 single-mother households are living below the poverty line. Among single-father households, those with no children have the highest poverty rate, with 11 households (7.4%) experiencing poverty. Likewise, among single-mother households, those with 3 or 4 children have the highest poverty rate, with 43 households (41.3%) falling below the poverty line.
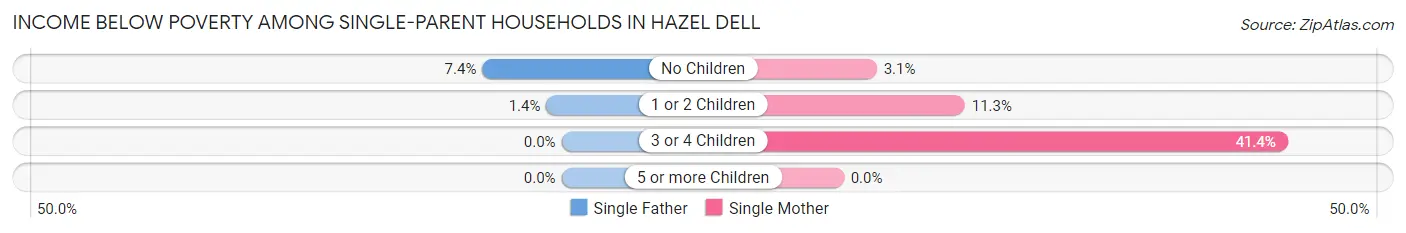
| Children | Single Father | Single Mother |
| No Children | 11 (7.4%) | 14 (3.1%) |
| 1 or 2 Children | 5 (1.4%) | 59 (11.3%) |
| 3 or 4 Children | 0 (0.0%) | 43 (41.3%) |
| 5 or more Children | 0 (0.0%) | 0 (0.0%) |
| Total | 16 (2.4%) | 116 (10.7%) |
Income Below Poverty Among Married-Couple vs Single-Parent Households in Hazel Dell
The poverty data for Hazel Dell shows that 261 of the married-couple family households (6.7%) and 132 of the single-parent households (7.5%) are living below the poverty level. Within the married-couple family households, those with 3 or 4 children have the highest poverty rate, with 17 households (8.9%) falling below the poverty line. Among the single-parent households, those with 3 or 4 children have the highest poverty rate, with 43 household (15.6%) living below poverty.
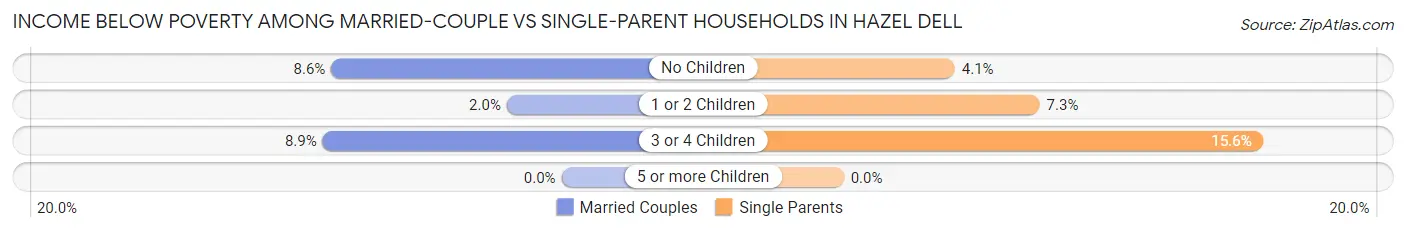
| Children | Married-Couple Families | Single-Parent Households |
| No Children | 221 (8.6%) | 25 (4.1%) |
| 1 or 2 Children | 23 (2.0%) | 64 (7.3%) |
| 3 or 4 Children | 17 (8.9%) | 43 (15.6%) |
| 5 or more Children | 0 (0.0%) | 0 (0.0%) |
| Total | 261 (6.7%) | 132 (7.5%) |
Race in Hazel Dell
The most populous races in Hazel Dell are White / Caucasian (17,096 | 75.3%), Hispanic or Latino (2,949 | 13.0%), and Two or more Races (2,114 | 9.3%).
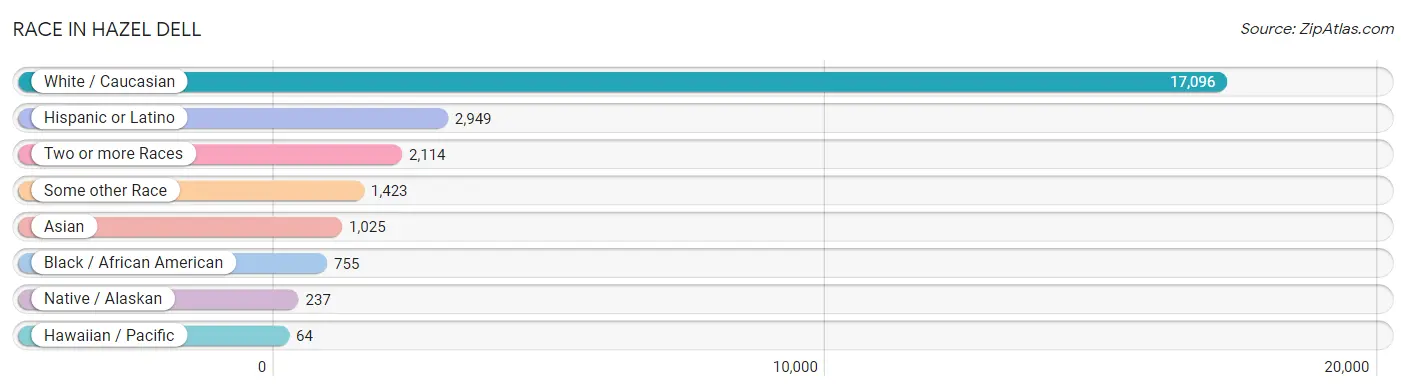
| Race | # Population | % Population |
| Asian | 1,025 | 4.5% |
| Black / African American | 755 | 3.3% |
| Hawaiian / Pacific | 64 | 0.3% |
| Hispanic or Latino | 2,949 | 13.0% |
| Native / Alaskan | 237 | 1.0% |
| White / Caucasian | 17,096 | 75.3% |
| Two or more Races | 2,114 | 9.3% |
| Some other Race | 1,423 | 6.3% |
| Total | 22,714 | 100.0% |
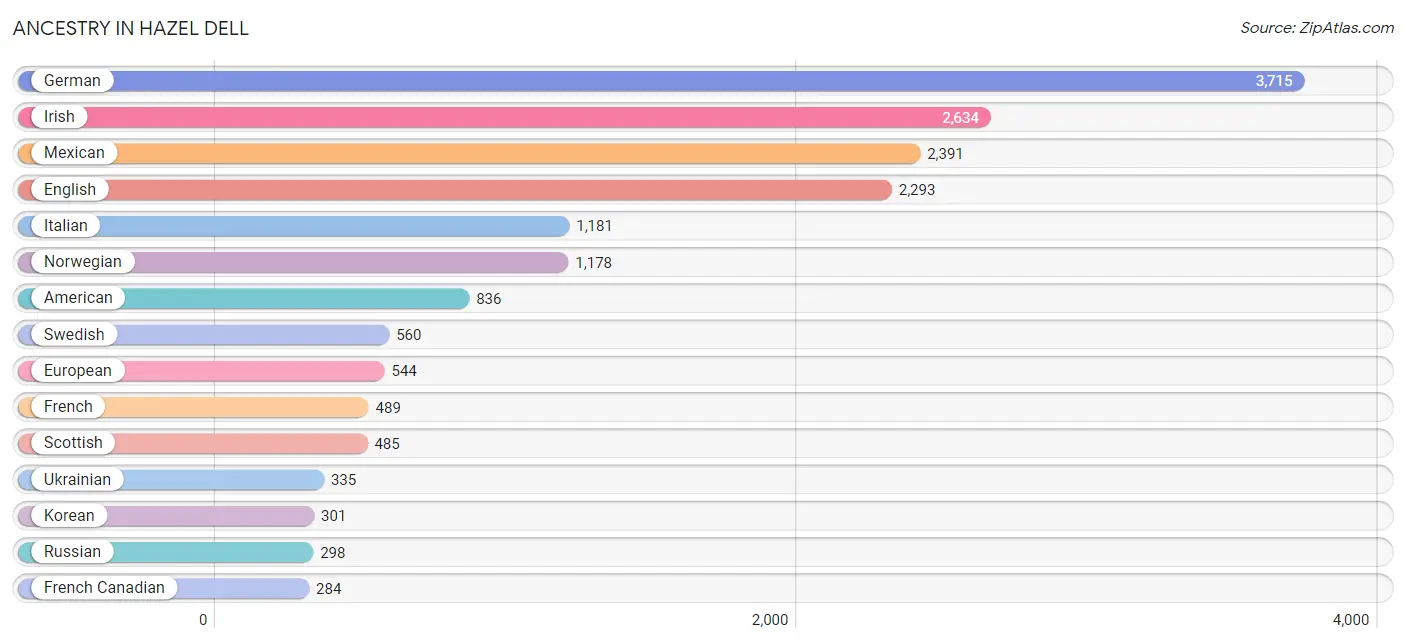
Ancestry in Hazel Dell
The most populous ancestries reported in Hazel Dell are German (3,715 | 16.4%), Irish (2,634 | 11.6%), Mexican (2,391 | 10.5%), English (2,293 | 10.1%), and Italian (1,181 | 5.2%), together accounting for 53.8% of all Hazel Dell residents.
| Ancestry | # Population | % Population |
| African | 43 | 0.2% |
| Aleut | 6 | 0.0% |
| American | 836 | 3.7% |
| Apache | 28 | 0.1% |
| Arab | 28 | 0.1% |
| Australian | 21 | 0.1% |
| Austrian | 86 | 0.4% |
| Bangladeshi | 59 | 0.3% |
| Basque | 56 | 0.3% |
| Belgian | 8 | 0.0% |
| Bhutanese | 120 | 0.5% |
| Blackfeet | 11 | 0.1% |
| British | 136 | 0.6% |
| Burmese | 138 | 0.6% |
| Cajun | 10 | 0.0% |
| Canadian | 129 | 0.6% |
| Central American | 218 | 1.0% |
| Central American Indian | 47 | 0.2% |
| Cherokee | 82 | 0.4% |
| Chickasaw | 35 | 0.2% |
| Chilean | 24 | 0.1% |
| Choctaw | 15 | 0.1% |
| Colville | 20 | 0.1% |
| Croatian | 24 | 0.1% |
| Cuban | 40 | 0.2% |
| Czech | 81 | 0.4% |
| Danish | 245 | 1.1% |
| Dominican | 7 | 0.0% |
| Dutch | 207 | 0.9% |
| Eastern European | 44 | 0.2% |
| Egyptian | 17 | 0.1% |
| English | 2,293 | 10.1% |
| Ethiopian | 43 | 0.2% |
| European | 544 | 2.4% |
| Filipino | 154 | 0.7% |
| Finnish | 200 | 0.9% |
| French | 489 | 2.1% |
| French Canadian | 284 | 1.3% |
| German | 3,715 | 16.4% |
| Greek | 89 | 0.4% |
| Guamanian / Chamorro | 29 | 0.1% |
| Guatemalan | 58 | 0.3% |
| Honduran | 24 | 0.1% |
| Hungarian | 63 | 0.3% |
| Indian (Asian) | 182 | 0.8% |
| Indonesian | 14 | 0.1% |
| Inupiat | 3 | 0.0% |
| Iranian | 49 | 0.2% |
| Irish | 2,634 | 11.6% |
| Italian | 1,181 | 5.2% |
| Jamaican | 3 | 0.0% |
| Japanese | 119 | 0.5% |
| Korean | 301 | 1.3% |
| Malaysian | 162 | 0.7% |
| Mexican | 2,391 | 10.5% |
| Mexican American Indian | 8 | 0.0% |
| Native Hawaiian | 17 | 0.1% |
| Navajo | 1 | 0.0% |
| Nepalese | 214 | 0.9% |
| Nigerian | 139 | 0.6% |
| Northern European | 67 | 0.3% |
| Norwegian | 1,178 | 5.2% |
| Osage | 11 | 0.1% |
| Paiute | 5 | 0.0% |
| Pakistani | 7 | 0.0% |
| Peruvian | 57 | 0.3% |
| Polish | 210 | 0.9% |
| Portuguese | 111 | 0.5% |
| Puerto Rican | 58 | 0.3% |
| Puget Sound Salish | 52 | 0.2% |
| Romanian | 151 | 0.7% |
| Russian | 298 | 1.3% |
| Salvadoran | 136 | 0.6% |
| Samoan | 14 | 0.1% |
| Scandinavian | 70 | 0.3% |
| Scotch-Irish | 272 | 1.2% |
| Scottish | 485 | 2.1% |
| Senegalese | 11 | 0.1% |
| Slavic | 36 | 0.2% |
| Slovak | 23 | 0.1% |
| Slovene | 28 | 0.1% |
| South American | 81 | 0.4% |
| Spaniard | 28 | 0.1% |
| Spanish | 90 | 0.4% |
| Sri Lankan | 139 | 0.6% |
| Subsaharan African | 222 | 1.0% |
| Swedish | 560 | 2.5% |
| Swiss | 141 | 0.6% |
| Syrian | 11 | 0.1% |
| Thai | 23 | 0.1% |
| Ukrainian | 335 | 1.5% |
| Welsh | 204 | 0.9% |
| Yakama | 32 | 0.1% |
| Yugoslavian | 8 | 0.0% |
| Yup'ik | 8 | 0.0% | View All 95 Rows |
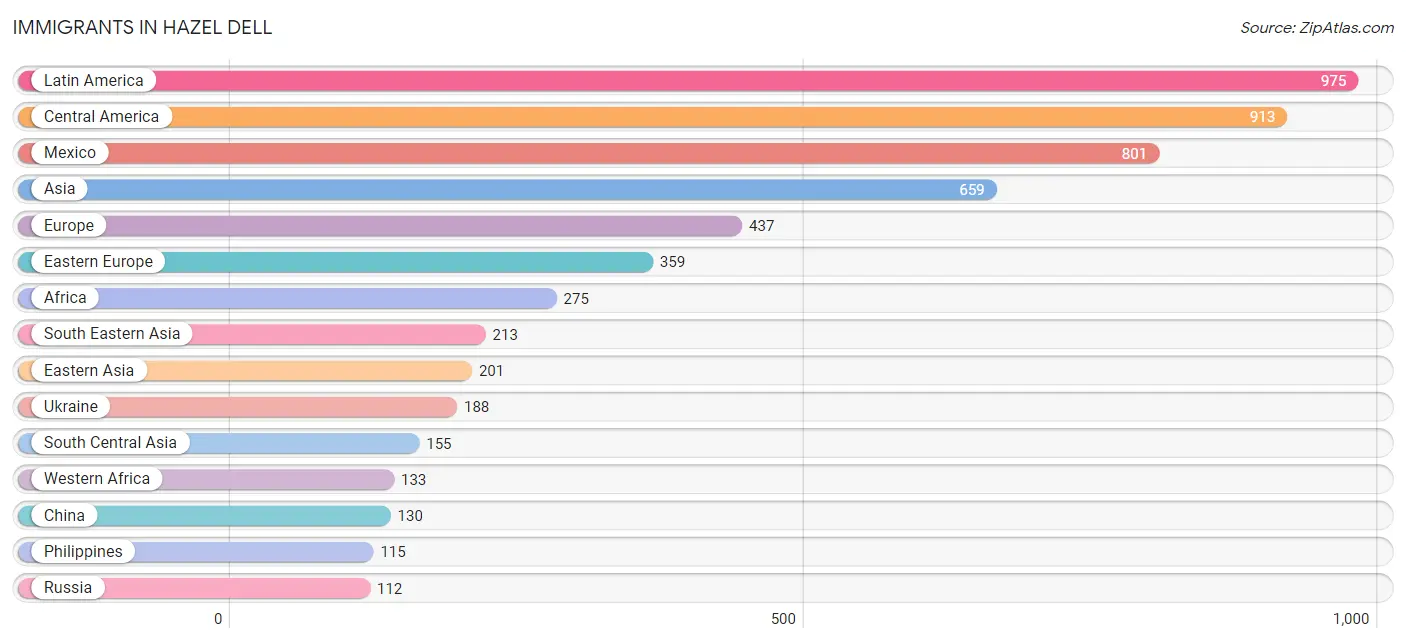
Immigrants in Hazel Dell
The most numerous immigrant groups reported in Hazel Dell came from Latin America (975 | 4.3%), Central America (913 | 4.0%), Mexico (801 | 3.5%), Asia (659 | 2.9%), and Europe (437 | 1.9%), together accounting for 16.7% of all Hazel Dell residents.
| Immigration Origin | # Population | % Population |
| Africa | 275 | 1.2% |
| Asia | 659 | 2.9% |
| Australia | 21 | 0.1% |
| Belarus | 7 | 0.0% |
| Cambodia | 30 | 0.1% |
| Canada | 55 | 0.2% |
| Caribbean | 10 | 0.0% |
| Central America | 913 | 4.0% |
| Chile | 37 | 0.2% |
| China | 130 | 0.6% |
| Dominican Republic | 7 | 0.0% |
| Eastern Africa | 54 | 0.2% |
| Eastern Asia | 201 | 0.9% |
| Eastern Europe | 359 | 1.6% |
| Egypt | 17 | 0.1% |
| El Salvador | 77 | 0.3% |
| Ethiopia | 54 | 0.2% |
| Europe | 437 | 1.9% |
| Germany | 9 | 0.0% |
| Guatemala | 11 | 0.1% |
| Honduras | 24 | 0.1% |
| Hong Kong | 19 | 0.1% |
| India | 23 | 0.1% |
| Iran | 49 | 0.2% |
| Iraq | 21 | 0.1% |
| Ireland | 17 | 0.1% |
| Jamaica | 3 | 0.0% |
| Japan | 18 | 0.1% |
| Kazakhstan | 33 | 0.2% |
| Korea | 53 | 0.2% |
| Laos | 27 | 0.1% |
| Latin America | 975 | 4.3% |
| Mexico | 801 | 3.5% |
| Nigeria | 108 | 0.5% |
| Northern Africa | 17 | 0.1% |
| Northern Europe | 23 | 0.1% |
| Oceania | 35 | 0.2% |
| Peru | 15 | 0.1% |
| Philippines | 115 | 0.5% |
| Romania | 52 | 0.2% |
| Russia | 112 | 0.5% |
| Senegal | 13 | 0.1% |
| Sierra Leone | 12 | 0.1% |
| South America | 52 | 0.2% |
| South Central Asia | 155 | 0.7% |
| South Eastern Asia | 213 | 0.9% |
| Southern Europe | 46 | 0.2% |
| Spain | 46 | 0.2% |
| Taiwan | 28 | 0.1% |
| Thailand | 11 | 0.1% |
| Ukraine | 188 | 0.8% |
| Uzbekistan | 34 | 0.2% |
| Vietnam | 30 | 0.1% |
| Western Africa | 133 | 0.6% |
| Western Asia | 90 | 0.4% |
| Western Europe | 9 | 0.0% | View All 56 Rows |
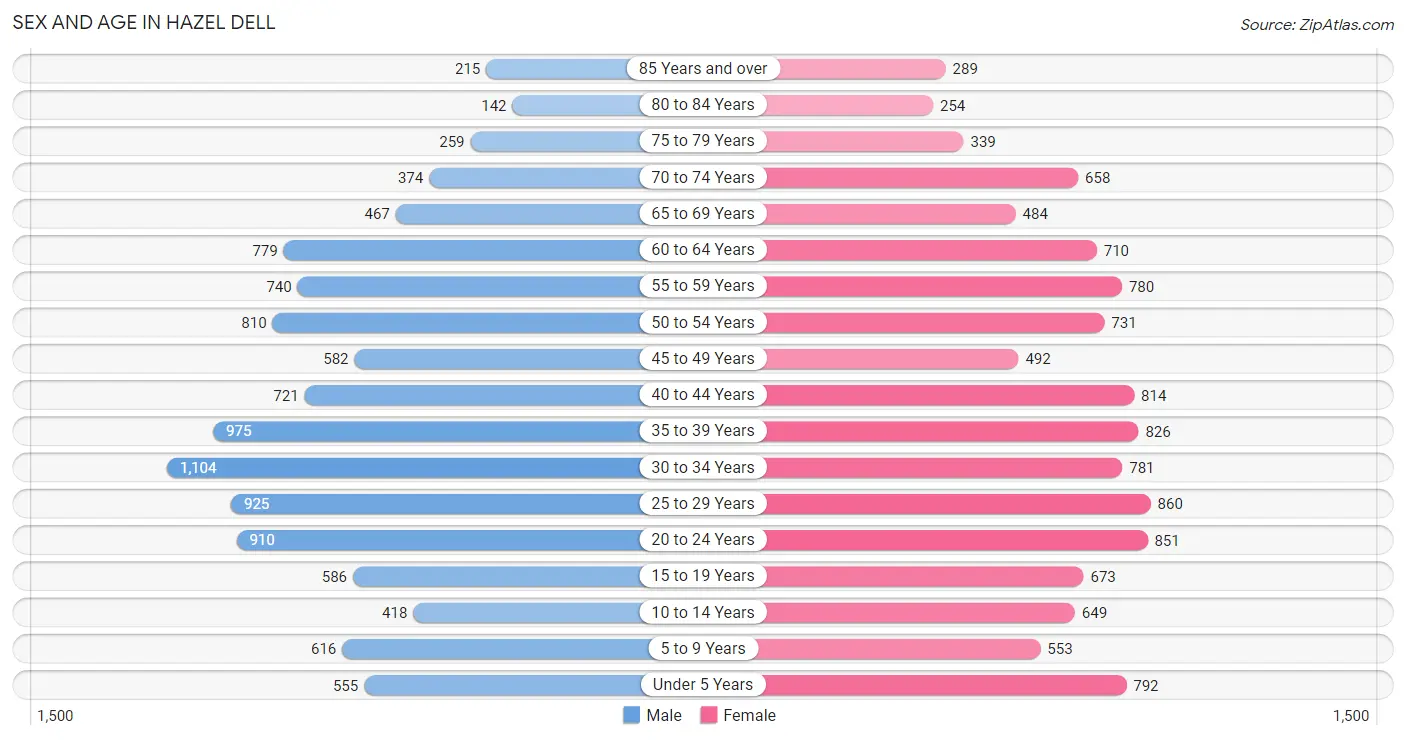
Sex and Age in Hazel Dell
Sex and Age in Hazel Dell
The most populous age groups in Hazel Dell are 30 to 34 Years (1,104 | 9.9%) for men and 25 to 29 Years (860 | 7.4%) for women.
| Age Bracket | Male | Female |
| Under 5 Years | 555 (5.0%) | 792 (6.9%) |
| 5 to 9 Years | 616 (5.5%) | 553 (4.8%) |
| 10 to 14 Years | 418 (3.7%) | 649 (5.6%) |
| 15 to 19 Years | 586 (5.2%) | 673 (5.8%) |
| 20 to 24 Years | 910 (8.1%) | 851 (7.4%) |
| 25 to 29 Years | 925 (8.3%) | 860 (7.4%) |
| 30 to 34 Years | 1,104 (9.9%) | 781 (6.8%) |
| 35 to 39 Years | 975 (8.7%) | 826 (7.2%) |
| 40 to 44 Years | 721 (6.5%) | 814 (7.1%) |
| 45 to 49 Years | 582 (5.2%) | 492 (4.3%) |
| 50 to 54 Years | 810 (7.2%) | 731 (6.3%) |
| 55 to 59 Years | 740 (6.6%) | 780 (6.8%) |
| 60 to 64 Years | 779 (7.0%) | 710 (6.1%) |
| 65 to 69 Years | 467 (4.2%) | 484 (4.2%) |
| 70 to 74 Years | 374 (3.4%) | 658 (5.7%) |
| 75 to 79 Years | 259 (2.3%) | 339 (2.9%) |
| 80 to 84 Years | 142 (1.3%) | 254 (2.2%) |
| 85 Years and over | 215 (1.9%) | 289 (2.5%) |
| Total | 11,178 (100.0%) | 11,536 (100.0%) |
Families and Households in Hazel Dell
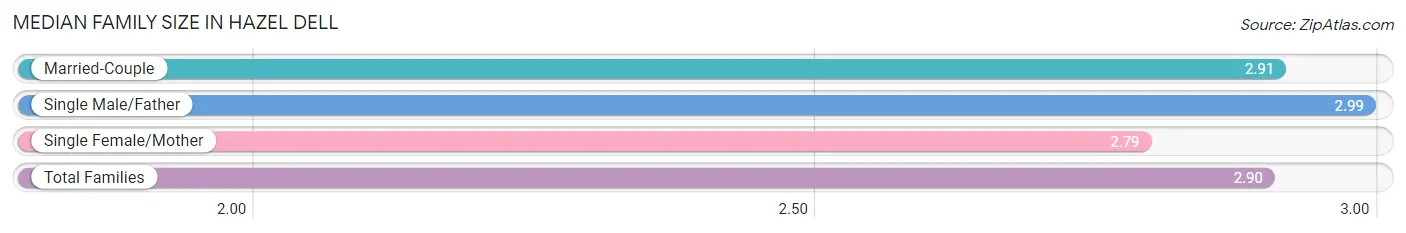
Median Family Size in Hazel Dell
The median family size in Hazel Dell is 2.90 persons per family, with single male/father families (674 | 11.9%) accounting for the largest median family size of 2.99 persons per family. On the other hand, single female/mother families (1,082 | 19.2%) represent the smallest median family size with 2.79 persons per family.
| Family Type | # Families | Family Size |
| Married-Couple | 3,894 (68.9%) | 2.91 |
| Single Male/Father | 674 (11.9%) | 2.99 |
| Single Female/Mother | 1,082 (19.2%) | 2.79 |
| Total Families | 5,650 (100.0%) | 2.90 |
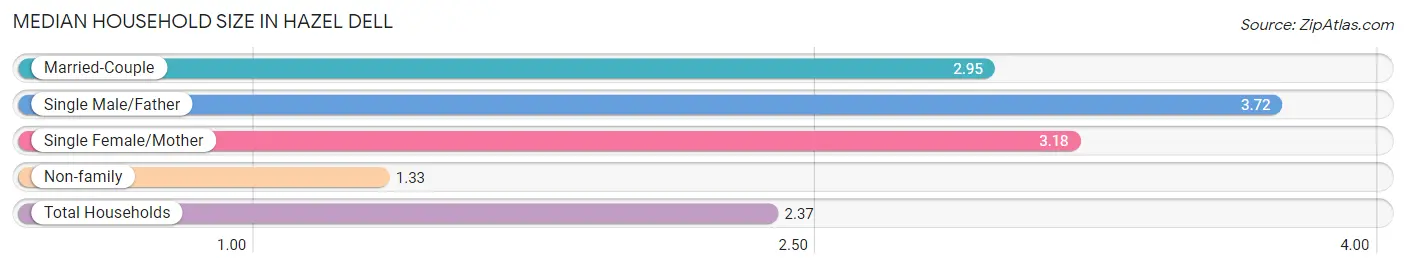
Median Household Size in Hazel Dell
The median household size in Hazel Dell is 2.37 persons per household, with single male/father households (674 | 7.1%) accounting for the largest median household size of 3.72 persons per household. non-family households (3,883 | 40.7%) represent the smallest median household size with 1.33 persons per household.
| Household Type | # Households | Household Size |
| Married-Couple | 3,894 (40.8%) | 2.95 |
| Single Male/Father | 674 (7.1%) | 3.72 |
| Single Female/Mother | 1,082 (11.4%) | 3.18 |
| Non-family | 3,883 (40.7%) | 1.33 |
| Total Households | 9,533 (100.0%) | 2.37 |
Household Size by Marriage Status in Hazel Dell
Out of a total of 9,533 households in Hazel Dell, 5,650 (59.3%) are family households, while 3,883 (40.7%) are nonfamily households. The most numerous type of family households are 2-person households, comprising 2,627, and the most common type of nonfamily households are 1-person households, comprising 2,923.
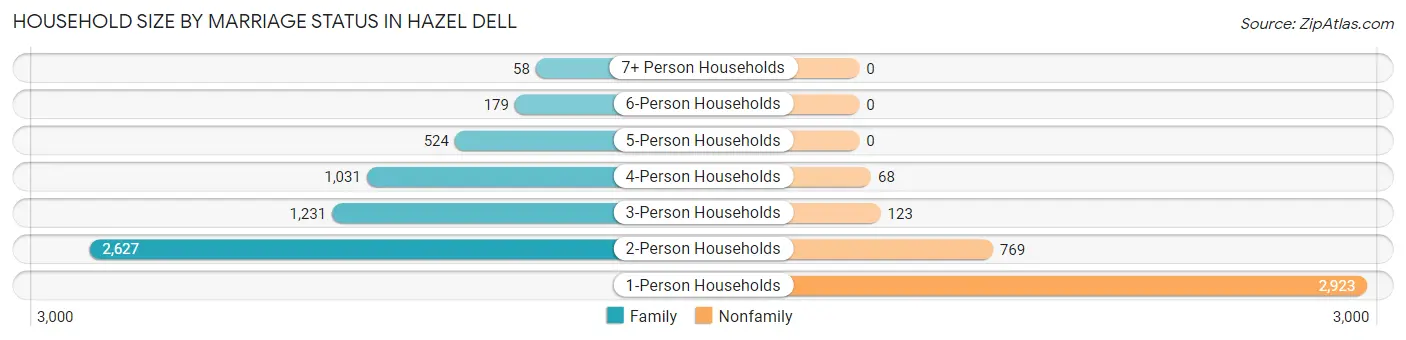
| Household Size | Family Households | Nonfamily Households |
| 1-Person Households | - | 2,923 (30.7%) |
| 2-Person Households | 2,627 (27.6%) | 769 (8.1%) |
| 3-Person Households | 1,231 (12.9%) | 123 (1.3%) |
| 4-Person Households | 1,031 (10.8%) | 68 (0.7%) |
| 5-Person Households | 524 (5.5%) | 0 (0.0%) |
| 6-Person Households | 179 (1.9%) | 0 (0.0%) |
| 7+ Person Households | 58 (0.6%) | 0 (0.0%) |
| Total | 5,650 (59.3%) | 3,883 (40.7%) |
Female Fertility in Hazel Dell
Fertility by Age in Hazel Dell
Average fertility rate in Hazel Dell is 45.0 births per 1,000 women. Women in the age bracket of 20 to 34 years have the highest fertility rate with 85.0 births per 1,000 women. Women in the age bracket of 20 to 34 years acount for 86.8% of all women with births.
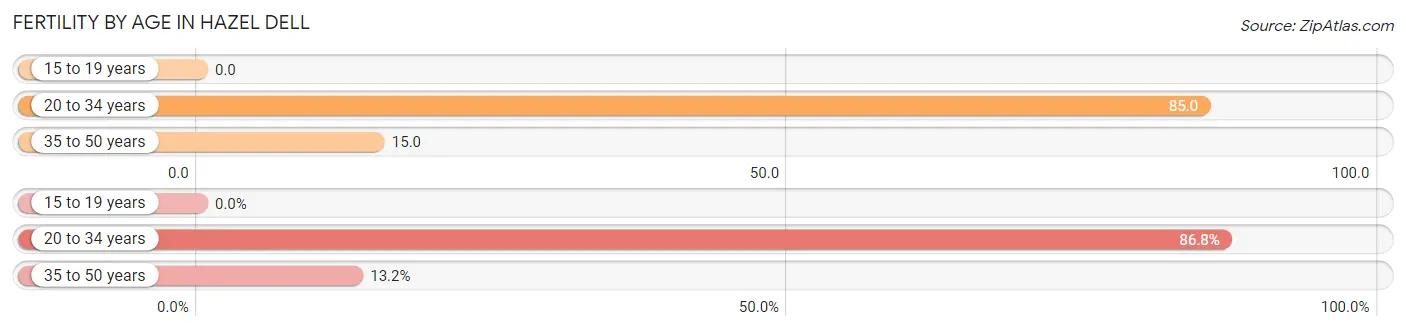
| Age Bracket | Women with Births | Births / 1,000 Women |
| 15 to 19 years | 0 (0.0%) | 0.0 |
| 20 to 34 years | 211 (86.8%) | 85.0 |
| 35 to 50 years | 32 (13.2%) | 15.0 |
| Total | 243 (100.0%) | 45.0 |
Fertility by Age by Marriage Status in Hazel Dell
63.4% of women with births (243) in Hazel Dell are married. The highest percentage of unmarried women with births falls into 35 to 50 years age bracket with 62.5% of them unmarried at the time of birth, while the lowest percentage of unmarried women with births belong to 20 to 34 years age bracket with 32.7% of them unmarried.
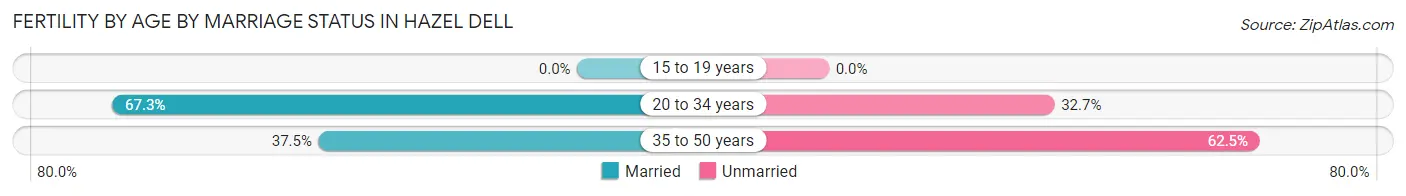
| Age Bracket | Married | Unmarried |
| 15 to 19 years | 0 (0.0%) | 0 (0.0%) |
| 20 to 34 years | 142 (67.3%) | 69 (32.7%) |
| 35 to 50 years | 12 (37.5%) | 20 (62.5%) |
| Total | 154 (63.4%) | 89 (36.6%) |
Fertility by Education in Hazel Dell
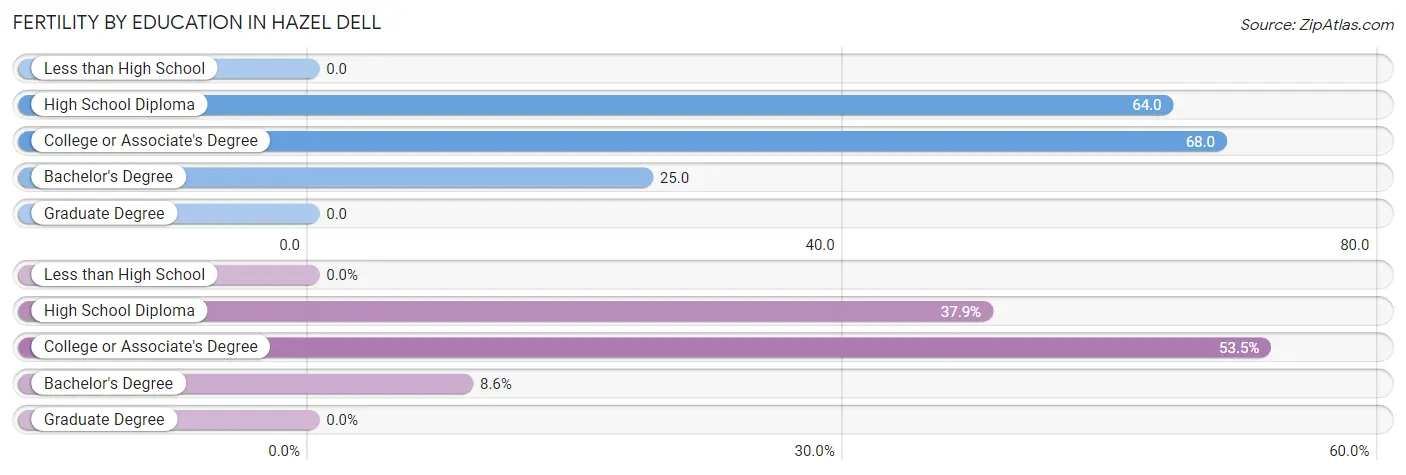
| Educational Attainment | Women with Births | Births / 1,000 Women |
| Less than High School | 0 (0.0%) | 0.0 |
| High School Diploma | 92 (37.9%) | 64.0 |
| College or Associate's Degree | 130 (53.5%) | 68.0 |
| Bachelor's Degree | 21 (8.6%) | 25.0 |
| Graduate Degree | 0 (0.0%) | 0.0 |
| Total | 243 (100.0%) | 45.0 |
Fertility by Education by Marriage Status in Hazel Dell
36.6% of women with births in Hazel Dell are unmarried. Women with the educational attainment of bachelor's degree are most likely to be married with 100.0% of them married at childbirth, while women with the educational attainment of college or associate's degree are least likely to be married with 47.7% of them unmarried at childbirth.
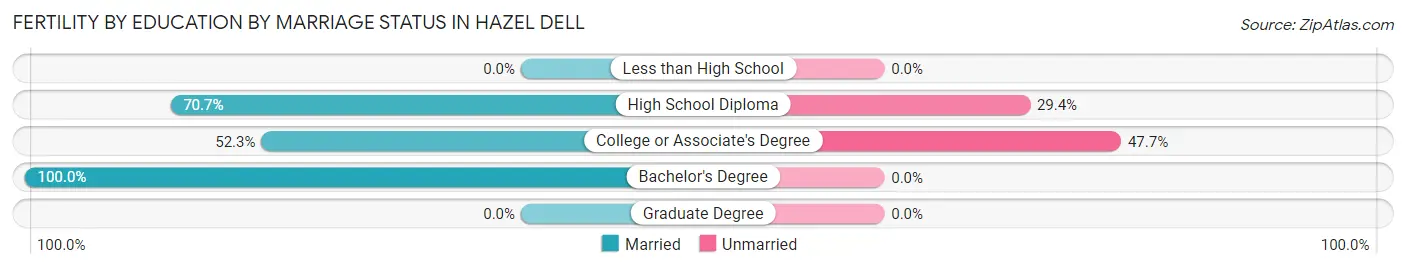
| Educational Attainment | Married | Unmarried |
| Less than High School | 0 (0.0%) | 0 (0.0%) |
| High School Diploma | 65 (70.7%) | 27 (29.3%) |
| College or Associate's Degree | 68 (52.3%) | 62 (47.7%) |
| Bachelor's Degree | 21 (100.0%) | 0 (0.0%) |
| Graduate Degree | 0 (0.0%) | 0 (0.0%) |
| Total | 154 (63.4%) | 89 (36.6%) |
Employment Characteristics in Hazel Dell
Employment by Class of Employer in Hazel Dell
Among the 11,191 employed individuals in Hazel Dell, private company employees (7,865 | 70.3%), not-for-profit organizations (887 | 7.9%), and local government employees (694 | 6.2%) make up the most common classes of employment.
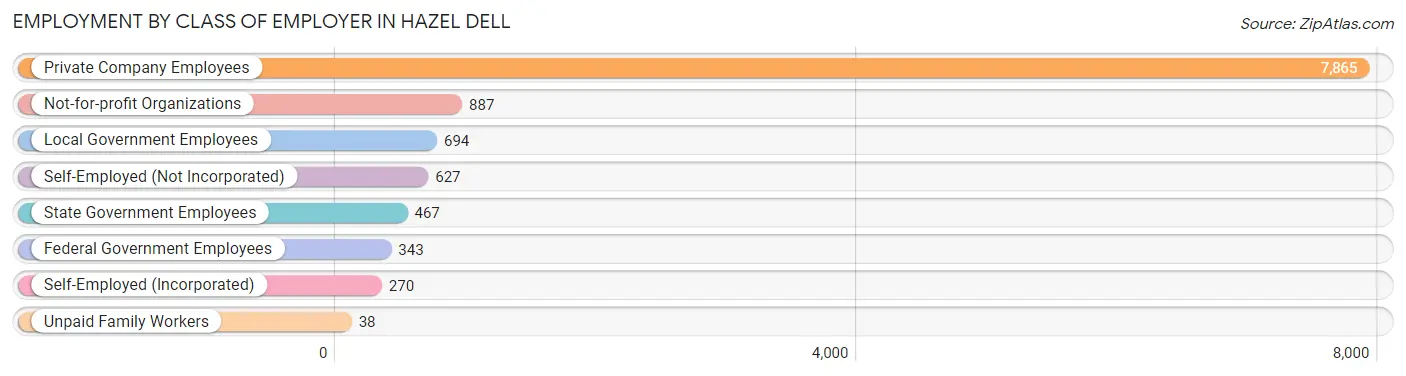
| Employer Class | # Employees | % Employees |
| Private Company Employees | 7,865 | 70.3% |
| Self-Employed (Incorporated) | 270 | 2.4% |
| Self-Employed (Not Incorporated) | 627 | 5.6% |
| Not-for-profit Organizations | 887 | 7.9% |
| Local Government Employees | 694 | 6.2% |
| State Government Employees | 467 | 4.2% |
| Federal Government Employees | 343 | 3.1% |
| Unpaid Family Workers | 38 | 0.3% |
| Total | 11,191 | 100.0% |
Employment Status by Age in Hazel Dell
According to the labor force statistics for Hazel Dell, out of the total population over 16 years of age (18,921), 65.9% or 12,469 individuals are in the labor force, with 7.7% or 960 of them unemployed. The age group with the highest labor force participation rate is 25 to 29 years, with 88.7% or 1,583 individuals in the labor force. Within the labor force, the 75 years and over age range has the highest percentage of unemployed individuals, with 23.1% or 12 of them being unemployed.
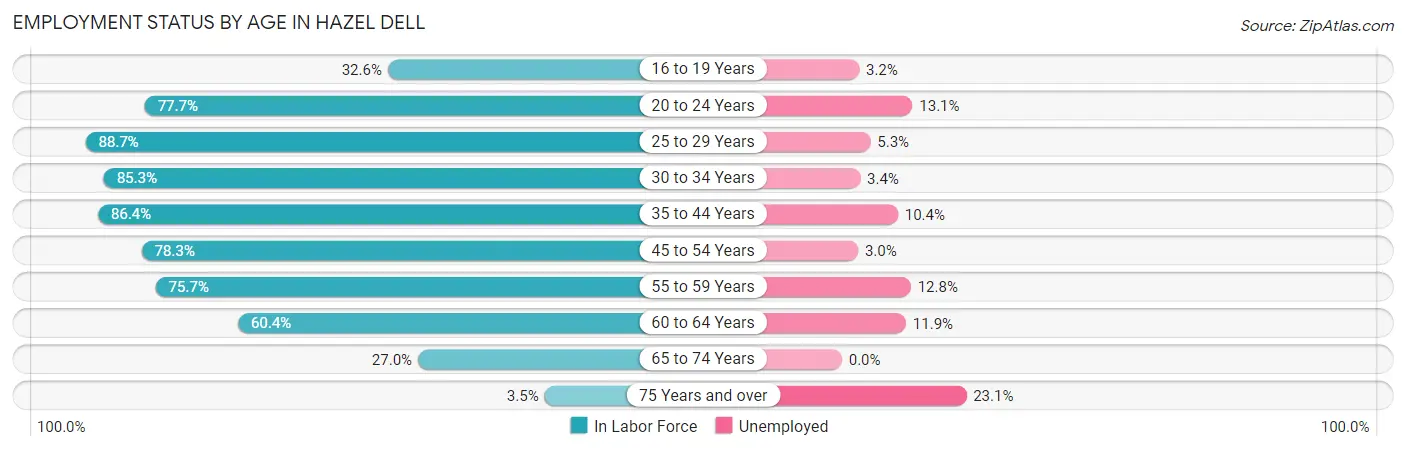
| Age Bracket | In Labor Force | Unemployed |
| 16 to 19 Years | 342 (32.6%) | 11 (3.2%) |
| 20 to 24 Years | 1,368 (77.7%) | 179 (13.1%) |
| 25 to 29 Years | 1,583 (88.7%) | 84 (5.3%) |
| 30 to 34 Years | 1,608 (85.3%) | 55 (3.4%) |
| 35 to 44 Years | 2,882 (86.4%) | 300 (10.4%) |
| 45 to 54 Years | 2,048 (78.3%) | 61 (3.0%) |
| 55 to 59 Years | 1,151 (75.7%) | 147 (12.8%) |
| 60 to 64 Years | 899 (60.4%) | 107 (11.9%) |
| 65 to 74 Years | 535 (27.0%) | 0 (0.0%) |
| 75 Years and over | 52 (3.5%) | 12 (23.1%) |
| Total | 12,469 (65.9%) | 960 (7.7%) |
Employment Status by Educational Attainment in Hazel Dell
According to labor force statistics for Hazel Dell, 80.5% of individuals (10,167) out of the total population between 25 and 64 years of age (12,630) are in the labor force, with 7.4% or 752 of them being unemployed. The group with the highest labor force participation rate are those with the educational attainment of bachelor's degree or higher, with 87.7% or 2,813 individuals in the labor force. Within the labor force, individuals with less than high school education have the highest percentage of unemployment, with 10.2% or 67 of them being unemployed.
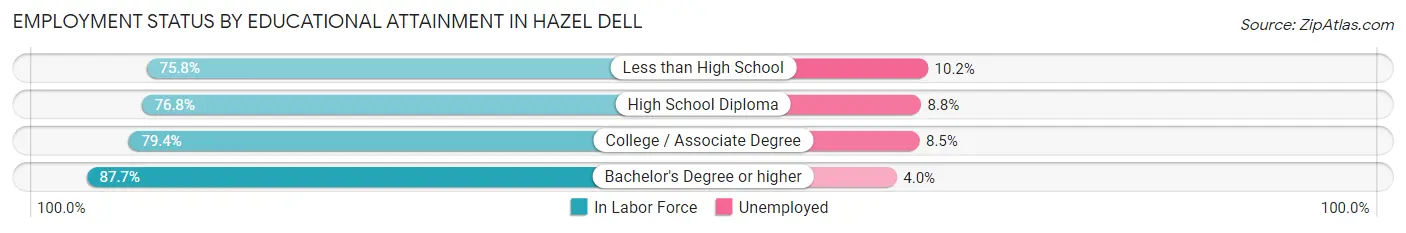
| Educational Attainment | In Labor Force | Unemployed |
| Less than High School | 656 (75.8%) | 88 (10.2%) |
| High School Diploma | 2,587 (76.8%) | 296 (8.8%) |
| College / Associate Degree | 4,118 (79.4%) | 441 (8.5%) |
| Bachelor's Degree or higher | 2,813 (87.7%) | 128 (4.0%) |
| Total | 10,167 (80.5%) | 935 (7.4%) |
Employment Occupations by Sex in Hazel Dell
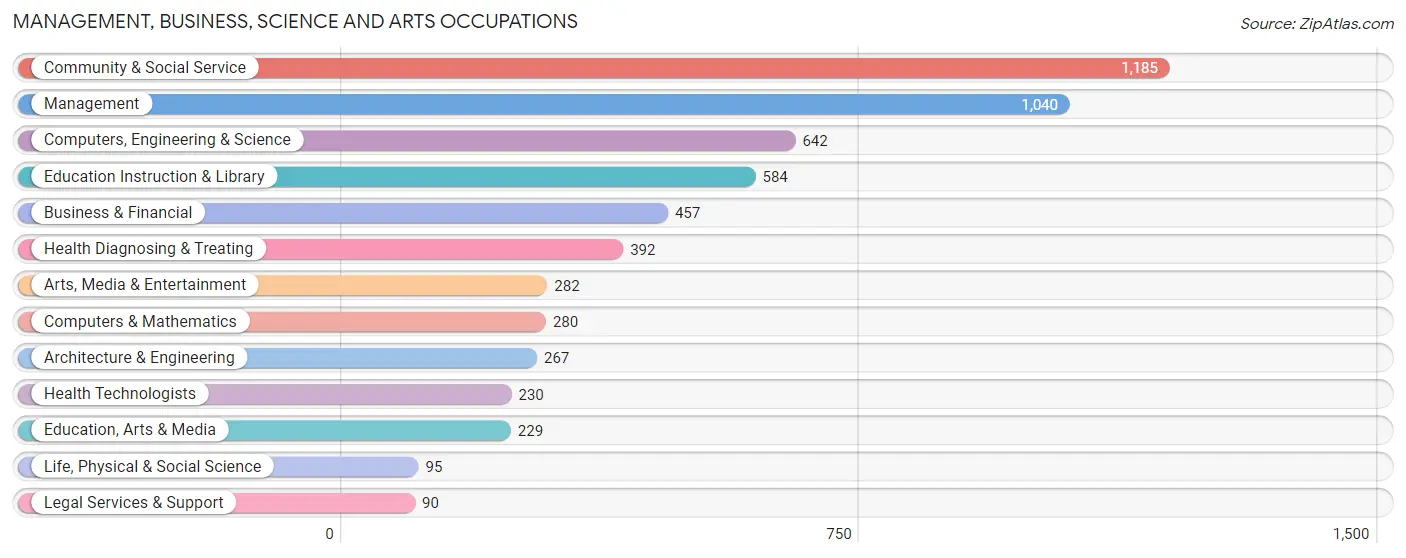
Management, Business, Science and Arts Occupations
The most common Management, Business, Science and Arts occupations in Hazel Dell are Community & Social Service (1,185 | 10.3%), Management (1,040 | 9.0%), Computers, Engineering & Science (642 | 5.6%), Education Instruction & Library (584 | 5.1%), and Business & Financial (457 | 4.0%).
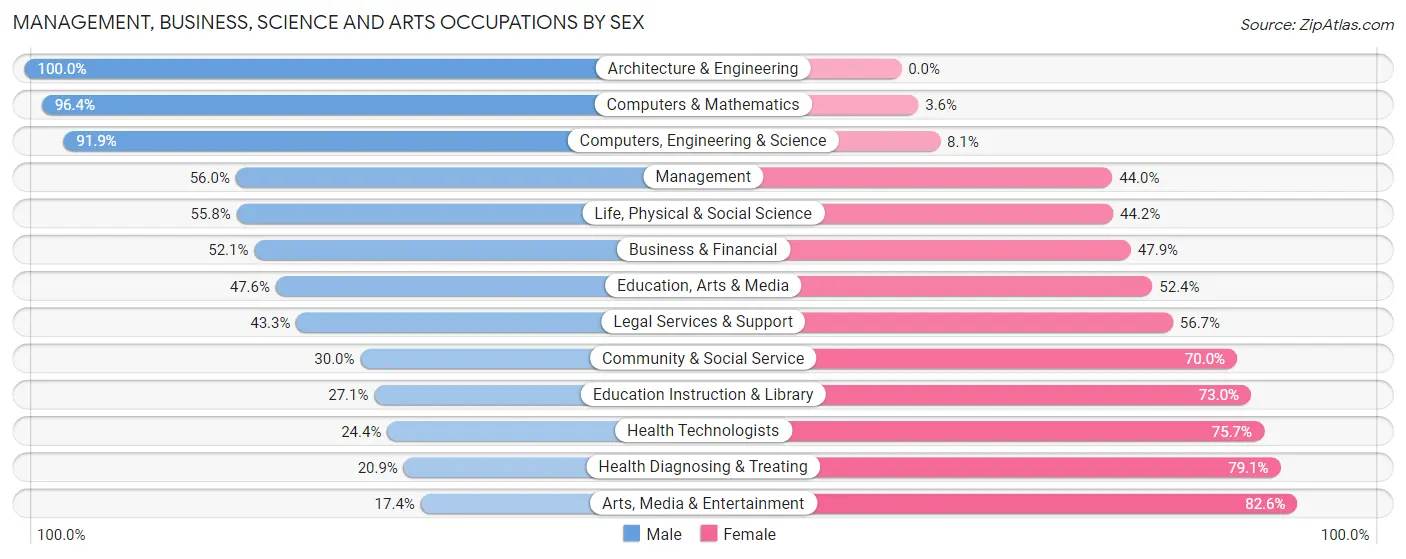
Management, Business, Science and Arts Occupations by Sex
Within the Management, Business, Science and Arts occupations in Hazel Dell, the most male-oriented occupations are Architecture & Engineering (100.0%), Computers & Mathematics (96.4%), and Computers, Engineering & Science (91.9%), while the most female-oriented occupations are Arts, Media & Entertainment (82.6%), Health Diagnosing & Treating (79.1%), and Health Technologists (75.6%).
| Occupation | Male | Female |
| Management | 582 (56.0%) | 458 (44.0%) |
| Business & Financial | 238 (52.1%) | 219 (47.9%) |
| Computers, Engineering & Science | 590 (91.9%) | 52 (8.1%) |
| Computers & Mathematics | 270 (96.4%) | 10 (3.6%) |
| Architecture & Engineering | 267 (100.0%) | 0 (0.0%) |
| Life, Physical & Social Science | 53 (55.8%) | 42 (44.2%) |
| Community & Social Service | 355 (30.0%) | 830 (70.0%) |
| Education, Arts & Media | 109 (47.6%) | 120 (52.4%) |
| Legal Services & Support | 39 (43.3%) | 51 (56.7%) |
| Education Instruction & Library | 158 (27.1%) | 426 (73.0%) |
| Arts, Media & Entertainment | 49 (17.4%) | 233 (82.6%) |
| Health Diagnosing & Treating | 82 (20.9%) | 310 (79.1%) |
| Health Technologists | 56 (24.3%) | 174 (75.6%) |
| Total (Category) | 1,847 (49.7%) | 1,869 (50.3%) |
| Total (Overall) | 6,669 (57.9%) | 4,844 (42.1%) |
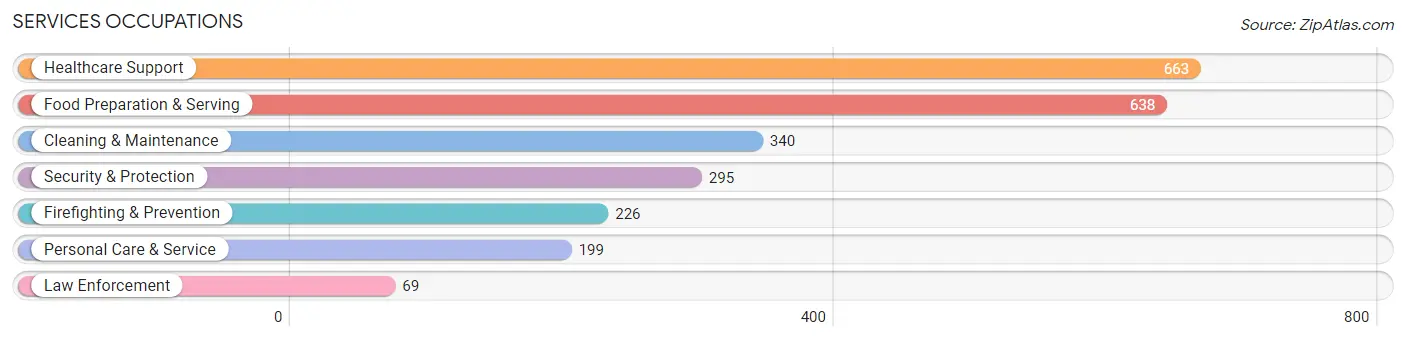
Services Occupations
The most common Services occupations in Hazel Dell are Healthcare Support (663 | 5.8%), Food Preparation & Serving (638 | 5.5%), Cleaning & Maintenance (340 | 2.9%), Security & Protection (295 | 2.6%), and Firefighting & Prevention (226 | 2.0%).
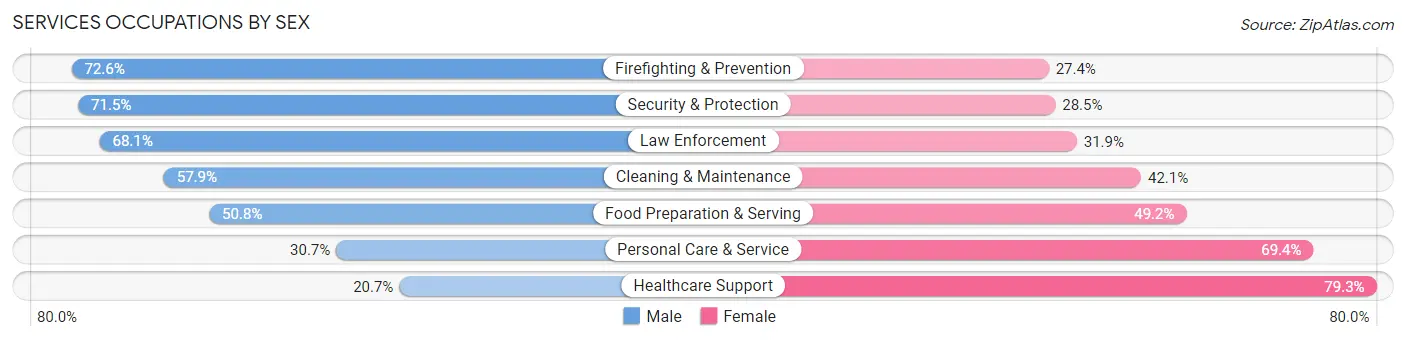
Services Occupations by Sex
Within the Services occupations in Hazel Dell, the most male-oriented occupations are Firefighting & Prevention (72.6%), Security & Protection (71.5%), and Law Enforcement (68.1%), while the most female-oriented occupations are Healthcare Support (79.3%), Personal Care & Service (69.4%), and Food Preparation & Serving (49.2%).
| Occupation | Male | Female |
| Healthcare Support | 137 (20.7%) | 526 (79.3%) |
| Security & Protection | 211 (71.5%) | 84 (28.5%) |
| Firefighting & Prevention | 164 (72.6%) | 62 (27.4%) |
| Law Enforcement | 47 (68.1%) | 22 (31.9%) |
| Food Preparation & Serving | 324 (50.8%) | 314 (49.2%) |
| Cleaning & Maintenance | 197 (57.9%) | 143 (42.1%) |
| Personal Care & Service | 61 (30.6%) | 138 (69.4%) |
| Total (Category) | 930 (43.6%) | 1,205 (56.4%) |
| Total (Overall) | 6,669 (57.9%) | 4,844 (42.1%) |
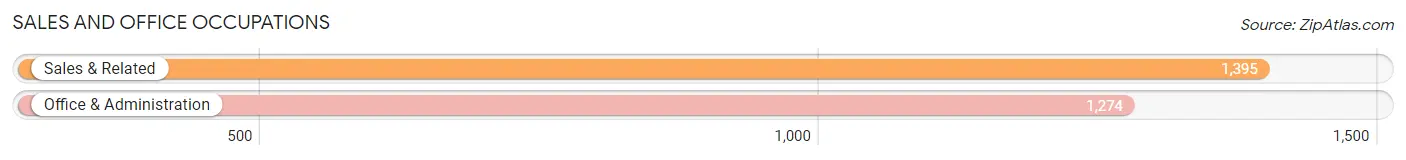
Sales and Office Occupations
The most common Sales and Office occupations in Hazel Dell are Sales & Related (1,395 | 12.1%), and Office & Administration (1,274 | 11.1%).
Sales and Office Occupations by Sex
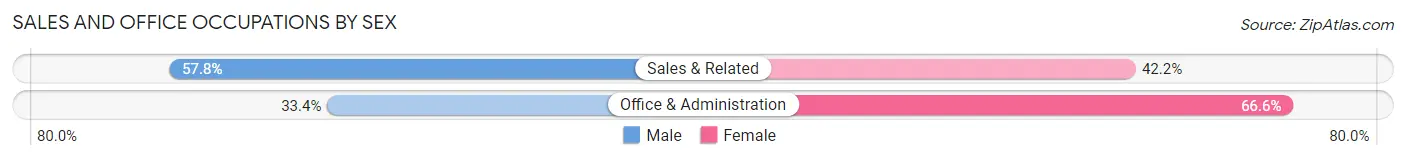
| Occupation | Male | Female |
| Sales & Related | 806 (57.8%) | 589 (42.2%) |
| Office & Administration | 426 (33.4%) | 848 (66.6%) |
| Total (Category) | 1,232 (46.2%) | 1,437 (53.8%) |
| Total (Overall) | 6,669 (57.9%) | 4,844 (42.1%) |
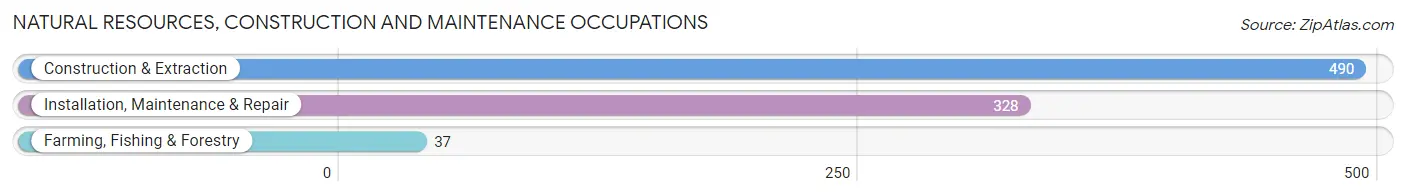
Natural Resources, Construction and Maintenance Occupations
The most common Natural Resources, Construction and Maintenance occupations in Hazel Dell are Construction & Extraction (490 | 4.3%), Installation, Maintenance & Repair (328 | 2.9%), and Farming, Fishing & Forestry (37 | 0.3%).
Natural Resources, Construction and Maintenance Occupations by Sex
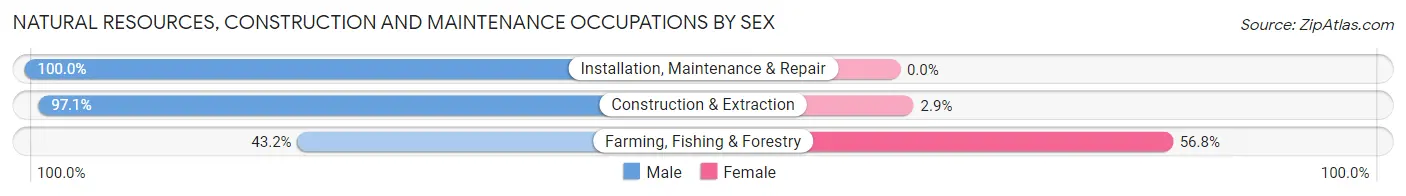
| Occupation | Male | Female |
| Farming, Fishing & Forestry | 16 (43.2%) | 21 (56.8%) |
| Construction & Extraction | 476 (97.1%) | 14 (2.9%) |
| Installation, Maintenance & Repair | 328 (100.0%) | 0 (0.0%) |
| Total (Category) | 820 (95.9%) | 35 (4.1%) |
| Total (Overall) | 6,669 (57.9%) | 4,844 (42.1%) |
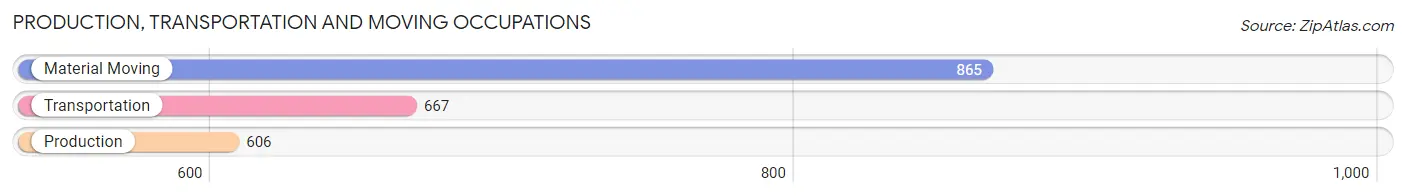
Production, Transportation and Moving Occupations
The most common Production, Transportation and Moving occupations in Hazel Dell are Material Moving (865 | 7.5%), Transportation (667 | 5.8%), and Production (606 | 5.3%).
Production, Transportation and Moving Occupations by Sex
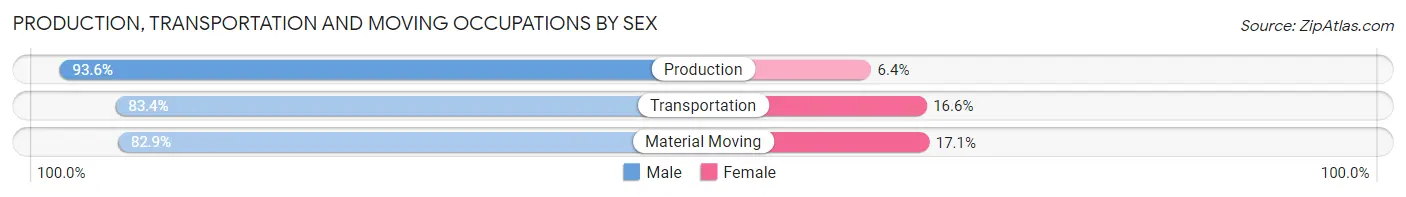
| Occupation | Male | Female |
| Production | 567 (93.6%) | 39 (6.4%) |
| Transportation | 556 (83.4%) | 111 (16.6%) |
| Material Moving | 717 (82.9%) | 148 (17.1%) |
| Total (Category) | 1,840 (86.1%) | 298 (13.9%) |
| Total (Overall) | 6,669 (57.9%) | 4,844 (42.1%) |
Employment Industries by Sex in Hazel Dell
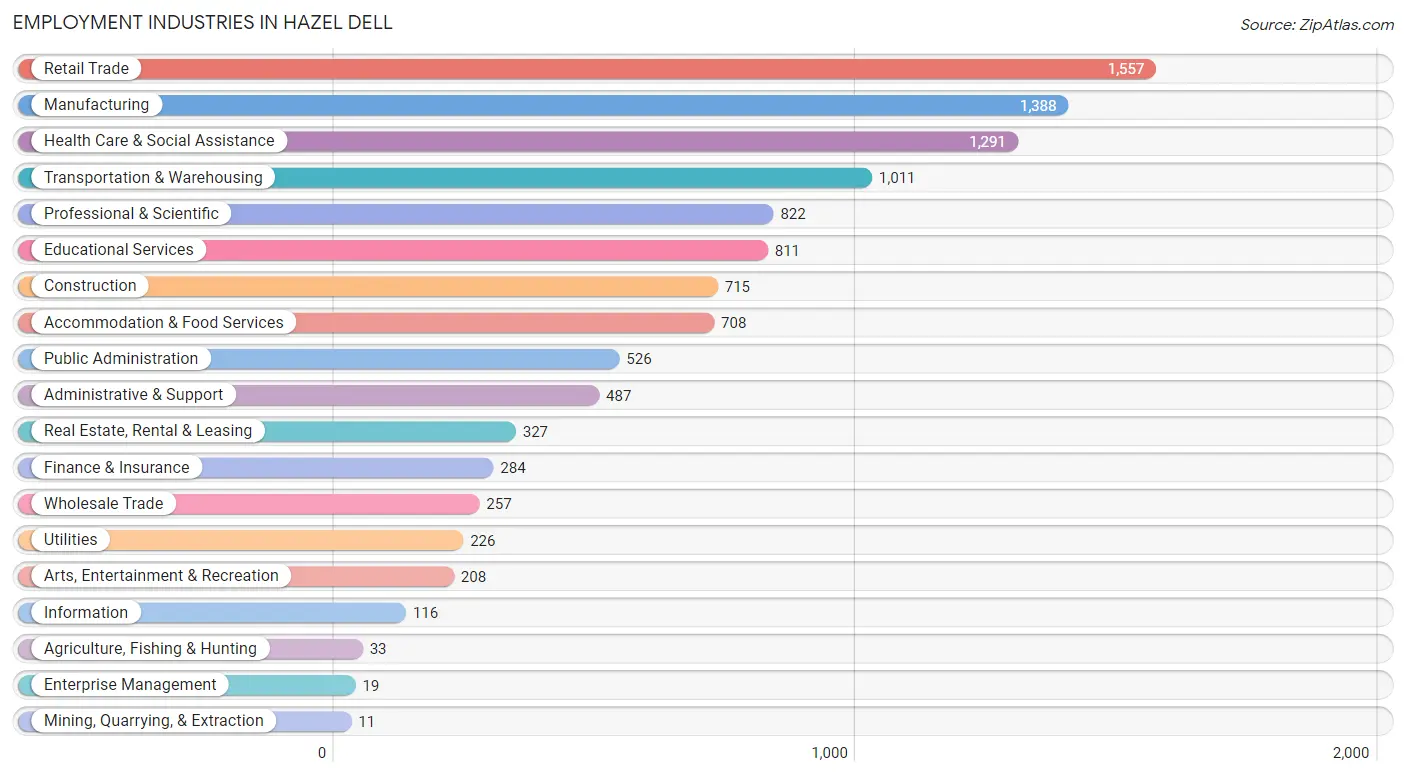
Employment Industries in Hazel Dell
The major employment industries in Hazel Dell include Retail Trade (1,557 | 13.5%), Manufacturing (1,388 | 12.1%), Health Care & Social Assistance (1,291 | 11.2%), Transportation & Warehousing (1,011 | 8.8%), and Professional & Scientific (822 | 7.1%).
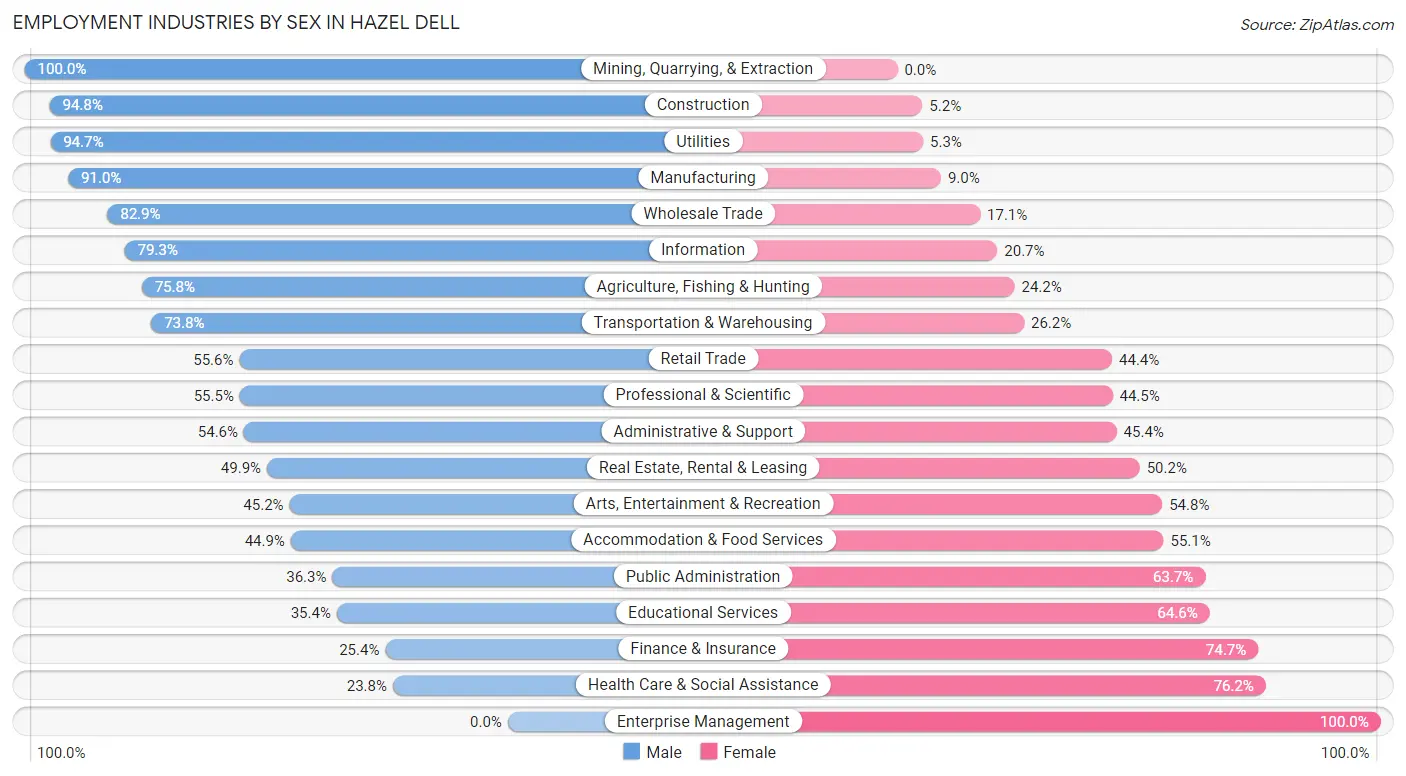
Employment Industries by Sex in Hazel Dell
The Hazel Dell industries that see more men than women are Mining, Quarrying, & Extraction (100.0%), Construction (94.8%), and Utilities (94.7%), whereas the industries that tend to have a higher number of women are Enterprise Management (100.0%), Health Care & Social Assistance (76.2%), and Finance & Insurance (74.7%).
| Industry | Male | Female |
| Agriculture, Fishing & Hunting | 25 (75.8%) | 8 (24.2%) |
| Mining, Quarrying, & Extraction | 11 (100.0%) | 0 (0.0%) |
| Construction | 678 (94.8%) | 37 (5.2%) |
| Manufacturing | 1,263 (91.0%) | 125 (9.0%) |
| Wholesale Trade | 213 (82.9%) | 44 (17.1%) |
| Retail Trade | 865 (55.6%) | 692 (44.4%) |
| Transportation & Warehousing | 746 (73.8%) | 265 (26.2%) |
| Utilities | 214 (94.7%) | 12 (5.3%) |
| Information | 92 (79.3%) | 24 (20.7%) |
| Finance & Insurance | 72 (25.4%) | 212 (74.7%) |
| Real Estate, Rental & Leasing | 163 (49.8%) | 164 (50.1%) |
| Professional & Scientific | 456 (55.5%) | 366 (44.5%) |
| Enterprise Management | 0 (0.0%) | 19 (100.0%) |
| Administrative & Support | 266 (54.6%) | 221 (45.4%) |
| Educational Services | 287 (35.4%) | 524 (64.6%) |
| Health Care & Social Assistance | 307 (23.8%) | 984 (76.2%) |
| Arts, Entertainment & Recreation | 94 (45.2%) | 114 (54.8%) |
| Accommodation & Food Services | 318 (44.9%) | 390 (55.1%) |
| Public Administration | 191 (36.3%) | 335 (63.7%) |
| Total | 6,669 (57.9%) | 4,844 (42.1%) |
Education in Hazel Dell
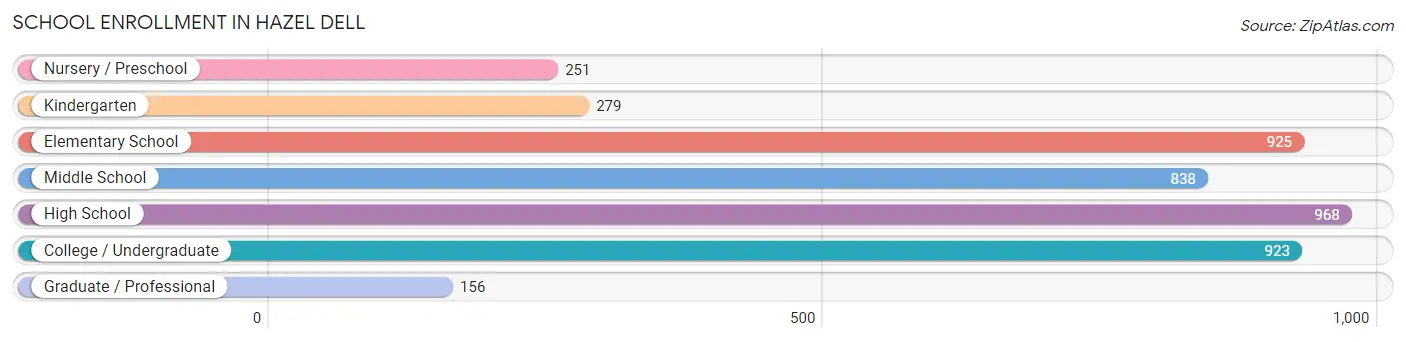
School Enrollment in Hazel Dell
The most common levels of schooling among the 4,340 students in Hazel Dell are high school (968 | 22.3%), elementary school (925 | 21.3%), and college / undergraduate (923 | 21.3%).
| School Level | # Students | % Students |
| Nursery / Preschool | 251 | 5.8% |
| Kindergarten | 279 | 6.4% |
| Elementary School | 925 | 21.3% |
| Middle School | 838 | 19.3% |
| High School | 968 | 22.3% |
| College / Undergraduate | 923 | 21.3% |
| Graduate / Professional | 156 | 3.6% |
| Total | 4,340 | 100.0% |
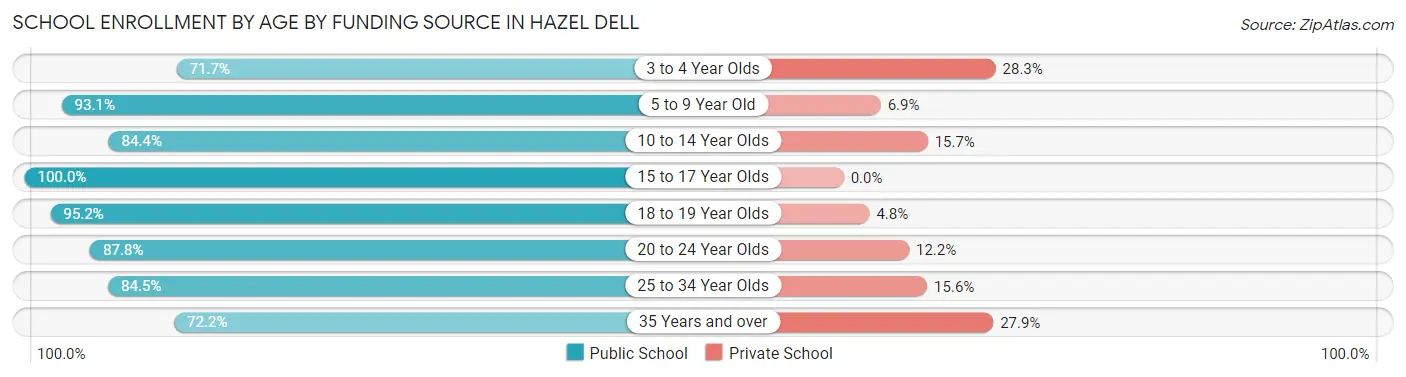
School Enrollment by Age by Funding Source in Hazel Dell
Out of a total of 4,340 students who are enrolled in schools in Hazel Dell, 473 (10.9%) attend a private institution, while the remaining 3,867 (89.1%) are enrolled in public schools. The age group of 3 to 4 year olds has the highest likelihood of being enrolled in private schools, with 60 (28.3% in the age bracket) enrolled. Conversely, the age group of 15 to 17 year olds has the lowest likelihood of being enrolled in a private school, with 819 (100.0% in the age bracket) attending a public institution.
| Age Bracket | Public School | Private School |
| 3 to 4 Year Olds | 152 (71.7%) | 60 (28.3%) |
| 5 to 9 Year Old | 1,025 (93.1%) | 76 (6.9%) |
| 10 to 14 Year Olds | 900 (84.4%) | 167 (15.7%) |
| 15 to 17 Year Olds | 819 (100.0%) | 0 (0.0%) |
| 18 to 19 Year Olds | 198 (95.2%) | 10 (4.8%) |
| 20 to 24 Year Olds | 339 (87.8%) | 47 (12.2%) |
| 25 to 34 Year Olds | 277 (84.5%) | 51 (15.5%) |
| 35 Years and over | 158 (72.2%) | 61 (27.9%) |
| Total | 3,867 (89.1%) | 473 (10.9%) |
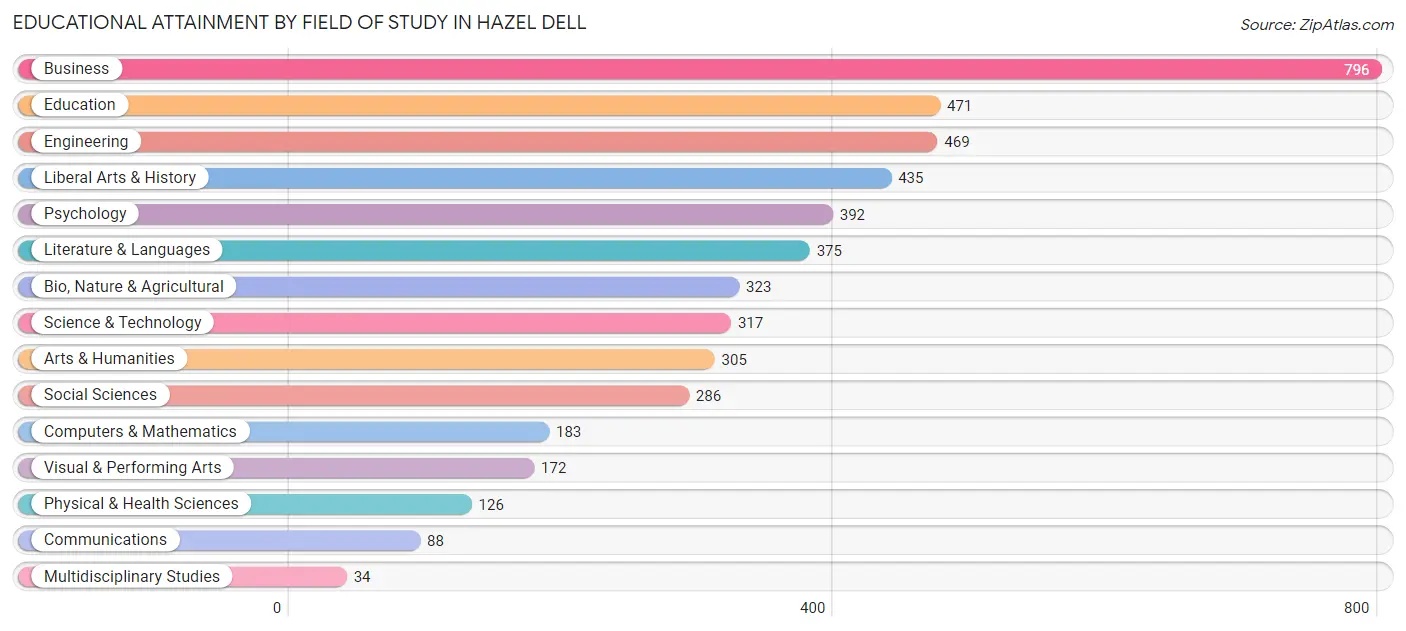
Educational Attainment by Field of Study in Hazel Dell
Business (796 | 16.7%), education (471 | 9.9%), engineering (469 | 9.8%), liberal arts & history (435 | 9.1%), and psychology (392 | 8.2%) are the most common fields of study among 4,772 individuals in Hazel Dell who have obtained a bachelor's degree or higher.
| Field of Study | # Graduates | % Graduates |
| Computers & Mathematics | 183 | 3.8% |
| Bio, Nature & Agricultural | 323 | 6.8% |
| Physical & Health Sciences | 126 | 2.6% |
| Psychology | 392 | 8.2% |
| Social Sciences | 286 | 6.0% |
| Engineering | 469 | 9.8% |
| Multidisciplinary Studies | 34 | 0.7% |
| Science & Technology | 317 | 6.6% |
| Business | 796 | 16.7% |
| Education | 471 | 9.9% |
| Literature & Languages | 375 | 7.9% |
| Liberal Arts & History | 435 | 9.1% |
| Visual & Performing Arts | 172 | 3.6% |
| Communications | 88 | 1.8% |
| Arts & Humanities | 305 | 6.4% |
| Total | 4,772 | 100.0% |
Transportation & Commute in Hazel Dell
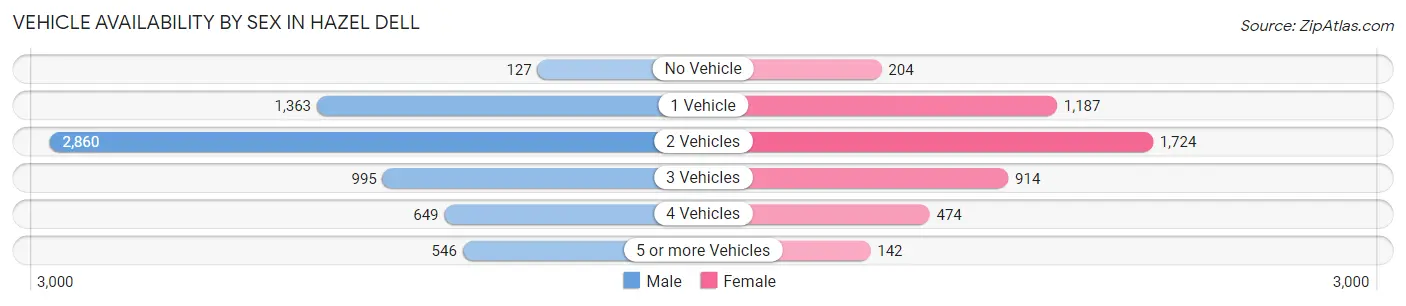
Vehicle Availability by Sex in Hazel Dell
The most prevalent vehicle ownership categories in Hazel Dell are males with 2 vehicles (2,860, accounting for 43.7%) and females with 2 vehicles (1,724, making up 61.6%).
| Vehicles Available | Male | Female |
| No Vehicle | 127 (1.9%) | 204 (4.4%) |
| 1 Vehicle | 1,363 (20.8%) | 1,187 (25.6%) |
| 2 Vehicles | 2,860 (43.7%) | 1,724 (37.1%) |
| 3 Vehicles | 995 (15.2%) | 914 (19.7%) |
| 4 Vehicles | 649 (9.9%) | 474 (10.2%) |
| 5 or more Vehicles | 546 (8.4%) | 142 (3.1%) |
| Total | 6,540 (100.0%) | 4,645 (100.0%) |
Commute Time in Hazel Dell
The most frequently occuring commute durations in Hazel Dell are 20 to 24 minutes (1,882 commuters, 19.6%), 15 to 19 minutes (1,822 commuters, 19.0%), and 10 to 14 minutes (1,617 commuters, 16.8%).
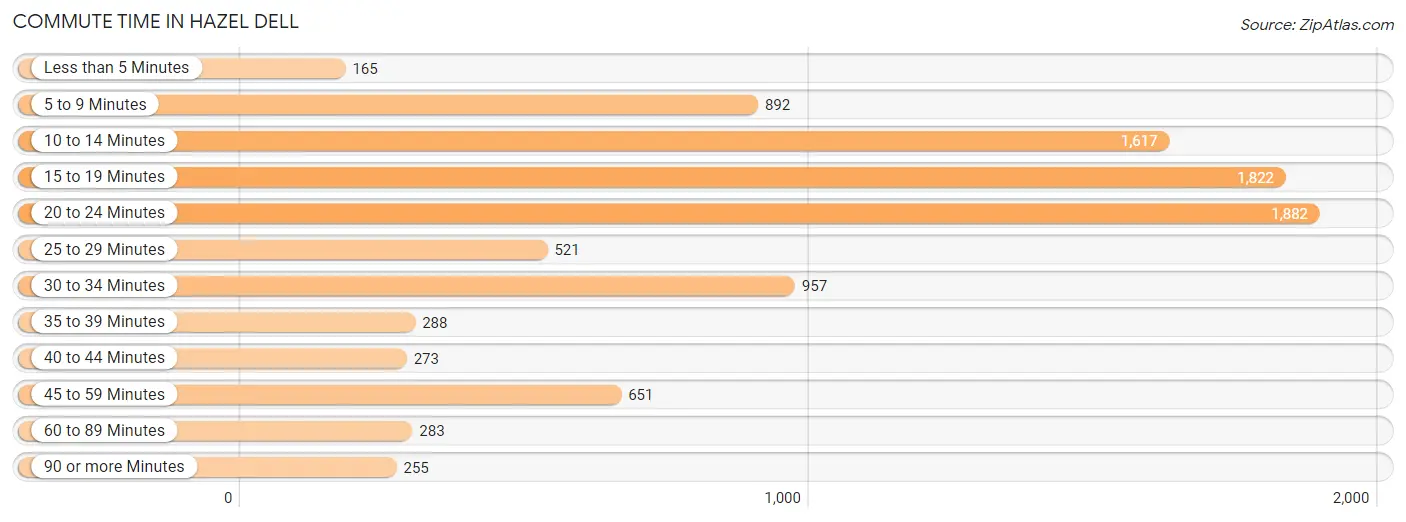
| Commute Time | # Commuters | % Commuters |
| Less than 5 Minutes | 165 | 1.7% |
| 5 to 9 Minutes | 892 | 9.3% |
| 10 to 14 Minutes | 1,617 | 16.8% |
| 15 to 19 Minutes | 1,822 | 19.0% |
| 20 to 24 Minutes | 1,882 | 19.6% |
| 25 to 29 Minutes | 521 | 5.4% |
| 30 to 34 Minutes | 957 | 10.0% |
| 35 to 39 Minutes | 288 | 3.0% |
| 40 to 44 Minutes | 273 | 2.8% |
| 45 to 59 Minutes | 651 | 6.8% |
| 60 to 89 Minutes | 283 | 2.9% |
| 90 or more Minutes | 255 | 2.6% |
Commute Time by Sex in Hazel Dell
The most common commute times in Hazel Dell are 15 to 19 minutes (1,198 commuters, 21.3%) for males and 10 to 14 minutes (873 commuters, 21.9%) for females.
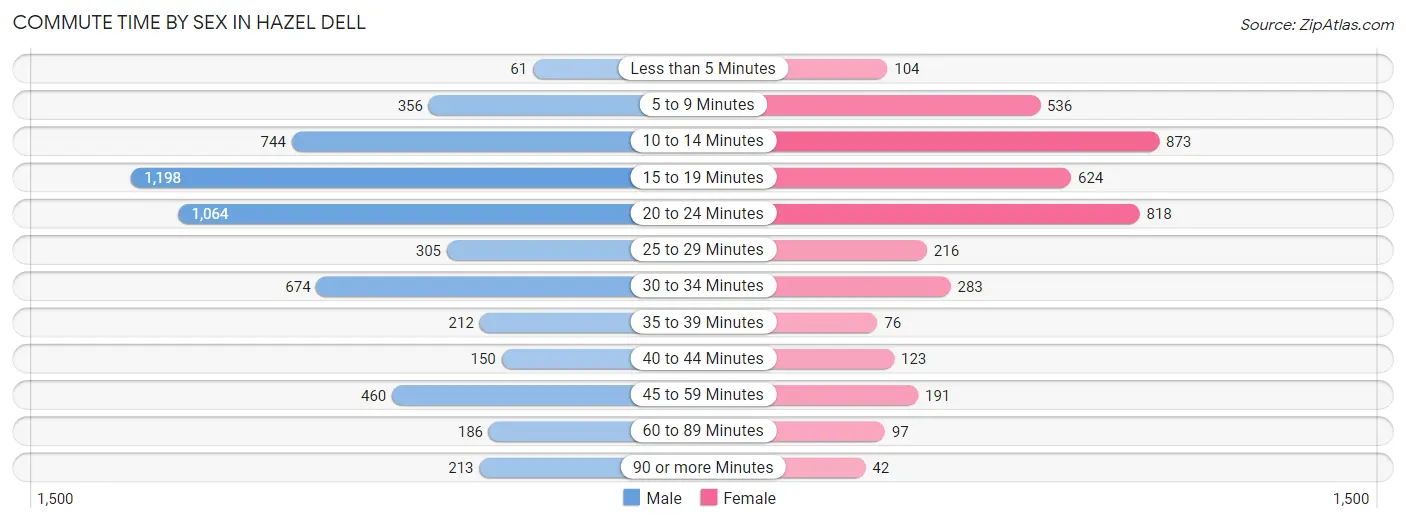
| Commute Time | Male | Female |
| Less than 5 Minutes | 61 (1.1%) | 104 (2.6%) |
| 5 to 9 Minutes | 356 (6.3%) | 536 (13.5%) |
| 10 to 14 Minutes | 744 (13.2%) | 873 (21.9%) |
| 15 to 19 Minutes | 1,198 (21.3%) | 624 (15.7%) |
| 20 to 24 Minutes | 1,064 (18.9%) | 818 (20.5%) |
| 25 to 29 Minutes | 305 (5.4%) | 216 (5.4%) |
| 30 to 34 Minutes | 674 (12.0%) | 283 (7.1%) |
| 35 to 39 Minutes | 212 (3.8%) | 76 (1.9%) |
| 40 to 44 Minutes | 150 (2.7%) | 123 (3.1%) |
| 45 to 59 Minutes | 460 (8.2%) | 191 (4.8%) |
| 60 to 89 Minutes | 186 (3.3%) | 97 (2.4%) |
| 90 or more Minutes | 213 (3.8%) | 42 (1.1%) |
Time of Departure to Work by Sex in Hazel Dell
The most frequent times of departure to work in Hazel Dell are 6:00 AM to 6:29 AM (924, 16.4%) for males and 7:30 AM to 7:59 AM (623, 15.6%) for females.
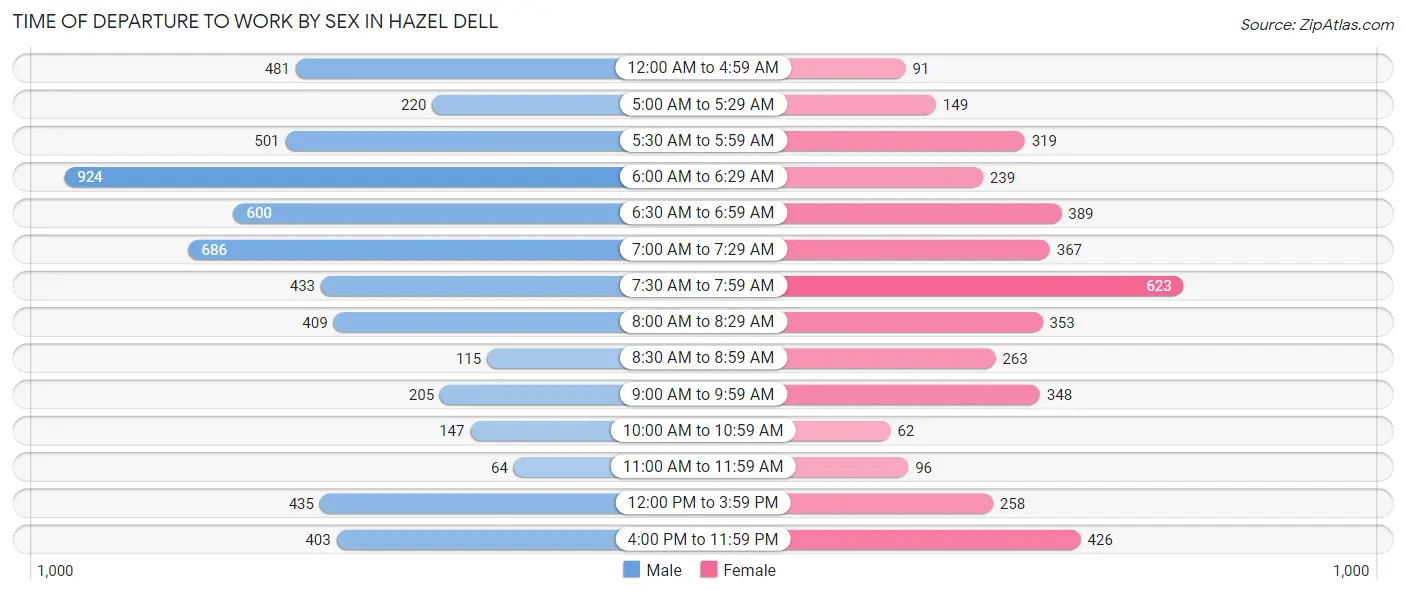
| Time of Departure | Male | Female |
| 12:00 AM to 4:59 AM | 481 (8.6%) | 91 (2.3%) |
| 5:00 AM to 5:29 AM | 220 (3.9%) | 149 (3.7%) |
| 5:30 AM to 5:59 AM | 501 (8.9%) | 319 (8.0%) |
| 6:00 AM to 6:29 AM | 924 (16.4%) | 239 (6.0%) |
| 6:30 AM to 6:59 AM | 600 (10.7%) | 389 (9.8%) |
| 7:00 AM to 7:29 AM | 686 (12.2%) | 367 (9.2%) |
| 7:30 AM to 7:59 AM | 433 (7.7%) | 623 (15.6%) |
| 8:00 AM to 8:29 AM | 409 (7.3%) | 353 (8.9%) |
| 8:30 AM to 8:59 AM | 115 (2.1%) | 263 (6.6%) |
| 9:00 AM to 9:59 AM | 205 (3.6%) | 348 (8.7%) |
| 10:00 AM to 10:59 AM | 147 (2.6%) | 62 (1.6%) |
| 11:00 AM to 11:59 AM | 64 (1.1%) | 96 (2.4%) |
| 12:00 PM to 3:59 PM | 435 (7.7%) | 258 (6.5%) |
| 4:00 PM to 11:59 PM | 403 (7.2%) | 426 (10.7%) |
| Total | 5,623 (100.0%) | 3,983 (100.0%) |
Housing Occupancy in Hazel Dell
Occupancy by Ownership in Hazel Dell
Of the total 9,533 dwellings in Hazel Dell, owner-occupied units account for 5,310 (55.7%), while renter-occupied units make up 4,223 (44.3%).
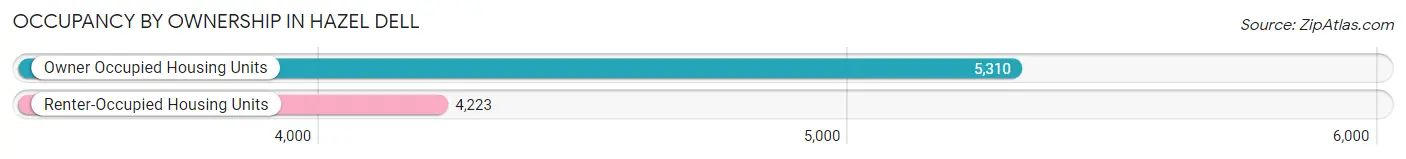
| Occupancy | # Housing Units | % Housing Units |
| Owner Occupied Housing Units | 5,310 | 55.7% |
| Renter-Occupied Housing Units | 4,223 | 44.3% |
| Total Occupied Housing Units | 9,533 | 100.0% |
Occupancy by Household Size in Hazel Dell
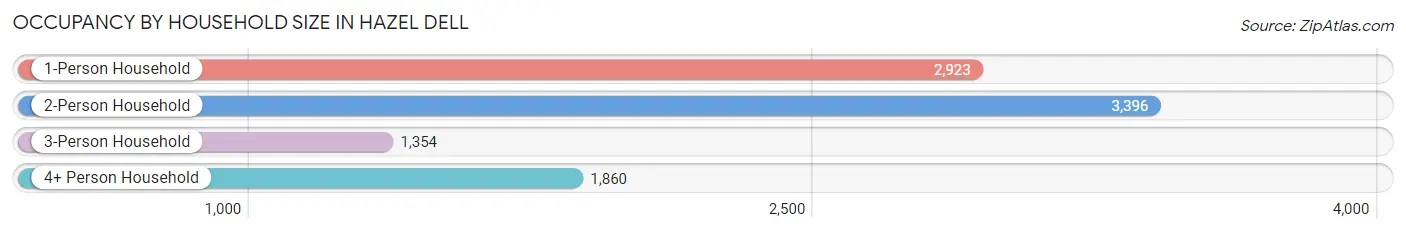
| Household Size | # Housing Units | % Housing Units |
| 1-Person Household | 2,923 | 30.7% |
| 2-Person Household | 3,396 | 35.6% |
| 3-Person Household | 1,354 | 14.2% |
| 4+ Person Household | 1,860 | 19.5% |
| Total Housing Units | 9,533 | 100.0% |
Occupancy by Ownership by Household Size in Hazel Dell
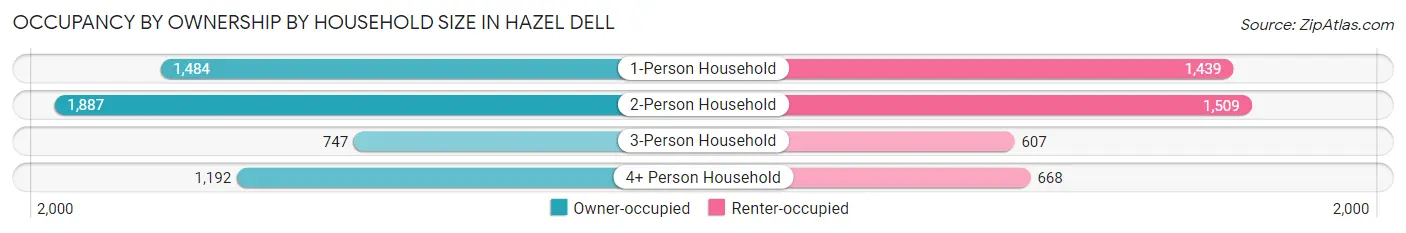
| Household Size | Owner-occupied | Renter-occupied |
| 1-Person Household | 1,484 (50.8%) | 1,439 (49.2%) |
| 2-Person Household | 1,887 (55.6%) | 1,509 (44.4%) |
| 3-Person Household | 747 (55.2%) | 607 (44.8%) |
| 4+ Person Household | 1,192 (64.1%) | 668 (35.9%) |
| Total Housing Units | 5,310 (55.7%) | 4,223 (44.3%) |
Occupancy by Educational Attainment in Hazel Dell
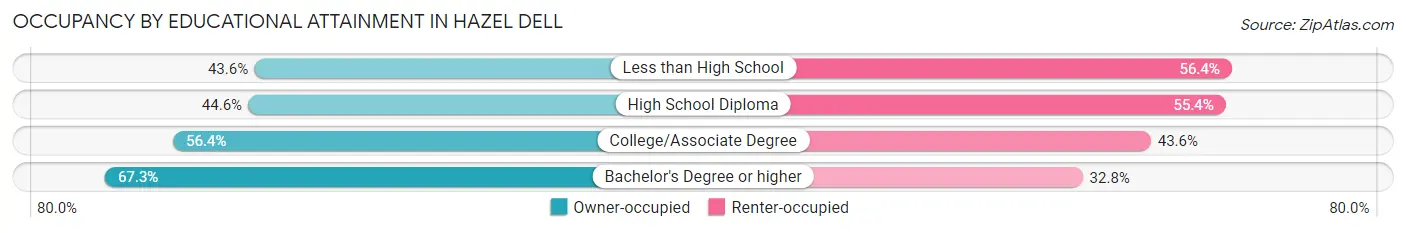
| Household Size | Owner-occupied | Renter-occupied |
| Less than High School | 205 (43.6%) | 265 (56.4%) |
| High School Diploma | 1,081 (44.6%) | 1,344 (55.4%) |
| College/Associate Degree | 2,297 (56.4%) | 1,773 (43.6%) |
| Bachelor's Degree or higher | 1,727 (67.2%) | 841 (32.8%) |
Occupancy by Age of Householder in Hazel Dell
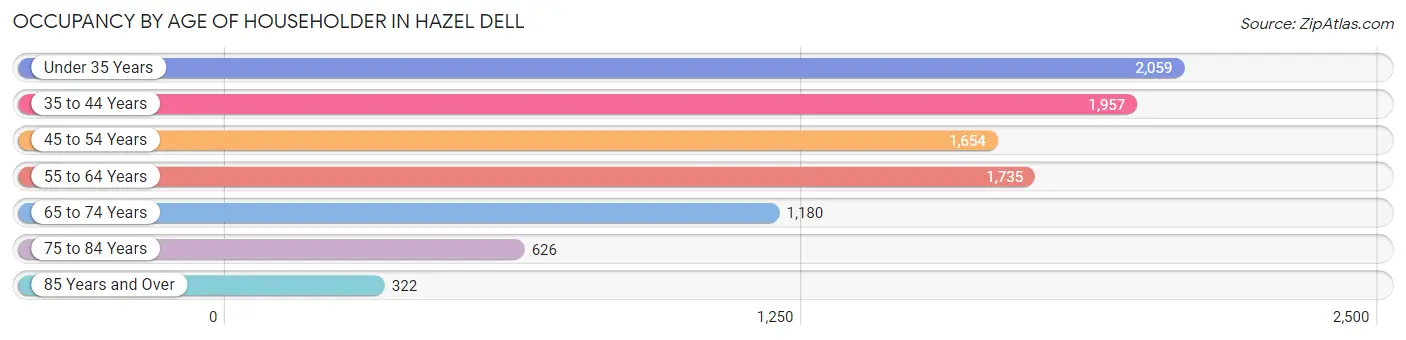
| Age Bracket | # Households | % Households |
| Under 35 Years | 2,059 | 21.6% |
| 35 to 44 Years | 1,957 | 20.5% |
| 45 to 54 Years | 1,654 | 17.3% |
| 55 to 64 Years | 1,735 | 18.2% |
| 65 to 74 Years | 1,180 | 12.4% |
| 75 to 84 Years | 626 | 6.6% |
| 85 Years and Over | 322 | 3.4% |
| Total | 9,533 | 100.0% |
Housing Finances in Hazel Dell
Median Income by Occupancy in Hazel Dell
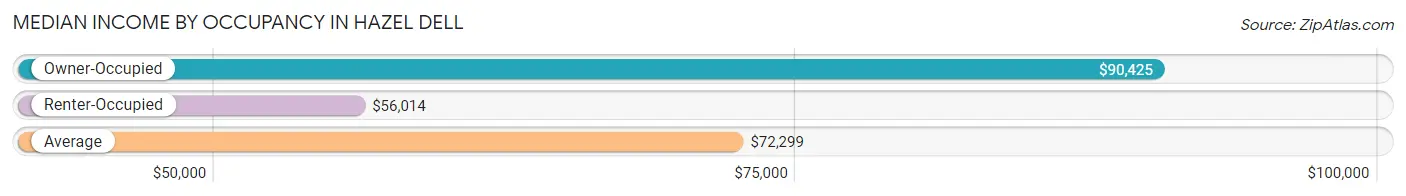
| Occupancy Type | # Households | Median Income |
| Owner-Occupied | 5,310 (55.7%) | $90,425 |
| Renter-Occupied | 4,223 (44.3%) | $56,014 |
| Average | 9,533 (100.0%) | $72,299 |
Occupancy by Householder Income Bracket in Hazel Dell
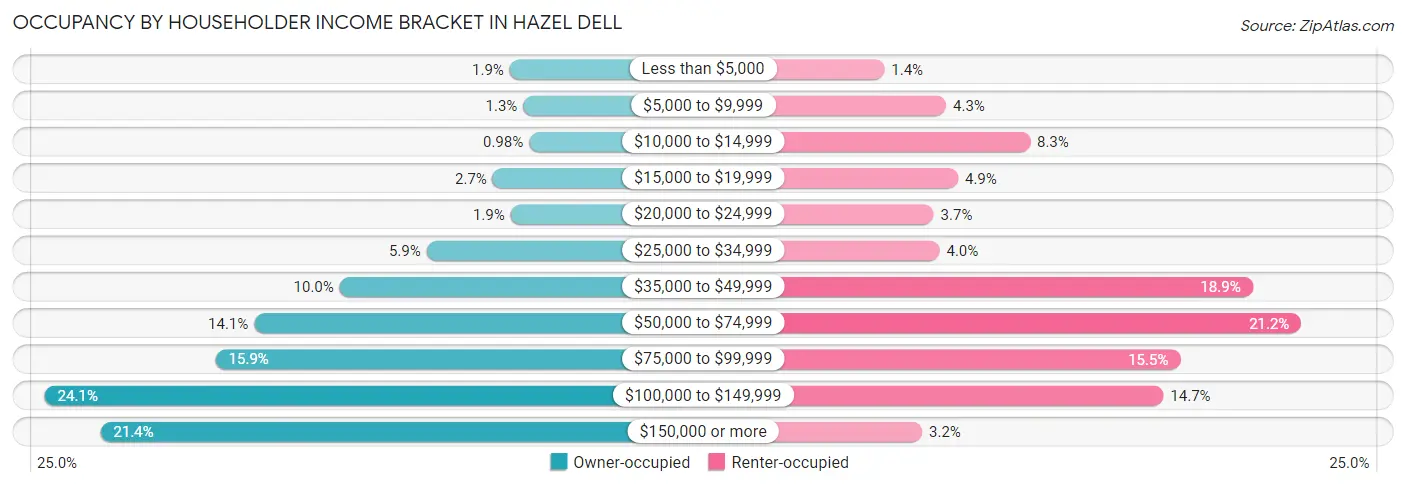
| Income Bracket | Owner-occupied | Renter-occupied |
| Less than $5,000 | 101 (1.9%) | 58 (1.4%) |
| $5,000 to $9,999 | 67 (1.3%) | 182 (4.3%) |
| $10,000 to $14,999 | 52 (1.0%) | 351 (8.3%) |
| $15,000 to $19,999 | 144 (2.7%) | 206 (4.9%) |
| $20,000 to $24,999 | 99 (1.9%) | 157 (3.7%) |
| $25,000 to $34,999 | 311 (5.9%) | 169 (4.0%) |
| $35,000 to $49,999 | 531 (10.0%) | 798 (18.9%) |
| $50,000 to $74,999 | 747 (14.1%) | 896 (21.2%) |
| $75,000 to $99,999 | 845 (15.9%) | 653 (15.5%) |
| $100,000 to $149,999 | 1,277 (24.0%) | 619 (14.7%) |
| $150,000 or more | 1,136 (21.4%) | 134 (3.2%) |
| Total | 5,310 (100.0%) | 4,223 (100.0%) |
Monthly Housing Cost Tiers in Hazel Dell
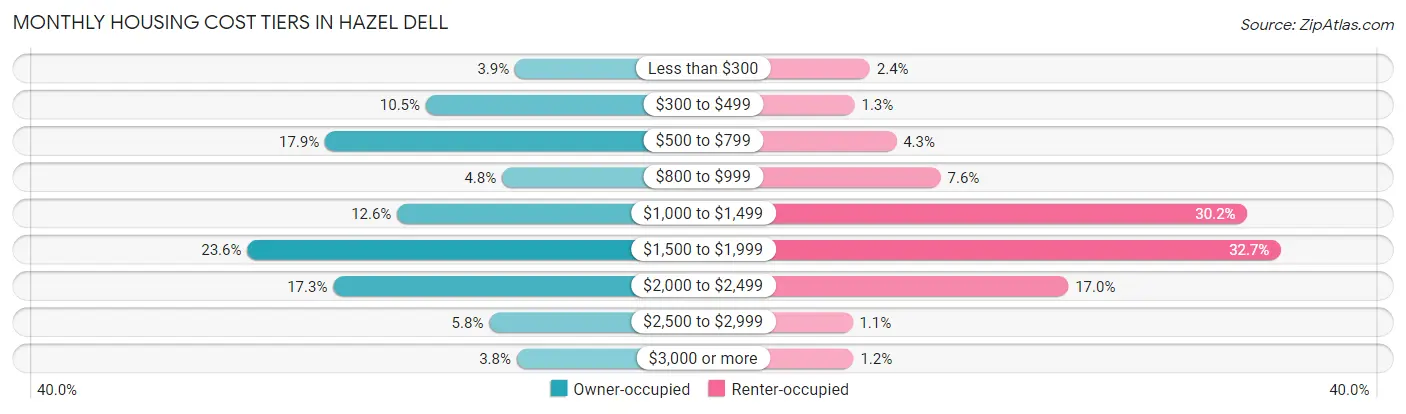
| Monthly Cost | Owner-occupied | Renter-occupied |
| Less than $300 | 206 (3.9%) | 101 (2.4%) |
| $300 to $499 | 555 (10.4%) | 53 (1.3%) |
| $500 to $799 | 949 (17.9%) | 183 (4.3%) |
| $800 to $999 | 257 (4.8%) | 321 (7.6%) |
| $1,000 to $1,499 | 667 (12.6%) | 1,275 (30.2%) |
| $1,500 to $1,999 | 1,253 (23.6%) | 1,380 (32.7%) |
| $2,000 to $2,499 | 917 (17.3%) | 718 (17.0%) |
| $2,500 to $2,999 | 307 (5.8%) | 47 (1.1%) |
| $3,000 or more | 199 (3.7%) | 50 (1.2%) |
| Total | 5,310 (100.0%) | 4,223 (100.0%) |
Physical Housing Characteristics in Hazel Dell
Housing Structures in Hazel Dell
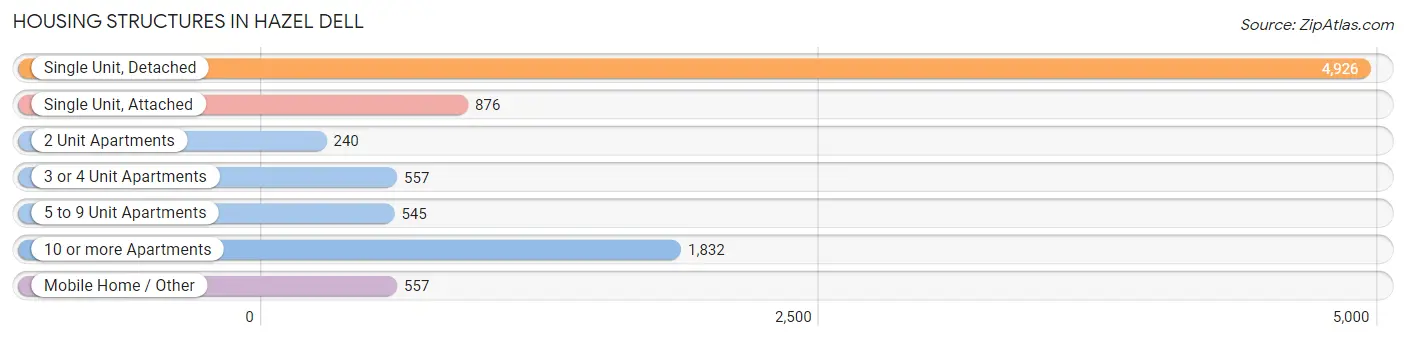
| Structure Type | # Housing Units | % Housing Units |
| Single Unit, Detached | 4,926 | 51.7% |
| Single Unit, Attached | 876 | 9.2% |
| 2 Unit Apartments | 240 | 2.5% |
| 3 or 4 Unit Apartments | 557 | 5.8% |
| 5 to 9 Unit Apartments | 545 | 5.7% |
| 10 or more Apartments | 1,832 | 19.2% |
| Mobile Home / Other | 557 | 5.8% |
| Total | 9,533 | 100.0% |
Housing Structures by Occupancy in Hazel Dell
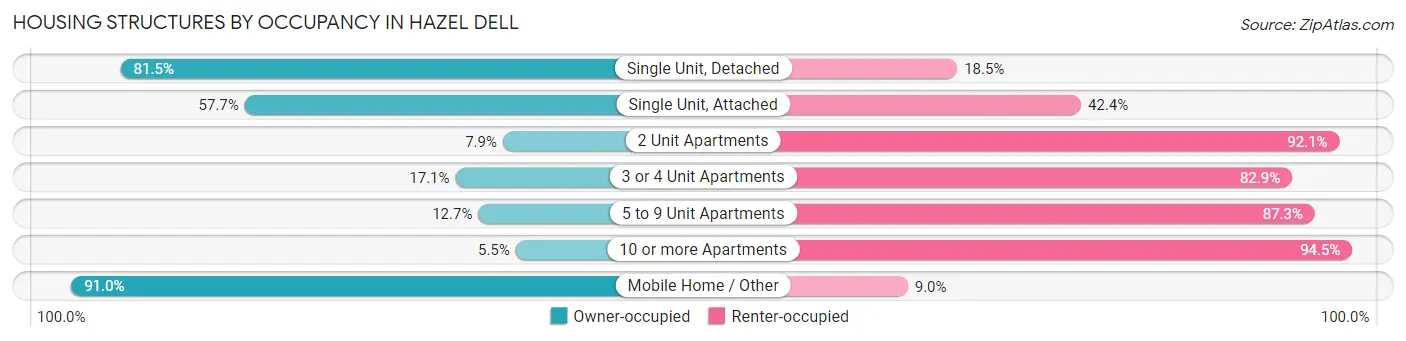
| Structure Type | Owner-occupied | Renter-occupied |
| Single Unit, Detached | 4,015 (81.5%) | 911 (18.5%) |
| Single Unit, Attached | 505 (57.7%) | 371 (42.3%) |
| 2 Unit Apartments | 19 (7.9%) | 221 (92.1%) |
| 3 or 4 Unit Apartments | 95 (17.1%) | 462 (82.9%) |
| 5 to 9 Unit Apartments | 69 (12.7%) | 476 (87.3%) |
| 10 or more Apartments | 100 (5.5%) | 1,732 (94.5%) |
| Mobile Home / Other | 507 (91.0%) | 50 (9.0%) |
| Total | 5,310 (55.7%) | 4,223 (44.3%) |
Housing Structures by Number of Rooms in Hazel Dell
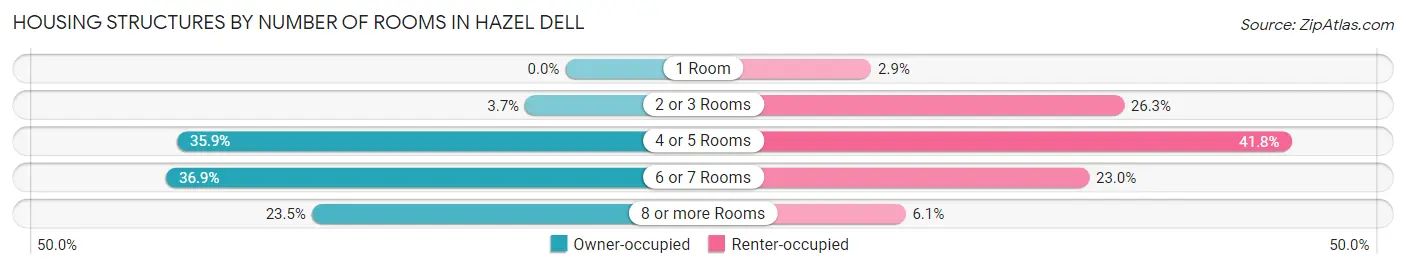
| Number of Rooms | Owner-occupied | Renter-occupied |
| 1 Room | 0 (0.0%) | 122 (2.9%) |
| 2 or 3 Rooms | 198 (3.7%) | 1,109 (26.3%) |
| 4 or 5 Rooms | 1,907 (35.9%) | 1,763 (41.7%) |
| 6 or 7 Rooms | 1,960 (36.9%) | 973 (23.0%) |
| 8 or more Rooms | 1,245 (23.4%) | 256 (6.1%) |
| Total | 5,310 (100.0%) | 4,223 (100.0%) |
Housing Structure by Heating Type in Hazel Dell
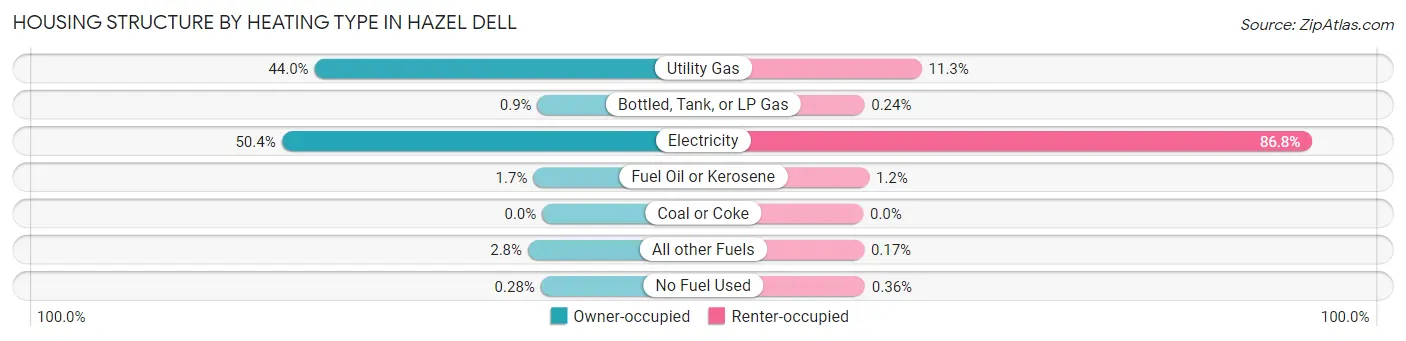
| Heating Type | Owner-occupied | Renter-occupied |
| Utility Gas | 2,336 (44.0%) | 478 (11.3%) |
| Bottled, Tank, or LP Gas | 48 (0.9%) | 10 (0.2%) |
| Electricity | 2,674 (50.4%) | 3,664 (86.8%) |
| Fuel Oil or Kerosene | 91 (1.7%) | 49 (1.2%) |
| Coal or Coke | 0 (0.0%) | 0 (0.0%) |
| All other Fuels | 146 (2.8%) | 7 (0.2%) |
| No Fuel Used | 15 (0.3%) | 15 (0.4%) |
| Total | 5,310 (100.0%) | 4,223 (100.0%) |
Household Vehicle Usage in Hazel Dell
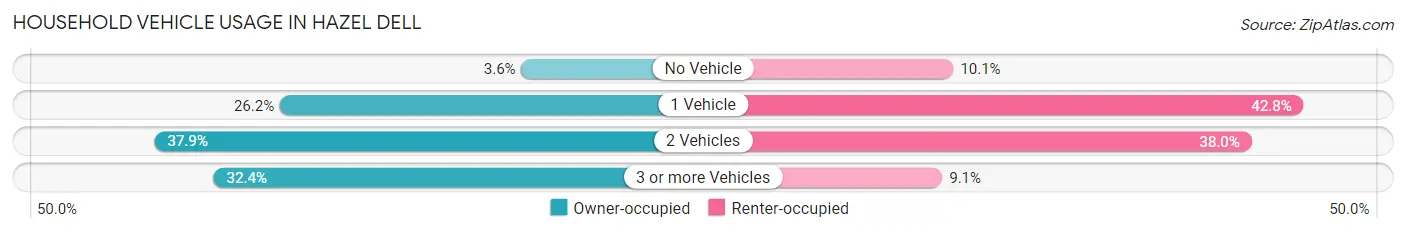
| Vehicles per Household | Owner-occupied | Renter-occupied |
| No Vehicle | 192 (3.6%) | 428 (10.1%) |
| 1 Vehicle | 1,389 (26.2%) | 1,808 (42.8%) |
| 2 Vehicles | 2,011 (37.9%) | 1,603 (38.0%) |
| 3 or more Vehicles | 1,718 (32.4%) | 384 (9.1%) |
| Total | 5,310 (100.0%) | 4,223 (100.0%) |
Real Estate & Mortgages in Hazel Dell
Real Estate and Mortgage Overview in Hazel Dell
| Characteristic | Without Mortgage | With Mortgage |
| Housing Units | 1,889 | 3,421 |
| Median Property Value | $358,300 | $403,300 |
| Median Household Income | $54,453 | $925 |
| Monthly Housing Costs | $553 | $199 |
| Real Estate Taxes | $3,047 | $38 |
Property Value by Mortgage Status in Hazel Dell
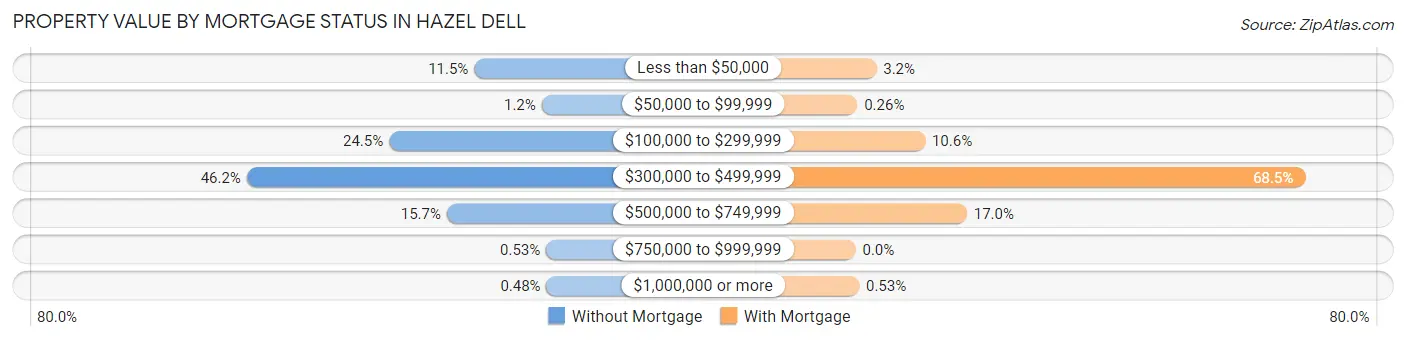
| Property Value | Without Mortgage | With Mortgage |
| Less than $50,000 | 217 (11.5%) | 108 (3.2%) |
| $50,000 to $99,999 | 23 (1.2%) | 9 (0.3%) |
| $100,000 to $299,999 | 462 (24.5%) | 362 (10.6%) |
| $300,000 to $499,999 | 872 (46.2%) | 2,344 (68.5%) |
| $500,000 to $749,999 | 296 (15.7%) | 580 (17.0%) |
| $750,000 to $999,999 | 10 (0.5%) | 0 (0.0%) |
| $1,000,000 or more | 9 (0.5%) | 18 (0.5%) |
| Total | 1,889 (100.0%) | 3,421 (100.0%) |
Household Income by Mortgage Status in Hazel Dell
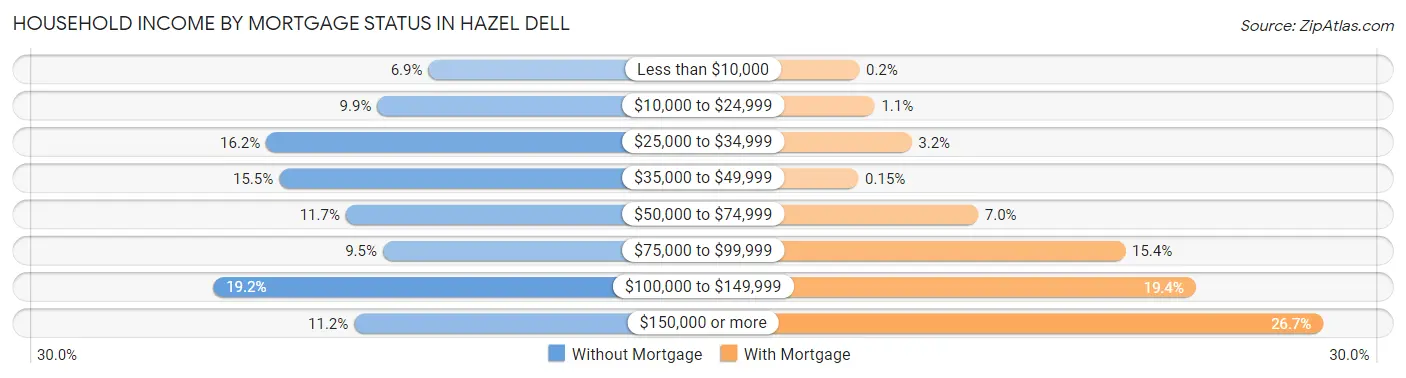
| Household Income | Without Mortgage | With Mortgage |
| Less than $10,000 | 131 (6.9%) | 7 (0.2%) |
| $10,000 to $24,999 | 186 (9.9%) | 37 (1.1%) |
| $25,000 to $34,999 | 306 (16.2%) | 109 (3.2%) |
| $35,000 to $49,999 | 292 (15.5%) | 5 (0.2%) |
| $50,000 to $74,999 | 220 (11.7%) | 239 (7.0%) |
| $75,000 to $99,999 | 180 (9.5%) | 527 (15.4%) |
| $100,000 to $149,999 | 363 (19.2%) | 665 (19.4%) |
| $150,000 or more | 211 (11.2%) | 914 (26.7%) |
| Total | 1,889 (100.0%) | 3,421 (100.0%) |
Property Value to Household Income Ratio in Hazel Dell
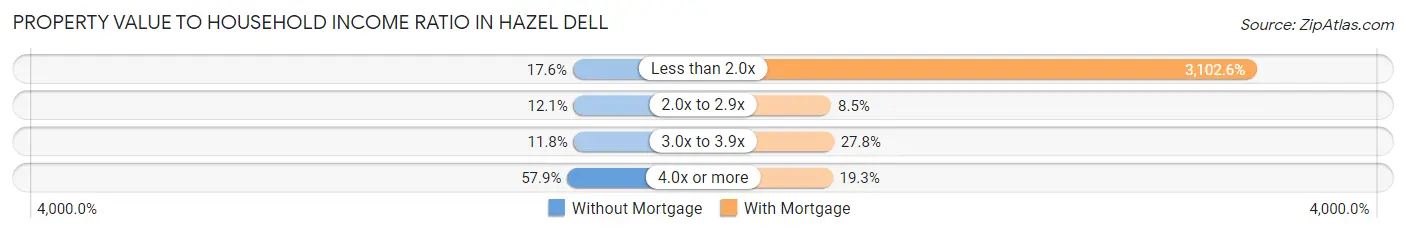
| Value-to-Income Ratio | Without Mortgage | With Mortgage |
| Less than 2.0x | 332 (17.6%) | 106,141 (3,102.6%) |
| 2.0x to 2.9x | 229 (12.1%) | 290 (8.5%) |
| 3.0x to 3.9x | 223 (11.8%) | 951 (27.8%) |
| 4.0x or more | 1,094 (57.9%) | 659 (19.3%) |
| Total | 1,889 (100.0%) | 3,421 (100.0%) |
Real Estate Taxes by Mortgage Status in Hazel Dell
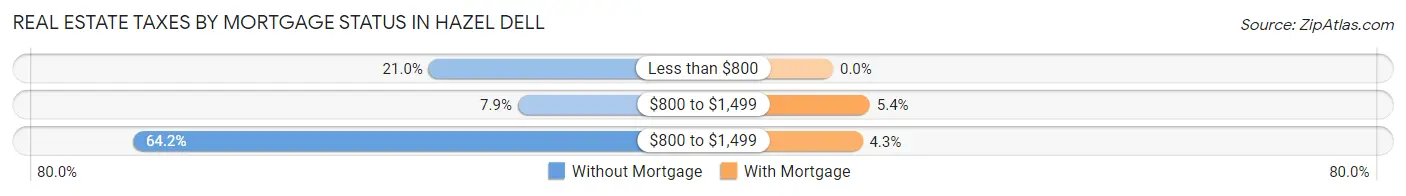
| Property Taxes | Without Mortgage | With Mortgage |
| Less than $800 | 396 (21.0%) | 0 (0.0%) |
| $800 to $1,499 | 150 (7.9%) | 184 (5.4%) |
| $800 to $1,499 | 1,212 (64.2%) | 147 (4.3%) |
| Total | 1,889 (100.0%) | 3,421 (100.0%) |
Health & Disability in Hazel Dell
Health Insurance Coverage by Age in Hazel Dell
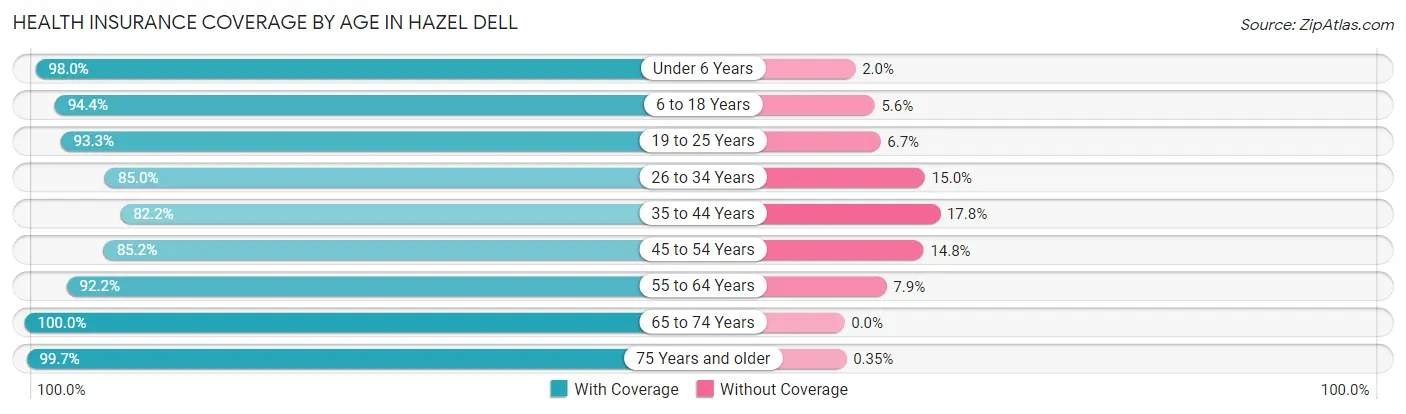
| Age Bracket | With Coverage | Without Coverage |
| Under 6 Years | 1,496 (98.0%) | 31 (2.0%) |
| 6 to 18 Years | 2,903 (94.4%) | 173 (5.6%) |
| 19 to 25 Years | 2,217 (93.3%) | 160 (6.7%) |
| 26 to 34 Years | 2,798 (85.0%) | 495 (15.0%) |
| 35 to 44 Years | 2,741 (82.2%) | 595 (17.8%) |
| 45 to 54 Years | 2,229 (85.2%) | 386 (14.8%) |
| 55 to 64 Years | 2,759 (92.1%) | 235 (7.9%) |
| 65 to 74 Years | 1,949 (100.0%) | 0 (0.0%) |
| 75 Years and older | 1,437 (99.7%) | 5 (0.4%) |
| Total | 20,529 (90.8%) | 2,080 (9.2%) |
Health Insurance Coverage by Citizenship Status in Hazel Dell
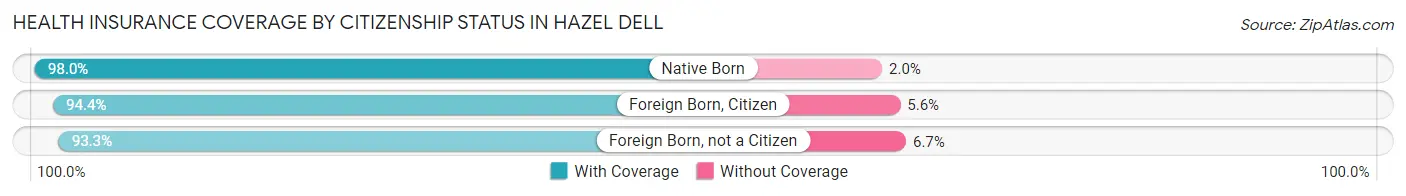
| Citizenship Status | With Coverage | Without Coverage |
| Native Born | 1,496 (98.0%) | 31 (2.0%) |
| Foreign Born, Citizen | 2,903 (94.4%) | 173 (5.6%) |
| Foreign Born, not a Citizen | 2,217 (93.3%) | 160 (6.7%) |
Health Insurance Coverage by Household Income in Hazel Dell
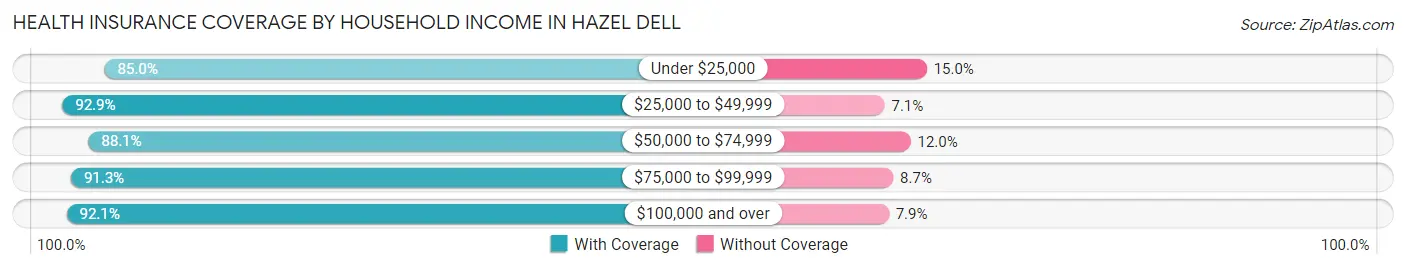
| Household Income | With Coverage | Without Coverage |
| Under $25,000 | 1,823 (85.0%) | 321 (15.0%) |
| $25,000 to $49,999 | 3,166 (92.9%) | 241 (7.1%) |
| $50,000 to $74,999 | 3,072 (88.0%) | 417 (11.9%) |
| $75,000 to $99,999 | 3,603 (91.3%) | 343 (8.7%) |
| $100,000 and over | 8,850 (92.1%) | 755 (7.9%) |
Public vs Private Health Insurance Coverage by Age in Hazel Dell
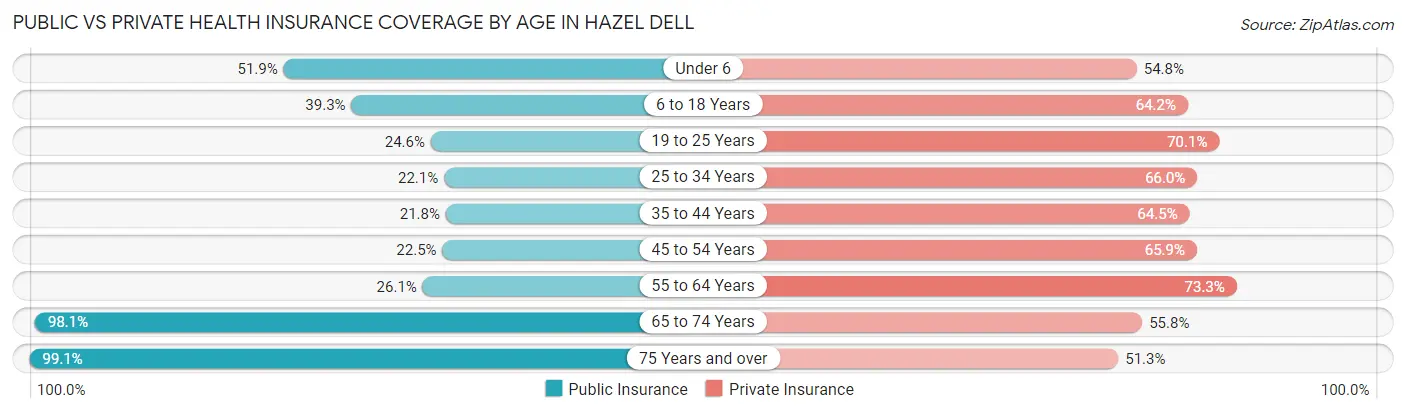
| Age Bracket | Public Insurance | Private Insurance |
| Under 6 | 793 (51.9%) | 836 (54.7%) |
| 6 to 18 Years | 1,210 (39.3%) | 1,975 (64.2%) |
| 19 to 25 Years | 585 (24.6%) | 1,665 (70.1%) |
| 25 to 34 Years | 729 (22.1%) | 2,172 (66.0%) |
| 35 to 44 Years | 728 (21.8%) | 2,153 (64.5%) |
| 45 to 54 Years | 587 (22.5%) | 1,723 (65.9%) |
| 55 to 64 Years | 782 (26.1%) | 2,194 (73.3%) |
| 65 to 74 Years | 1,912 (98.1%) | 1,087 (55.8%) |
| 75 Years and over | 1,429 (99.1%) | 740 (51.3%) |
| Total | 8,755 (38.7%) | 14,545 (64.3%) |
Disability Status by Sex by Age in Hazel Dell
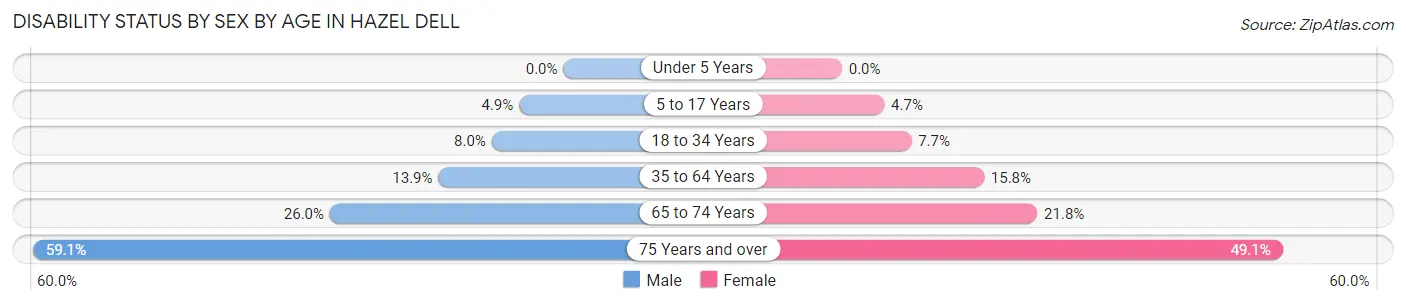
| Age Bracket | Male | Female |
| Under 5 Years | 0 (0.0%) | 0 (0.0%) |
| 5 to 17 Years | 66 (4.9%) | 81 (4.7%) |
| 18 to 34 Years | 257 (8.0%) | 205 (7.7%) |
| 35 to 64 Years | 640 (13.9%) | 688 (15.8%) |
| 65 to 74 Years | 214 (26.0%) | 245 (21.8%) |
| 75 Years and over | 361 (59.1%) | 408 (49.1%) |
Disability Class by Sex by Age in Hazel Dell
Disability Class: Hearing Difficulty
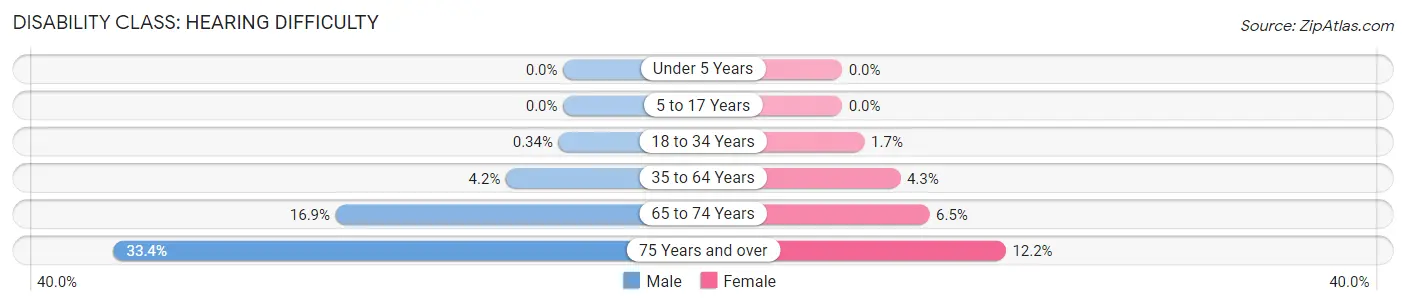
| Age Bracket | Male | Female |
| Under 5 Years | 0 (0.0%) | 0 (0.0%) |
| 5 to 17 Years | 0 (0.0%) | 0 (0.0%) |
| 18 to 34 Years | 11 (0.3%) | 44 (1.7%) |
| 35 to 64 Years | 195 (4.2%) | 188 (4.3%) |
| 65 to 74 Years | 139 (16.9%) | 73 (6.5%) |
| 75 Years and over | 204 (33.4%) | 101 (12.1%) |
Disability Class: Vision Difficulty
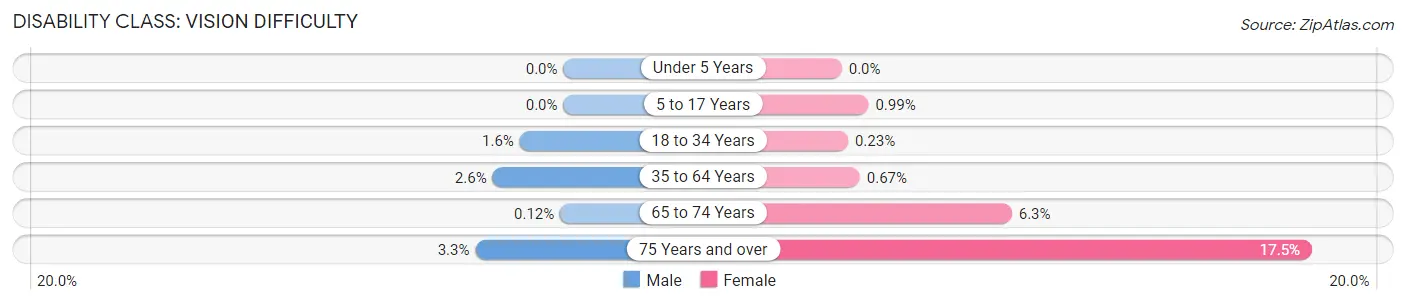
| Age Bracket | Male | Female |
| Under 5 Years | 0 (0.0%) | 0 (0.0%) |
| 5 to 17 Years | 0 (0.0%) | 17 (1.0%) |
| 18 to 34 Years | 52 (1.6%) | 6 (0.2%) |
| 35 to 64 Years | 121 (2.6%) | 29 (0.7%) |
| 65 to 74 Years | 1 (0.1%) | 71 (6.3%) |
| 75 Years and over | 20 (3.3%) | 145 (17.4%) |
Disability Class: Cognitive Difficulty
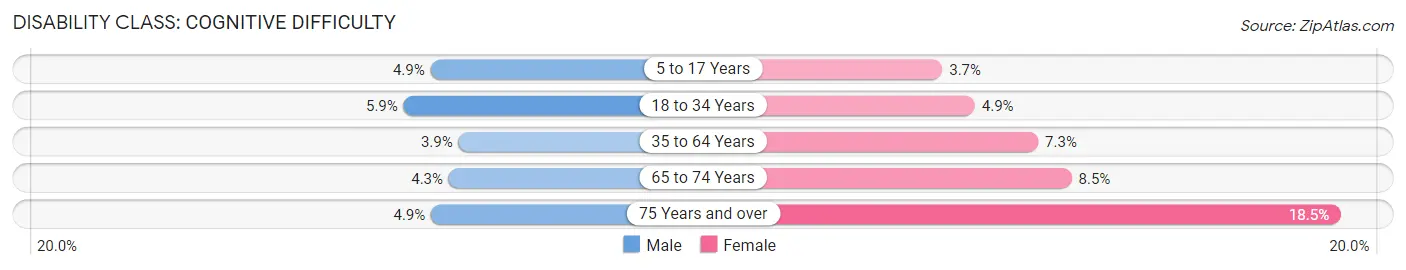
| Age Bracket | Male | Female |
| 5 to 17 Years | 66 (4.9%) | 64 (3.7%) |
| 18 to 34 Years | 191 (5.9%) | 131 (4.9%) |
| 35 to 64 Years | 179 (3.9%) | 317 (7.3%) |
| 65 to 74 Years | 35 (4.3%) | 96 (8.5%) |
| 75 Years and over | 30 (4.9%) | 154 (18.5%) |
Disability Class: Ambulatory Difficulty
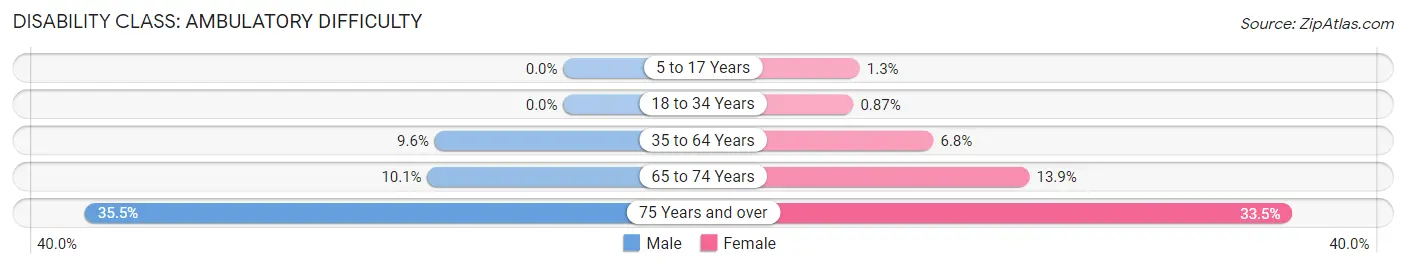
| Age Bracket | Male | Female |
| 5 to 17 Years | 0 (0.0%) | 23 (1.3%) |
| 18 to 34 Years | 0 (0.0%) | 23 (0.9%) |
| 35 to 64 Years | 439 (9.6%) | 296 (6.8%) |
| 65 to 74 Years | 83 (10.1%) | 157 (13.9%) |
| 75 Years and over | 217 (35.5%) | 278 (33.5%) |
Disability Class: Self-Care Difficulty
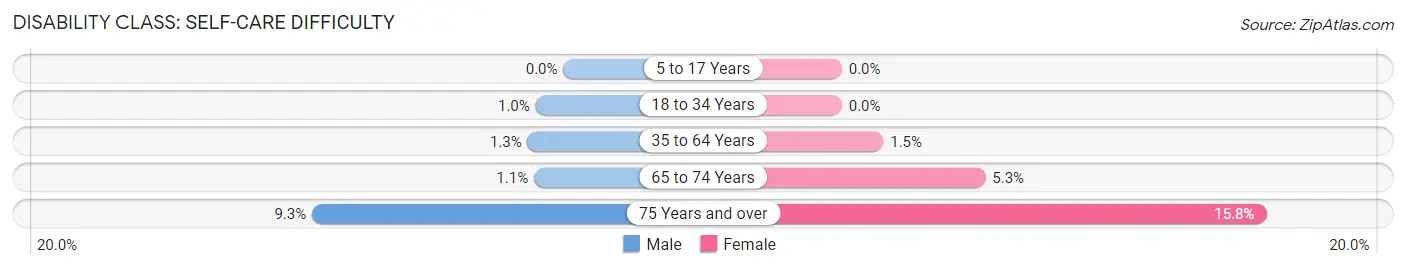
| Age Bracket | Male | Female |
| 5 to 17 Years | 0 (0.0%) | 0 (0.0%) |
| 18 to 34 Years | 33 (1.0%) | 0 (0.0%) |
| 35 to 64 Years | 61 (1.3%) | 67 (1.5%) |
| 65 to 74 Years | 9 (1.1%) | 60 (5.3%) |
| 75 Years and over | 57 (9.3%) | 131 (15.8%) |
Technology Access in Hazel Dell
Computing Device Access in Hazel Dell
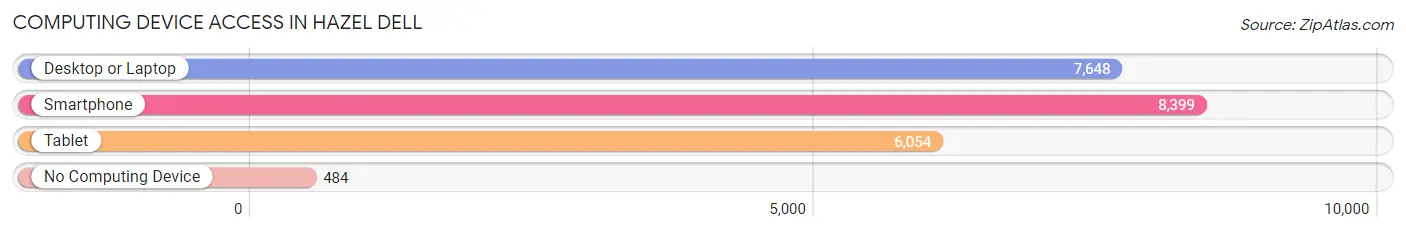
| Device Type | # Households | % Households |
| Desktop or Laptop | 7,648 | 80.2% |
| Smartphone | 8,399 | 88.1% |
| Tablet | 6,054 | 63.5% |
| No Computing Device | 484 | 5.1% |
| Total | 9,533 | 100.0% |
Internet Access in Hazel Dell
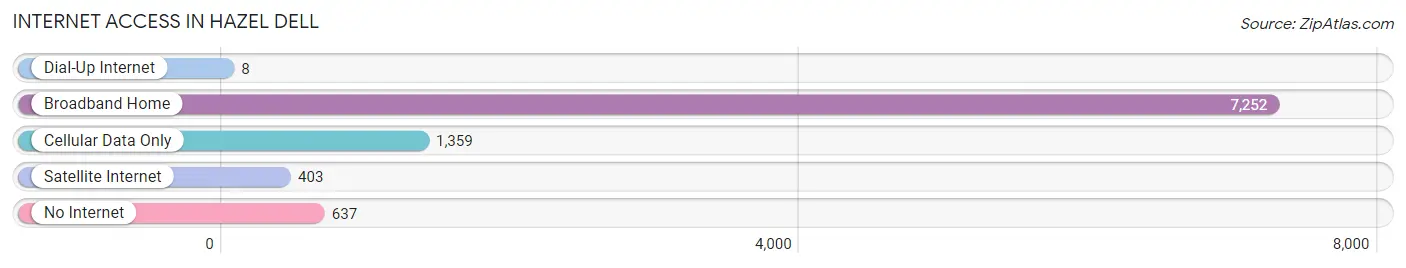
| Internet Type | # Households | % Households |
| Dial-Up Internet | 8 | 0.1% |
| Broadband Home | 7,252 | 76.1% |
| Cellular Data Only | 1,359 | 14.3% |
| Satellite Internet | 403 | 4.2% |
| No Internet | 637 | 6.7% |
| Total | 9,533 | 100.0% |
Hazel Dell Summary
Hazel Dell is a census-designated place (CDP) located in Clark County, Washington, United States. The population was 18,907 at the 2010 census. It is part of the Portland-Vancouver-Hillsboro, OR-WA Metropolitan Statistical Area.
History
Hazel Dell was first settled in the late 1800s by homesteaders who were attracted to the area by its rich soil and abundant timber. The area was originally known as "Hazel Dell School District" and was named after the hazelnut trees that grew in the area. The first school in the area was built in 1891 and the first post office was established in 1892.
In the early 1900s, the area began to grow as more people moved to the area to take advantage of the fertile soil and abundant timber. The area was incorporated as a town in 1911 and the first mayor was elected in 1912.
The area continued to grow throughout the 20th century and by the 2000 census, the population had grown to 18,907.
Geography
Hazel Dell is located at 45°41'17"N 122°41'17"W (45.688, -122.688). It is situated in the northwest corner of Clark County, Washington, and is bordered by the cities of Vancouver to the north, Battle Ground to the east, and Ridgefield to the south.
The CDP has a total area of 4 2 square miles all of which is land
Economy
Hazel Dell is home to a variety of businesses, including retail stores, restaurants, and professional services. The area is also home to several industrial parks, which provide employment opportunities for local residents.
The largest employers in the area are the PeaceHealth Southwest Medical Center, the Vancouver School District, and the Clark County Public Works Department.
Demographics
As of the 2010 census, there were 18,907 people, 7,845 households, and 4,945 families residing in the CDP. The population density was 4,521.3 people per square mile. The racial makeup of the CDP was 81.2% White, 5.2% African American, 0.7% Native American, 5.3% Asian, 0.2% Pacific Islander, 4.2% from other races, and 3.2% from two or more races. Hispanic or Latino of any race were 8.7% of the population.
The median income for a household in the CDP was $50,945, and the median income for a family was $60,945. Males had a median income of $45,945 versus $35,945 for females. The per capita income for the CDP was $25,945. About 6.2% of families and 8.2% of the population were below the poverty line, including 11.2% of those under age 18 and 5.2% of those age 65 or over.
Common Questions
What is Per Capita Income in Hazel Dell?
Per Capita income in Hazel Dell is $36,839.
What is the Median Family Income in Hazel Dell?
Median Family Income in Hazel Dell is $82,802.
What is the Median Household income in Hazel Dell?
Median Household Income in Hazel Dell is $72,299.
What is Income or Wage Gap in Hazel Dell?
Income or Wage Gap in Hazel Dell is 26.8%.
Women in Hazel Dell earn 73.2 cents for every dollar earned by a man.
What is Inequality or Gini Index in Hazel Dell?
Inequality or Gini Index in Hazel Dell is 0.40.
What is the Total Population of Hazel Dell?
Total Population of Hazel Dell is 22,714.
What is the Total Male Population of Hazel Dell?
Total Male Population of Hazel Dell is 11,178.
What is the Total Female Population of Hazel Dell?
Total Female Population of Hazel Dell is 11,536.
What is the Ratio of Males per 100 Females in Hazel Dell?
There are 96.90 Males per 100 Females in Hazel Dell.
What is the Ratio of Females per 100 Males in Hazel Dell?
There are 103.20 Females per 100 Males in Hazel Dell.
What is the Median Population Age in Hazel Dell?
Median Population Age in Hazel Dell is 38.0 Years.
What is the Average Family Size in Hazel Dell
Average Family Size in Hazel Dell is 2.9 People.
What is the Average Household Size in Hazel Dell
Average Household Size in Hazel Dell is 2.4 People.
How Large is the Labor Force in Hazel Dell?
There are 12,469 People in the Labor Forcein in Hazel Dell.
What is the Percentage of People in the Labor Force in Hazel Dell?
65.9% of People are in the Labor Force in Hazel Dell.
What is the Unemployment Rate in Hazel Dell?
Unemployment Rate in Hazel Dell is 7.7%.