Zip Codes with the Highest Percentage of Black / African American Population in Richland, WA
RELATED REPORTS & OPTIONS
Black / African American
Richland
Compare Zip Codes
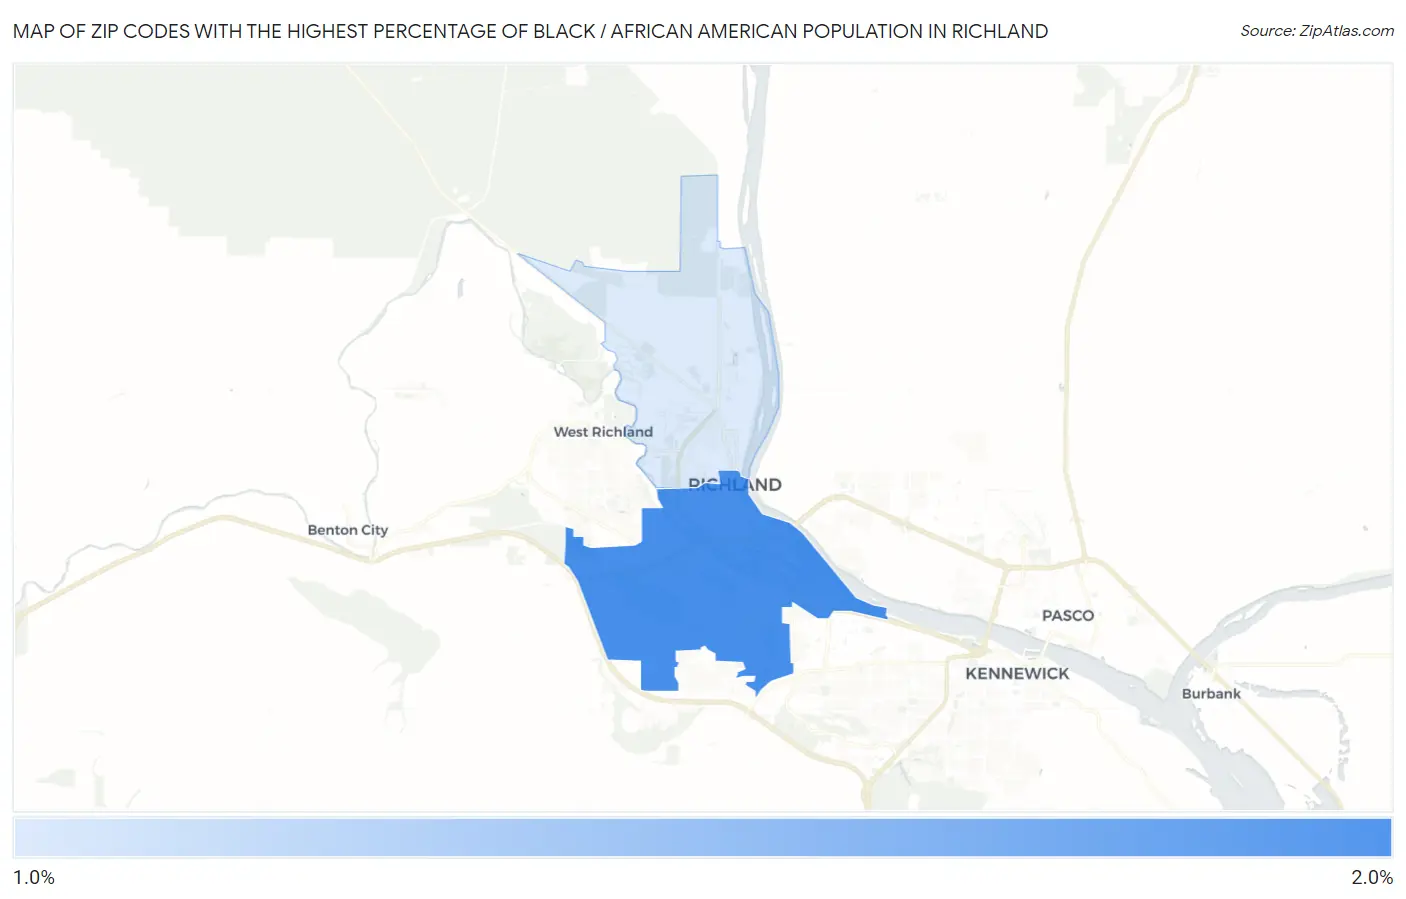
Map of Zip Codes with the Highest Percentage of Black / African American Population in Richland
1.1%
1.8%
Zip Codes with the Highest Percentage of Black / African American Population in Richland, WA
| Zip Code | Black / African American | vs State | vs National | |
| 1. | 99352 | 1.8% | 3.9%(-2.09)#180 | 12.5%(-10.6)#13,964 |
| 2. | 99354 | 1.1% | 3.9%(-2.78)#237 | 12.5%(-11.3)#15,999 |
1
Common Questions
What are the Top Zip Codes with the Highest Percentage of Black / African American Population in Richland, WA?
Top Zip Codes with the Highest Percentage of Black / African American Population in Richland, WA are:
What zip code has the Highest Percentage of Black / African American Population in Richland, WA?
99352 has the Highest Percentage of Black / African American Population in Richland, WA with 1.8%.
What is the Percentage of Black / African American Population in Richland, WA?
Percentage of Black / African American Population in Richland is 1.6%.
What is the Percentage of Black / African American Population in Washington?
Percentage of Black / African American Population in Washington is 3.9%.
What is the Percentage of Black / African American Population in the United States?
Percentage of Black / African American Population in the United States is 12.5%.