Zip Codes with the Highest Percentage of Black / African American Population in Port Orchard, WA
RELATED REPORTS & OPTIONS
Black / African American
Port Orchard
Compare Zip Codes
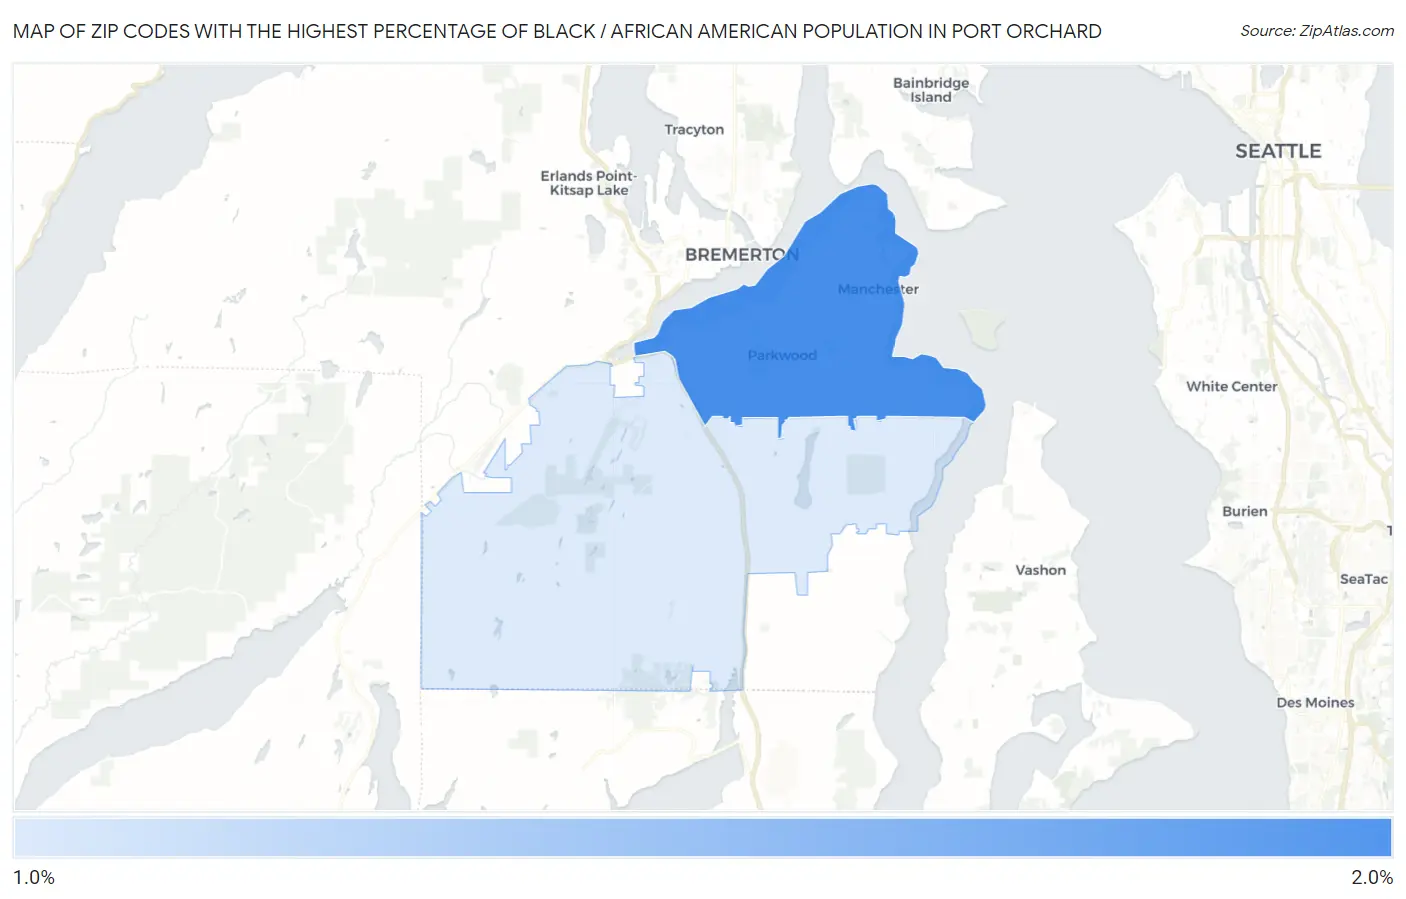
Map of Zip Codes with the Highest Percentage of Black / African American Population in Port Orchard
1.1%
1.6%
Zip Codes with the Highest Percentage of Black / African American Population in Port Orchard, WA
| Zip Code | Black / African American | vs State | vs National | |
| 1. | 98366 | 1.6% | 3.9%(-2.33)#195 | 12.5%(-10.9)#14,564 |
| 2. | 98367 | 1.1% | 3.9%(-2.81)#240 | 12.5%(-11.4)#16,120 |
1
Common Questions
What are the Top Zip Codes with the Highest Percentage of Black / African American Population in Port Orchard, WA?
Top Zip Codes with the Highest Percentage of Black / African American Population in Port Orchard, WA are:
What zip code has the Highest Percentage of Black / African American Population in Port Orchard, WA?
98366 has the Highest Percentage of Black / African American Population in Port Orchard, WA with 1.6%.
What is the Percentage of Black / African American Population in Port Orchard, WA?
Percentage of Black / African American Population in Port Orchard is 1.9%.
What is the Percentage of Black / African American Population in Washington?
Percentage of Black / African American Population in Washington is 3.9%.
What is the Percentage of Black / African American Population in the United States?
Percentage of Black / African American Population in the United States is 12.5%.