Cities with the Most Immigrants from Peru in Wisconsin
RELATED REPORTS & OPTIONS
Peru
Wisconsin
Compare Cities
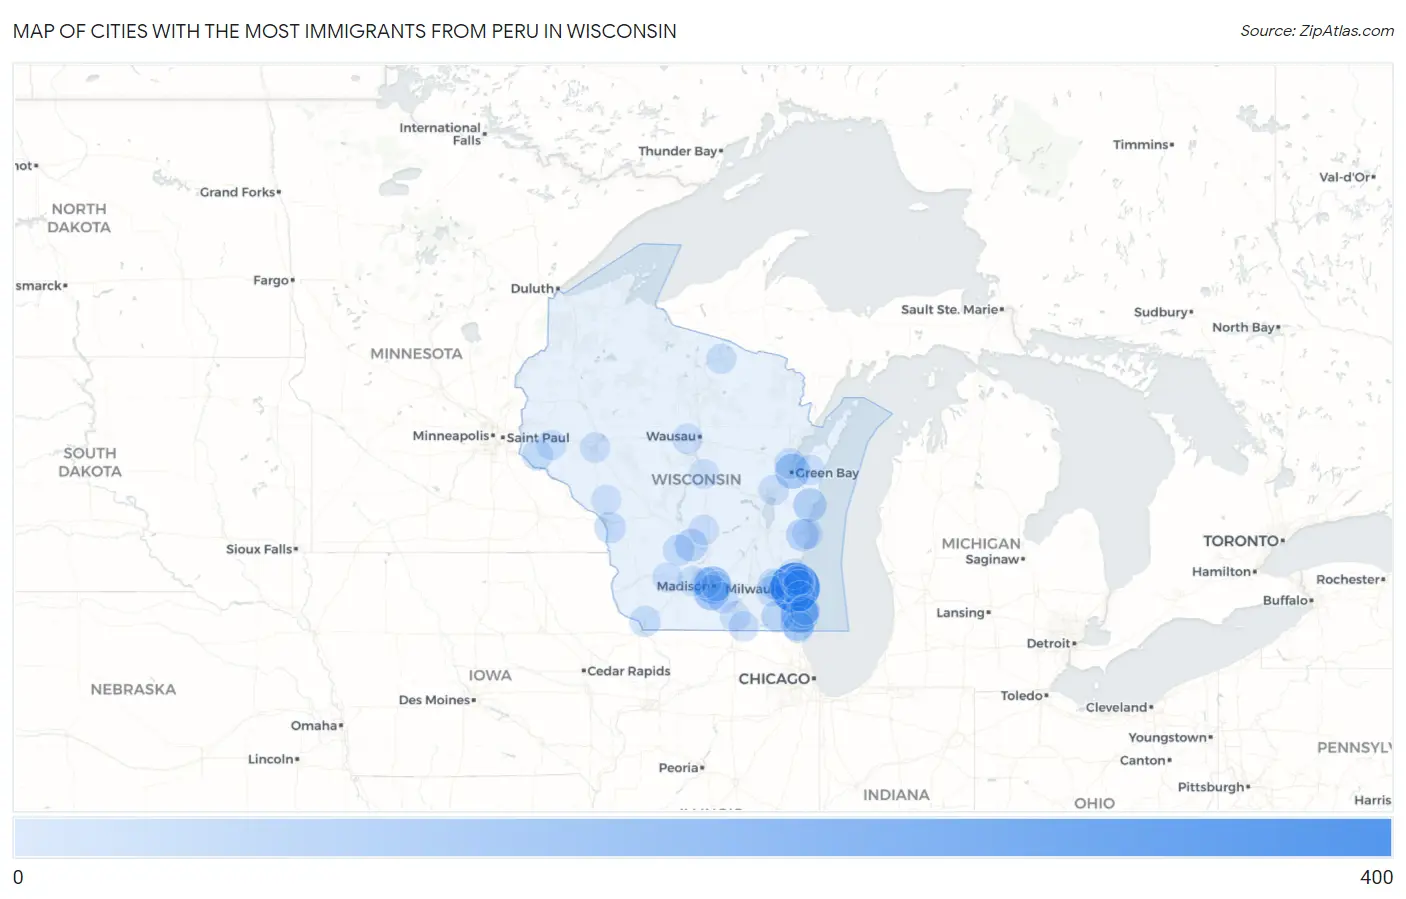
Map of Cities with the Most Immigrants from Peru in Wisconsin
0
400

Cities with the Most Immigrants from Peru in Wisconsin
| City | Peru | vs State | vs National | |
| 1. | Milwaukee | 359 | 1,960(18.32%)#1 | 461,322(0.08%)#232 |
| 2. | Mount Pleasant | 150 | 1,960(7.65%)#2 | 461,322(0.03%)#559 |
| 3. | Madison | 128 | 1,960(6.53%)#3 | 461,322(0.03%)#631 |
| 4. | Raymond | 121 | 1,960(6.17%)#4 | 461,322(0.03%)#659 |
| 5. | Fitchburg | 95 | 1,960(4.85%)#5 | 461,322(0.02%)#802 |
| 6. | Greenfield | 90 | 1,960(4.59%)#6 | 461,322(0.02%)#829 |
| 7. | Green Bay | 87 | 1,960(4.44%)#7 | 461,322(0.02%)#849 |
| 8. | Kenosha | 62 | 1,960(3.16%)#8 | 461,322(0.01%)#1,067 |
| 9. | Manitowoc | 58 | 1,960(2.96%)#9 | 461,322(0.01%)#1,127 |
| 10. | Sheboygan Falls | 45 | 1,960(2.30%)#10 | 461,322(0.01%)#1,343 |
| 11. | Lake Delton | 45 | 1,960(2.30%)#11 | 461,322(0.01%)#1,349 |
| 12. | Burlington | 36 | 1,960(1.84%)#12 | 461,322(0.01%)#1,498 |
| 13. | Wauwatosa | 34 | 1,960(1.73%)#13 | 461,322(0.01%)#1,537 |
| 14. | Whitefish Bay | 27 | 1,960(1.38%)#14 | 461,322(0.01%)#1,761 |
| 15. | Racine | 24 | 1,960(1.22%)#15 | 461,322(0.01%)#1,834 |
| 16. | La Crosse | 24 | 1,960(1.22%)#16 | 461,322(0.01%)#1,837 |
| 17. | Reedsburg | 21 | 1,960(1.07%)#17 | 461,322(0.00%)#1,952 |
| 18. | Suamico | 18 | 1,960(0.92%)#18 | 461,322(0.00%)#2,061 |
| 19. | Stoughton | 17 | 1,960(0.87%)#19 | 461,322(0.00%)#2,113 |
| 20. | Ellsworth | 17 | 1,960(0.87%)#20 | 461,322(0.00%)#2,127 |
| 21. | Dickeyville | 17 | 1,960(0.87%)#21 | 461,322(0.00%)#2,132 |
| 22. | Hartland | 15 | 1,960(0.77%)#22 | 461,322(0.00%)#2,207 |
| 23. | Pewaukee | 13 | 1,960(0.66%)#23 | 461,322(0.00%)#2,319 |
| 24. | Pleasant Prairie | 12 | 1,960(0.61%)#24 | 461,322(0.00%)#2,355 |
| 25. | Sheboygan | 11 | 1,960(0.56%)#25 | 461,322(0.00%)#2,410 |
| 26. | Brookfield | 11 | 1,960(0.56%)#26 | 461,322(0.00%)#2,414 |
| 27. | Wales | 11 | 1,960(0.56%)#27 | 461,322(0.00%)#2,457 |
| 28. | Glendale | 10 | 1,960(0.51%)#28 | 461,322(0.00%)#2,500 |
| 29. | Middleton | 9 | 1,960(0.46%)#29 | 461,322(0.00%)#2,552 |
| 30. | Oxford | 8 | 1,960(0.41%)#30 | 461,322(0.00%)#2,649 |
| 31. | Eau Claire | 7 | 1,960(0.36%)#31 | 461,322(0.00%)#2,658 |
| 32. | Mequon | 7 | 1,960(0.36%)#32 | 461,322(0.00%)#2,673 |
| 33. | Little Chute | 6 | 1,960(0.31%)#33 | 461,322(0.00%)#2,771 |
| 34. | Fox Point | 6 | 1,960(0.31%)#34 | 461,322(0.00%)#2,780 |
| 35. | Janesville | 5 | 1,960(0.26%)#35 | 461,322(0.00%)#2,817 |
| 36. | Shorewood | 5 | 1,960(0.26%)#36 | 461,322(0.00%)#2,834 |
| 37. | Marathon City | 5 | 1,960(0.26%)#37 | 461,322(0.00%)#2,872 |
| 38. | Cudahy | 4 | 1,960(0.20%)#38 | 461,322(0.00%)#2,898 |
| 39. | Clinton | 4 | 1,960(0.20%)#39 | 461,322(0.00%)#2,934 |
| 40. | Luxemburg | 3 | 1,960(0.15%)#40 | 461,322(0.00%)#2,988 |
| 41. | Black Earth | 3 | 1,960(0.15%)#41 | 461,322(0.00%)#2,998 |
| 42. | Eagle River | 3 | 1,960(0.15%)#42 | 461,322(0.00%)#3,000 |
| 43. | Spring Valley | 3 | 1,960(0.15%)#43 | 461,322(0.00%)#3,007 |
| 44. | Lone Rock | 3 | 1,960(0.15%)#44 | 461,322(0.00%)#3,014 |
| 45. | Monona | 2 | 1,960(0.10%)#45 | 461,322(0.00%)#3,041 |
| 46. | Whiting | 2 | 1,960(0.10%)#46 | 461,322(0.00%)#3,061 |
| 47. | North Bay | 2 | 1,960(0.10%)#47 | 461,322(0.00%)#3,095 |
| 48. | Ettrick | 1 | 1,960(0.05%)#48 | 461,322(0.00%)#3,125 |
Common Questions
What are the Top 10 Cities with the Most Immigrants from Peru in Wisconsin?
Top 10 Cities with the Most Immigrants from Peru in Wisconsin are:
#1
359
#2
150
#3
128
#4
95
#5
90
#6
87
#7
62
#8
58
#9
45
#10
45
What city has the Most Immigrants from Peru in Wisconsin?
Milwaukee has the Most Immigrants from Peru in Wisconsin with 359.
What is the Total Immigrants from Peru in the State of Wisconsin?
Total Immigrants from Peru in Wisconsin is 1,960.
What is the Total Immigrants from Peru in the United States?
Total Immigrants from Peru in the United States is 461,322.