Cities with the Most Immigrants from Peru in North Carolina
RELATED REPORTS & OPTIONS
Peru
North Carolina
Compare Cities
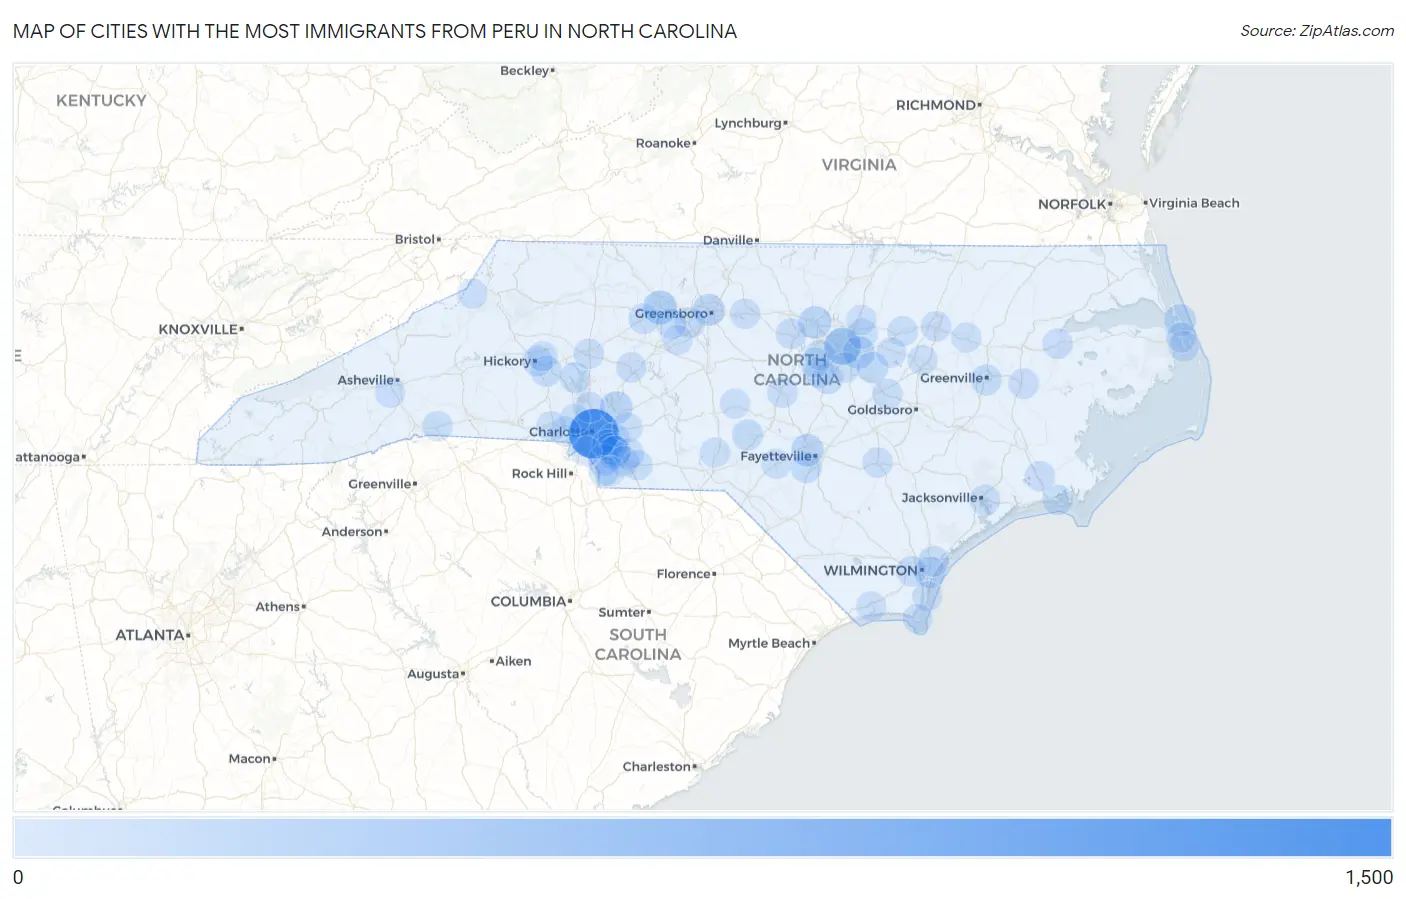
Map of Cities with the Most Immigrants from Peru in North Carolina
0
1,500
Cities with the Most Immigrants from Peru in North Carolina
| City | Peru | vs State | vs National | |
| 1. | Charlotte | 1,422 | 6,091(23.35%)#1 | 461,322(0.31%)#35 |
| 2. | Raleigh | 461 | 6,091(7.57%)#2 | 461,322(0.10%)#161 |
| 3. | Winston Salem | 249 | 6,091(4.09%)#3 | 461,322(0.05%)#337 |
| 4. | Indian Trail | 198 | 6,091(3.25%)#4 | 461,322(0.04%)#427 |
| 5. | Concord | 175 | 6,091(2.87%)#5 | 461,322(0.04%)#482 |
| 6. | Durham | 172 | 6,091(2.82%)#6 | 461,322(0.04%)#490 |
| 7. | Fayetteville | 155 | 6,091(2.54%)#7 | 461,322(0.03%)#542 |
| 8. | Knightdale | 152 | 6,091(2.50%)#8 | 461,322(0.03%)#553 |
| 9. | Greensboro | 134 | 6,091(2.20%)#9 | 461,322(0.03%)#611 |
| 10. | Mint Hill | 104 | 6,091(1.71%)#10 | 461,322(0.02%)#738 |
| 11. | Kill Devil Hills | 102 | 6,091(1.67%)#11 | 461,322(0.02%)#754 |
| 12. | Archer Lodge | 92 | 6,091(1.51%)#12 | 461,322(0.02%)#820 |
| 13. | Stallings | 86 | 6,091(1.41%)#13 | 461,322(0.02%)#855 |
| 14. | Weddington | 84 | 6,091(1.38%)#14 | 461,322(0.02%)#876 |
| 15. | Pinehurst | 71 | 6,091(1.17%)#15 | 461,322(0.02%)#987 |
| 16. | Matthews | 65 | 6,091(1.07%)#16 | 461,322(0.01%)#1,041 |
| 17. | Newton | 65 | 6,091(1.07%)#17 | 461,322(0.01%)#1,043 |
| 18. | Wilmington | 63 | 6,091(1.03%)#18 | 461,322(0.01%)#1,059 |
| 19. | Hope Mills | 63 | 6,091(1.03%)#19 | 461,322(0.01%)#1,065 |
| 20. | Greenville | 62 | 6,091(1.02%)#20 | 461,322(0.01%)#1,068 |
| 21. | Fuquay Varina | 58 | 6,091(0.95%)#21 | 461,322(0.01%)#1,126 |
| 22. | Lake Park | 55 | 6,091(0.90%)#22 | 461,322(0.01%)#1,178 |
| 23. | High Point | 51 | 6,091(0.84%)#23 | 461,322(0.01%)#1,224 |
| 24. | Jacksonville | 49 | 6,091(0.80%)#24 | 461,322(0.01%)#1,265 |
| 25. | Holly Springs | 47 | 6,091(0.77%)#25 | 461,322(0.01%)#1,300 |
| 26. | Carrboro | 45 | 6,091(0.74%)#26 | 461,322(0.01%)#1,335 |
| 27. | Murraysville | 41 | 6,091(0.67%)#27 | 461,322(0.01%)#1,400 |
| 28. | Lake Norman Of Catawba | 38 | 6,091(0.62%)#28 | 461,322(0.01%)#1,452 |
| 29. | Cary | 37 | 6,091(0.61%)#29 | 461,322(0.01%)#1,468 |
| 30. | Unionville | 33 | 6,091(0.54%)#30 | 461,322(0.01%)#1,576 |
| 31. | Hickory | 30 | 6,091(0.49%)#31 | 461,322(0.01%)#1,652 |
| 32. | Clemmons | 30 | 6,091(0.49%)#32 | 461,322(0.01%)#1,661 |
| 33. | Washington | 29 | 6,091(0.48%)#33 | 461,322(0.01%)#1,695 |
| 34. | Sanford | 28 | 6,091(0.46%)#34 | 461,322(0.01%)#1,718 |
| 35. | Statesville | 27 | 6,091(0.44%)#35 | 461,322(0.01%)#1,749 |
| 36. | Monroe | 26 | 6,091(0.43%)#36 | 461,322(0.01%)#1,778 |
| 37. | Rocky Mount | 24 | 6,091(0.39%)#37 | 461,322(0.01%)#1,836 |
| 38. | Morehead City | 22 | 6,091(0.36%)#38 | 461,322(0.00%)#1,915 |
| 39. | Huntersville | 21 | 6,091(0.34%)#39 | 461,322(0.00%)#1,936 |
| 40. | Burlington | 19 | 6,091(0.31%)#40 | 461,322(0.00%)#2,001 |
| 41. | Plymouth | 19 | 6,091(0.31%)#41 | 461,322(0.00%)#2,029 |
| 42. | Rolesville | 18 | 6,091(0.30%)#42 | 461,322(0.00%)#2,063 |
| 43. | Wingate | 18 | 6,091(0.30%)#43 | 461,322(0.00%)#2,075 |
| 44. | Wallburg | 18 | 6,091(0.30%)#44 | 461,322(0.00%)#2,077 |
| 45. | Columbus | 18 | 6,091(0.30%)#45 | 461,322(0.00%)#2,082 |
| 46. | Leland | 17 | 6,091(0.28%)#46 | 461,322(0.00%)#2,103 |
| 47. | Wanchese | 17 | 6,091(0.28%)#47 | 461,322(0.00%)#2,130 |
| 48. | Waxhaw | 16 | 6,091(0.26%)#48 | 461,322(0.00%)#2,143 |
| 49. | Spring Hope | 16 | 6,091(0.26%)#49 | 461,322(0.00%)#2,169 |
| 50. | St Stephens | 15 | 6,091(0.25%)#50 | 461,322(0.00%)#2,206 |
| 51. | Bent Creek | 15 | 6,091(0.25%)#51 | 461,322(0.00%)#2,220 |
| 52. | Pine Level | 14 | 6,091(0.23%)#52 | 461,322(0.00%)#2,276 |
| 53. | Salisbury | 12 | 6,091(0.20%)#53 | 461,322(0.00%)#2,345 |
| 54. | Havelock | 12 | 6,091(0.20%)#54 | 461,322(0.00%)#2,363 |
| 55. | Clinton | 12 | 6,091(0.20%)#55 | 461,322(0.00%)#2,379 |
| 56. | Manteo | 12 | 6,091(0.20%)#56 | 461,322(0.00%)#2,397 |
| 57. | Mount Holly | 11 | 6,091(0.18%)#57 | 461,322(0.00%)#2,428 |
| 58. | Tarboro | 11 | 6,091(0.18%)#58 | 461,322(0.00%)#2,437 |
| 59. | Carolina Beach | 11 | 6,091(0.18%)#59 | 461,322(0.00%)#2,446 |
| 60. | Mineral Springs | 11 | 6,091(0.18%)#60 | 461,322(0.00%)#2,456 |
| 61. | Midland | 10 | 6,091(0.16%)#61 | 461,322(0.00%)#2,522 |
| 62. | Pineville | 9 | 6,091(0.15%)#62 | 461,322(0.00%)#2,563 |
| 63. | Apex | 8 | 6,091(0.13%)#63 | 461,322(0.00%)#2,591 |
| 64. | Cramerton | 8 | 6,091(0.13%)#64 | 461,322(0.00%)#2,623 |
| 65. | Ellerbe | 8 | 6,091(0.13%)#65 | 461,322(0.00%)#2,644 |
| 66. | Silver City | 8 | 6,091(0.13%)#66 | 461,322(0.00%)#2,647 |
| 67. | Youngsville | 7 | 6,091(0.11%)#67 | 461,322(0.00%)#2,720 |
| 68. | Middlesex | 7 | 6,091(0.11%)#68 | 461,322(0.00%)#2,729 |
| 69. | Gastonia | 6 | 6,091(0.10%)#69 | 461,322(0.00%)#2,738 |
| 70. | Garner | 6 | 6,091(0.10%)#70 | 461,322(0.00%)#2,749 |
| 71. | Wilson | 4 | 6,091(0.07%)#71 | 461,322(0.00%)#2,889 |
| 72. | Thomasville | 3 | 6,091(0.05%)#72 | 461,322(0.00%)#2,961 |
| 73. | Shallotte | 3 | 6,091(0.05%)#73 | 461,322(0.00%)#2,977 |
| 74. | Robbins | 2 | 6,091(0.03%)#74 | 461,322(0.00%)#3,062 |
| 75. | Beech Mountain | 2 | 6,091(0.03%)#75 | 461,322(0.00%)#3,075 |
| 76. | Bald Head Island | 2 | 6,091(0.03%)#76 | 461,322(0.00%)#3,098 |
Common Questions
What are the Top 10 Cities with the Most Immigrants from Peru in North Carolina?
Top 10 Cities with the Most Immigrants from Peru in North Carolina are:
#1
1,422
#2
461
#3
249
#4
198
#5
175
#6
172
#7
155
#8
152
#9
134
#10
104
What city has the Most Immigrants from Peru in North Carolina?
Charlotte has the Most Immigrants from Peru in North Carolina with 1,422.
What is the Total Immigrants from Peru in the State of North Carolina?
Total Immigrants from Peru in North Carolina is 6,091.
What is the Total Immigrants from Peru in the United States?
Total Immigrants from Peru in the United States is 461,322.