Cities with the Lowest Poverty Level Among Children Under the Age of 16 in Tennessee
RELATED REPORTS & OPTIONS
Lowest Poverty | Child 0-16
Tennessee
Compare Cities
Map of Cities with the Lowest Poverty Level Among Children Under the Age of 16 in Tennessee
15.0%
0.0%
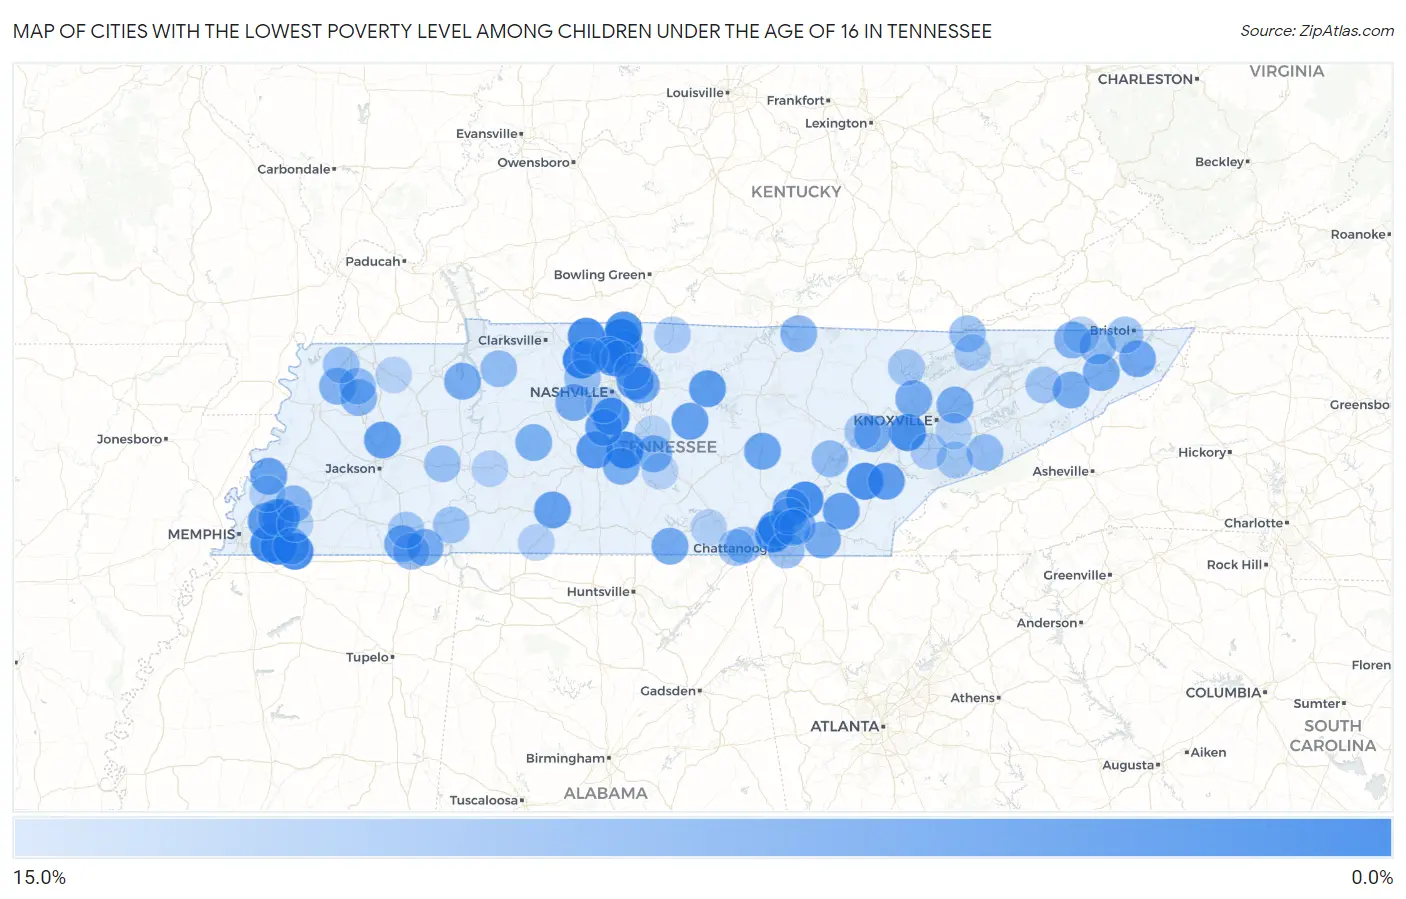
Cities with the Lowest Poverty Level Among Children Under the Age of 16 in Tennessee
| City | Child Poverty | vs State | vs National | |
| 1. | Pleasant View | 0.11% | 19.7%(-19.6)#1 | 16.9%(-16.8)#3 |
| 2. | Cross Plains | 0.28% | 19.7%(-19.4)#2 | 16.9%(-16.7)#18 |
| 3. | Eagleville | 1.0% | 19.7%(-18.7)#3 | 16.9%(-15.9)#285 |
| 4. | Signal Mountain | 1.1% | 19.7%(-18.6)#4 | 16.9%(-15.8)#342 |
| 5. | Germantown | 1.3% | 19.7%(-18.4)#5 | 16.9%(-15.6)#454 |
| 6. | Cedar Hill | 1.3% | 19.7%(-18.4)#6 | 16.9%(-15.6)#460 |
| 7. | Rossville | 1.4% | 19.7%(-18.3)#7 | 16.9%(-15.6)#478 |
| 8. | Collierville | 1.4% | 19.7%(-18.3)#8 | 16.9%(-15.5)#516 |
| 9. | Sale Creek | 1.6% | 19.7%(-18.1)#9 | 16.9%(-15.4)#606 |
| 10. | Brentwood | 1.7% | 19.7%(-18.0)#10 | 16.9%(-15.3)#671 |
| 11. | Farragut | 1.7% | 19.7%(-18.0)#11 | 16.9%(-15.2)#703 |
| 12. | Karns | 1.7% | 19.7%(-17.9)#12 | 16.9%(-15.2)#725 |
| 13. | Niota | 2.0% | 19.7%(-17.7)#13 | 16.9%(-15.0)#900 |
| 14. | Arlington | 2.2% | 19.7%(-17.5)#14 | 16.9%(-14.8)#1,023 |
| 15. | White House | 2.2% | 19.7%(-17.5)#15 | 16.9%(-14.8)#1,035 |
| 16. | Orlinda | 2.3% | 19.7%(-17.4)#16 | 16.9%(-14.7)#1,085 |
| 17. | Fairmount | 2.5% | 19.7%(-17.1)#17 | 16.9%(-14.4)#1,274 |
| 18. | Spring Hill | 2.9% | 19.7%(-16.8)#18 | 16.9%(-14.0)#1,564 |
| 19. | Ridgetop | 3.1% | 19.7%(-16.6)#19 | 16.9%(-13.8)#1,688 |
| 20. | Bartlett | 3.5% | 19.7%(-16.2)#20 | 16.9%(-13.5)#1,936 |
| 21. | Gordonsville | 3.5% | 19.7%(-16.2)#21 | 16.9%(-13.4)#1,979 |
| 22. | Green Hill | 3.6% | 19.7%(-16.1)#22 | 16.9%(-13.3)#2,037 |
| 23. | Madisonville | 3.6% | 19.7%(-16.0)#23 | 16.9%(-13.3)#2,046 |
| 24. | Medina | 3.8% | 19.7%(-15.9)#24 | 16.9%(-13.1)#2,159 |
| 25. | Flat Top Mountain | 3.9% | 19.7%(-15.8)#25 | 16.9%(-13.0)#2,233 |
| 26. | Calhoun | 4.0% | 19.7%(-15.7)#26 | 16.9%(-12.9)#2,282 |
| 27. | Auburntown | 4.2% | 19.7%(-15.5)#27 | 16.9%(-12.8)#2,405 |
| 28. | Ethridge | 4.2% | 19.7%(-15.4)#28 | 16.9%(-12.7)#2,453 |
| 29. | Franklin | 4.3% | 19.7%(-15.4)#29 | 16.9%(-12.6)#2,488 |
| 30. | Burlison | 4.5% | 19.7%(-15.1)#30 | 16.9%(-12.4)#2,669 |
| 31. | Oak Grove Cdp Washington County | 4.7% | 19.7%(-15.0)#31 | 16.9%(-12.2)#2,756 |
| 32. | Spencer | 4.7% | 19.7%(-15.0)#32 | 16.9%(-12.2)#2,759 |
| 33. | Mount Juliet | 5.1% | 19.7%(-14.6)#33 | 16.9%(-11.8)#3,051 |
| 34. | Hunter | 5.2% | 19.7%(-14.5)#34 | 16.9%(-11.7)#3,132 |
| 35. | Ramer | 5.3% | 19.7%(-14.4)#35 | 16.9%(-11.6)#3,204 |
| 36. | Huntland | 5.5% | 19.7%(-14.2)#36 | 16.9%(-11.4)#3,320 |
| 37. | Michie | 5.7% | 19.7%(-14.0)#37 | 16.9%(-11.3)#3,438 |
| 38. | Kingston Springs | 5.7% | 19.7%(-14.0)#38 | 16.9%(-11.2)#3,481 |
| 39. | Tusculum | 5.7% | 19.7%(-14.0)#39 | 16.9%(-11.2)#3,482 |
| 40. | Jonesborough | 5.7% | 19.7%(-13.9)#40 | 16.9%(-11.2)#3,492 |
| 41. | Clinton | 5.7% | 19.7%(-13.9)#41 | 16.9%(-11.2)#3,498 |
| 42. | Mascot | 5.8% | 19.7%(-13.9)#42 | 16.9%(-11.2)#3,509 |
| 43. | South Cleveland | 5.9% | 19.7%(-13.8)#43 | 16.9%(-11.1)#3,576 |
| 44. | Big Sandy | 5.9% | 19.7%(-13.8)#44 | 16.9%(-11.0)#3,627 |
| 45. | Kingston | 6.0% | 19.7%(-13.7)#45 | 16.9%(-11.0)#3,660 |
| 46. | Lakeland | 6.0% | 19.7%(-13.7)#46 | 16.9%(-11.0)#3,683 |
| 47. | Christiana | 6.0% | 19.7%(-13.7)#47 | 16.9%(-10.9)#3,707 |
| 48. | Lakesite | 6.0% | 19.7%(-13.6)#48 | 16.9%(-10.9)#3,722 |
| 49. | Chapel Hill | 6.0% | 19.7%(-13.6)#49 | 16.9%(-10.9)#3,731 |
| 50. | Centerville | 6.2% | 19.7%(-13.4)#50 | 16.9%(-10.7)#3,864 |
| 51. | Powell | 6.6% | 19.7%(-13.1)#51 | 16.9%(-10.3)#4,092 |
| 52. | Church Hill | 6.6% | 19.7%(-13.1)#52 | 16.9%(-10.3)#4,108 |
| 53. | Trimble | 6.7% | 19.7%(-13.0)#53 | 16.9%(-10.3)#4,146 |
| 54. | Piperton | 6.8% | 19.7%(-12.9)#54 | 16.9%(-10.2)#4,206 |
| 55. | Byrdstown | 7.1% | 19.7%(-12.5)#55 | 16.9%(-9.80)#4,468 |
| 56. | Braden | 7.1% | 19.7%(-12.5)#56 | 16.9%(-9.80)#4,484 |
| 57. | Greenbrier | 7.2% | 19.7%(-12.5)#57 | 16.9%(-9.73)#4,529 |
| 58. | Rutherford | 7.2% | 19.7%(-12.5)#58 | 16.9%(-9.73)#4,533 |
| 59. | Millersville | 7.3% | 19.7%(-12.4)#59 | 16.9%(-9.66)#4,571 |
| 60. | Lynchburg | 7.7% | 19.7%(-11.9)#60 | 16.9%(-9.20)#4,863 |
| 61. | Finley | 7.8% | 19.7%(-11.9)#61 | 16.9%(-9.15)#4,904 |
| 62. | Guys | 7.9% | 19.7%(-11.8)#62 | 16.9%(-9.04)#4,970 |
| 63. | Colonial Heights | 8.1% | 19.7%(-11.6)#63 | 16.9%(-8.87)#5,072 |
| 64. | Tennessee Ridge | 8.1% | 19.7%(-11.6)#64 | 16.9%(-8.82)#5,104 |
| 65. | Jasper | 8.1% | 19.7%(-11.6)#65 | 16.9%(-8.82)#5,110 |
| 66. | Spring City | 8.1% | 19.7%(-11.6)#66 | 16.9%(-8.81)#5,116 |
| 67. | Kenton | 8.2% | 19.7%(-11.5)#67 | 16.9%(-8.78)#5,131 |
| 68. | Gatlinburg | 8.3% | 19.7%(-11.4)#68 | 16.9%(-8.65)#5,208 |
| 69. | Ridgeside | 8.3% | 19.7%(-11.4)#69 | 16.9%(-8.63)#5,220 |
| 70. | Harrogate | 8.4% | 19.7%(-11.2)#70 | 16.9%(-8.50)#5,323 |
| 71. | Ashland City | 8.5% | 19.7%(-11.2)#71 | 16.9%(-8.47)#5,340 |
| 72. | Kimball | 8.9% | 19.7%(-10.8)#72 | 16.9%(-8.08)#5,615 |
| 73. | Coopertown | 8.9% | 19.7%(-10.8)#73 | 16.9%(-8.02)#5,657 |
| 74. | Hilham | 9.0% | 19.7%(-10.7)#74 | 16.9%(-7.98)#5,688 |
| 75. | Walnut Hill | 9.0% | 19.7%(-10.7)#75 | 16.9%(-7.97)#5,698 |
| 76. | Chesterfield | 9.0% | 19.7%(-10.7)#76 | 16.9%(-7.96)#5,702 |
| 77. | Troy | 9.0% | 19.7%(-10.7)#77 | 16.9%(-7.95)#5,714 |
| 78. | Olivet | 9.2% | 19.7%(-10.5)#78 | 16.9%(-7.77)#5,841 |
| 79. | Hendersonville | 9.2% | 19.7%(-10.5)#79 | 16.9%(-7.73)#5,865 |
| 80. | Mosheim | 9.4% | 19.7%(-10.3)#80 | 16.9%(-7.58)#5,951 |
| 81. | Selmer | 9.4% | 19.7%(-10.3)#81 | 16.9%(-7.57)#5,959 |
| 82. | Townsend | 9.4% | 19.7%(-10.3)#82 | 16.9%(-7.53)#5,995 |
| 83. | Jacksboro | 9.7% | 19.7%(-9.98)#83 | 16.9%(-7.24)#6,166 |
| 84. | Mowbray Mountain | 9.7% | 19.7%(-9.96)#84 | 16.9%(-7.22)#6,174 |
| 85. | Middle Valley | 9.8% | 19.7%(-9.91)#85 | 16.9%(-7.16)#6,218 |
| 86. | Midtown | 9.9% | 19.7%(-9.82)#86 | 16.9%(-7.08)#6,256 |
| 87. | Maryville | 10.0% | 19.7%(-9.73)#87 | 16.9%(-6.98)#6,320 |
| 88. | New Tazewell | 10.1% | 19.7%(-9.60)#88 | 16.9%(-6.86)#6,424 |
| 89. | Westmoreland | 10.3% | 19.7%(-9.42)#89 | 16.9%(-6.68)#6,526 |
| 90. | Mount Carmel | 10.5% | 19.7%(-9.19)#90 | 16.9%(-6.45)#6,648 |
| 91. | Forest Hills | 10.5% | 19.7%(-9.14)#91 | 16.9%(-6.39)#6,684 |
| 92. | Seymour | 10.8% | 19.7%(-8.88)#92 | 16.9%(-6.13)#6,835 |
| 93. | Oakland | 10.8% | 19.7%(-8.84)#93 | 16.9%(-6.10)#6,858 |
| 94. | Atoka | 10.9% | 19.7%(-8.76)#94 | 16.9%(-6.01)#6,922 |
| 95. | Loretto | 11.0% | 19.7%(-8.70)#95 | 16.9%(-5.95)#6,950 |
| 96. | Linden | 11.0% | 19.7%(-8.64)#96 | 16.9%(-5.90)#6,990 |
| 97. | Sewanee | 11.0% | 19.7%(-8.64)#97 | 16.9%(-5.90)#6,991 |
| 98. | Murfreesboro | 11.1% | 19.7%(-8.56)#98 | 16.9%(-5.82)#7,079 |
| 99. | Bell Buckle | 11.3% | 19.7%(-8.39)#99 | 16.9%(-5.65)#7,167 |
| 100. | Dresden | 11.3% | 19.7%(-8.35)#100 | 16.9%(-5.61)#7,188 |
Common Questions
What are the Top 10 Cities with the Lowest Poverty Level Among Children Under the Age of 16 in Tennessee?
Top 10 Cities with the Lowest Poverty Level Among Children Under the Age of 16 in Tennessee are:
#1
0.11%
#2
0.28%
#3
1.0%
#4
1.1%
#5
1.3%
#6
1.3%
#7
1.4%
#8
1.4%
#9
1.6%
#10
1.7%
What city has the Lowest Poverty Level Among Children Under the Age of 16 in Tennessee?
Pleasant View has the Lowest Poverty Level Among Children Under the Age of 16 in Tennessee with 0.11%.
What is the Poverty Level Among Children Under the Age of 16 in the State of Tennessee?
Poverty Level Among Children Under the Age of 16 in Tennessee is 19.7%.
What is the Poverty Level Among Children Under the Age of 16 in the United States?
Poverty Level Among Children Under the Age of 16 in the United States is 16.9%.