Cities with the Lowest Poverty Level Among Children Under the Age of 16 in Florida
RELATED REPORTS & OPTIONS
Lowest Poverty | Child 0-16
Florida
Compare Cities
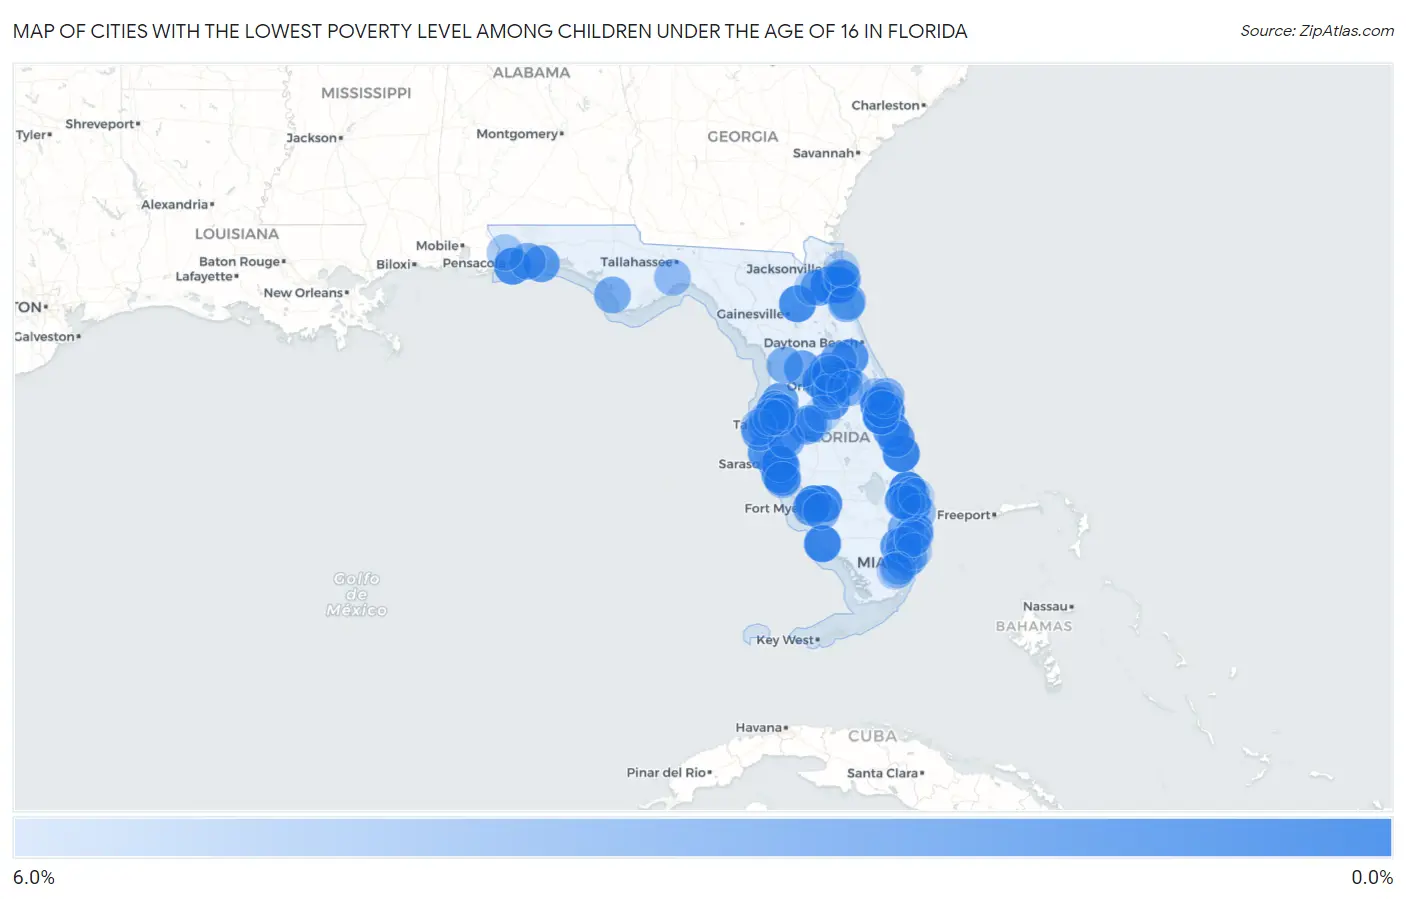
Map of Cities with the Lowest Poverty Level Among Children Under the Age of 16 in Florida
6.0%
0.0%
Cities with the Lowest Poverty Level Among Children Under the Age of 16 in Florida
| City | Child Poverty | vs State | vs National | |
| 1. | Fruit Cove | 0.57% | 17.9%(-17.3)#1 | 16.9%(-16.4)#82 |
| 2. | Jupiter Farms | 0.58% | 17.9%(-17.3)#2 | 16.9%(-16.4)#86 |
| 3. | Nocatee | 0.61% | 17.9%(-17.3)#3 | 16.9%(-16.3)#101 |
| 4. | St Lucie Village | 0.62% | 17.9%(-17.3)#4 | 16.9%(-16.3)#108 |
| 5. | Viera West | 0.64% | 17.9%(-17.3)#5 | 16.9%(-16.3)#114 |
| 6. | Satellite Beach | 0.69% | 17.9%(-17.2)#6 | 16.9%(-16.3)#127 |
| 7. | Lely Resort | 0.74% | 17.9%(-17.2)#7 | 16.9%(-16.2)#147 |
| 8. | Olga | 1.0% | 17.9%(-16.9)#8 | 16.9%(-15.9)#281 |
| 9. | Waldo | 1.1% | 17.9%(-16.8)#9 | 16.9%(-15.9)#315 |
| 10. | Lake Sarasota | 1.1% | 17.9%(-16.8)#10 | 16.9%(-15.9)#333 |
| 11. | Suncoast Estates | 1.1% | 17.9%(-16.8)#11 | 16.9%(-15.8)#354 |
| 12. | Northdale | 1.1% | 17.9%(-16.8)#12 | 16.9%(-15.8)#365 |
| 13. | Gulf Breeze | 1.3% | 17.9%(-16.6)#13 | 16.9%(-15.6)#458 |
| 14. | Southgate | 1.4% | 17.9%(-16.5)#14 | 16.9%(-15.6)#474 |
| 15. | Celebration | 1.4% | 17.9%(-16.5)#15 | 16.9%(-15.6)#475 |
| 16. | Montverde | 1.4% | 17.9%(-16.5)#16 | 16.9%(-15.5)#525 |
| 17. | Lake Belvedere Estates | 1.6% | 17.9%(-16.3)#17 | 16.9%(-15.4)#608 |
| 18. | Lake Helen | 1.6% | 17.9%(-16.3)#18 | 16.9%(-15.3)#617 |
| 19. | Rainbow Lakes Estates | 1.7% | 17.9%(-16.3)#19 | 16.9%(-15.3)#662 |
| 20. | Holmes Beach | 1.7% | 17.9%(-16.2)#20 | 16.9%(-15.3)#683 |
| 21. | Lighthouse Point | 1.7% | 17.9%(-16.2)#21 | 16.9%(-15.2)#686 |
| 22. | Micco | 1.7% | 17.9%(-16.2)#22 | 16.9%(-15.2)#689 |
| 23. | Vero Lake Estates | 1.7% | 17.9%(-16.2)#23 | 16.9%(-15.2)#708 |
| 24. | Minneola | 1.8% | 17.9%(-16.2)#24 | 16.9%(-15.2)#736 |
| 25. | Windermere | 1.8% | 17.9%(-16.1)#25 | 16.9%(-15.1)#774 |
| 26. | West Melbourne | 1.8% | 17.9%(-16.1)#26 | 16.9%(-15.1)#776 |
| 27. | Wekiwa Springs | 1.8% | 17.9%(-16.1)#27 | 16.9%(-15.1)#787 |
| 28. | Venice | 1.9% | 17.9%(-16.1)#28 | 16.9%(-15.1)#795 |
| 29. | Southwest Ranches | 1.9% | 17.9%(-16.0)#29 | 16.9%(-15.1)#805 |
| 30. | Laurel | 1.9% | 17.9%(-16.0)#30 | 16.9%(-15.1)#823 |
| 31. | Mary Esther | 1.9% | 17.9%(-16.0)#31 | 16.9%(-15.0)#866 |
| 32. | Lakeland Highlands | 1.9% | 17.9%(-16.0)#32 | 16.9%(-15.0)#875 |
| 33. | Keystone | 2.0% | 17.9%(-15.9)#33 | 16.9%(-14.9)#931 |
| 34. | The Acreage | 2.0% | 17.9%(-15.9)#34 | 16.9%(-14.9)#940 |
| 35. | Apollo Beach | 2.1% | 17.9%(-15.8)#35 | 16.9%(-14.8)#1,006 |
| 36. | Winter Beach | 2.2% | 17.9%(-15.8)#36 | 16.9%(-14.8)#1,017 |
| 37. | Connerton | 2.2% | 17.9%(-15.7)#37 | 16.9%(-14.8)#1,022 |
| 38. | Tangerine | 2.3% | 17.9%(-15.6)#38 | 16.9%(-14.6)#1,099 |
| 39. | Lochmoor Waterway Estates | 2.5% | 17.9%(-15.4)#39 | 16.9%(-14.4)#1,253 |
| 40. | Feather Sound | 2.5% | 17.9%(-15.4)#40 | 16.9%(-14.4)#1,263 |
| 41. | Fern Park | 2.5% | 17.9%(-15.4)#41 | 16.9%(-14.4)#1,277 |
| 42. | North Redington Beach | 2.6% | 17.9%(-15.3)#42 | 16.9%(-14.4)#1,313 |
| 43. | Coleman | 2.6% | 17.9%(-15.3)#43 | 16.9%(-14.3)#1,330 |
| 44. | Vilano Beach | 2.7% | 17.9%(-15.2)#44 | 16.9%(-14.3)#1,386 |
| 45. | Safety Harbor | 2.7% | 17.9%(-15.2)#45 | 16.9%(-14.3)#1,389 |
| 46. | Odessa | 2.7% | 17.9%(-15.2)#46 | 16.9%(-14.2)#1,395 |
| 47. | Gotha | 2.7% | 17.9%(-15.2)#47 | 16.9%(-14.2)#1,428 |
| 48. | Pine Lakes | 2.8% | 17.9%(-15.1)#48 | 16.9%(-14.2)#1,463 |
| 49. | Fruitville | 2.9% | 17.9%(-15.0)#49 | 16.9%(-14.1)#1,513 |
| 50. | Asbury Lake | 2.9% | 17.9%(-15.0)#50 | 16.9%(-14.1)#1,515 |
| 51. | June Park | 2.9% | 17.9%(-15.0)#51 | 16.9%(-14.0)#1,537 |
| 52. | Virginia Gardens | 3.0% | 17.9%(-14.9)#52 | 16.9%(-13.9)#1,606 |
| 53. | St Augustine Beach | 3.0% | 17.9%(-14.9)#53 | 16.9%(-13.9)#1,631 |
| 54. | El Portal | 3.0% | 17.9%(-14.9)#54 | 16.9%(-13.9)#1,638 |
| 55. | Holley | 3.1% | 17.9%(-14.8)#55 | 16.9%(-13.9)#1,655 |
| 56. | Mexico Beach | 3.1% | 17.9%(-14.8)#56 | 16.9%(-13.9)#1,656 |
| 57. | Parkland | 3.1% | 17.9%(-14.8)#57 | 16.9%(-13.8)#1,691 |
| 58. | Fuller Heights | 3.2% | 17.9%(-14.7)#58 | 16.9%(-13.7)#1,745 |
| 59. | Inverness Highlands North | 3.2% | 17.9%(-14.7)#59 | 16.9%(-13.7)#1,779 |
| 60. | Miami Lakes | 3.3% | 17.9%(-14.6)#60 | 16.9%(-13.6)#1,814 |
| 61. | Sun City Center | 3.4% | 17.9%(-14.5)#61 | 16.9%(-13.5)#1,905 |
| 62. | Gateway | 3.5% | 17.9%(-14.4)#62 | 16.9%(-13.5)#1,938 |
| 63. | Palm Valley | 3.5% | 17.9%(-14.4)#63 | 16.9%(-13.5)#1,949 |
| 64. | Sawgrass | 3.6% | 17.9%(-14.3)#64 | 16.9%(-13.4)#2,003 |
| 65. | Westwood Lakes | 3.6% | 17.9%(-14.3)#65 | 16.9%(-13.3)#2,014 |
| 66. | Cape Canaveral | 3.7% | 17.9%(-14.2)#66 | 16.9%(-13.3)#2,065 |
| 67. | St Augustine Shores | 3.7% | 17.9%(-14.2)#67 | 16.9%(-13.2)#2,105 |
| 68. | Cheval | 3.7% | 17.9%(-14.2)#68 | 16.9%(-13.2)#2,112 |
| 69. | Lutz | 3.8% | 17.9%(-14.1)#69 | 16.9%(-13.1)#2,153 |
| 70. | Palm Beach Gardens | 3.9% | 17.9%(-14.0)#70 | 16.9%(-13.1)#2,193 |
| 71. | Crawfordville | 4.0% | 17.9%(-13.9)#71 | 16.9%(-12.9)#2,316 |
| 72. | Hypoluxo | 4.2% | 17.9%(-13.7)#72 | 16.9%(-12.8)#2,412 |
| 73. | Lauderdale By The Sea | 4.3% | 17.9%(-13.7)#73 | 16.9%(-12.7)#2,455 |
| 74. | Lake Kerr | 4.4% | 17.9%(-13.5)#74 | 16.9%(-12.5)#2,558 |
| 75. | Indian Rocks Beach | 4.5% | 17.9%(-13.5)#75 | 16.9%(-12.5)#2,608 |
| 76. | Alafaya | 4.5% | 17.9%(-13.4)#76 | 16.9%(-12.5)#2,620 |
| 77. | Cooper City | 4.5% | 17.9%(-13.4)#77 | 16.9%(-12.5)#2,633 |
| 78. | Royal Palm Beach | 4.5% | 17.9%(-13.4)#78 | 16.9%(-12.4)#2,646 |
| 79. | Venice Gardens | 4.7% | 17.9%(-13.2)#79 | 16.9%(-12.3)#2,750 |
| 80. | Gonzalez | 4.7% | 17.9%(-13.2)#80 | 16.9%(-12.2)#2,792 |
| 81. | Golden Beach | 4.9% | 17.9%(-13.0)#81 | 16.9%(-12.1)#2,879 |
| 82. | Hurlburt Field | 4.9% | 17.9%(-13.0)#82 | 16.9%(-12.0)#2,900 |
| 83. | Country Walk | 5.0% | 17.9%(-13.0)#83 | 16.9%(-12.0)#2,946 |
| 84. | Cocoa | 5.0% | 17.9%(-12.9)#84 | 16.9%(-12.0)#2,956 |
| 85. | Cocoa Beach | 5.0% | 17.9%(-12.9)#85 | 16.9%(-11.9)#2,988 |
| 86. | Wilton Manors | 5.0% | 17.9%(-12.9)#86 | 16.9%(-11.9)#2,997 |
| 87. | Highland City | 5.2% | 17.9%(-12.8)#87 | 16.9%(-11.8)#3,084 |
| 88. | Palm Shores | 5.2% | 17.9%(-12.8)#88 | 16.9%(-11.8)#3,087 |
| 89. | Bradfordville | 5.2% | 17.9%(-12.7)#89 | 16.9%(-11.8)#3,094 |
| 90. | Carrollwood | 5.2% | 17.9%(-12.7)#90 | 16.9%(-11.8)#3,105 |
| 91. | Horizon West | 5.2% | 17.9%(-12.7)#91 | 16.9%(-11.7)#3,139 |
| 92. | Westlake | 5.2% | 17.9%(-12.7)#92 | 16.9%(-11.7)#3,142 |
| 93. | Middleburg | 5.2% | 17.9%(-12.7)#93 | 16.9%(-11.7)#3,144 |
| 94. | The Crossings | 5.3% | 17.9%(-12.6)#94 | 16.9%(-11.6)#3,188 |
| 95. | Conway | 5.3% | 17.9%(-12.6)#95 | 16.9%(-11.6)#3,192 |
| 96. | Westchase | 5.4% | 17.9%(-12.5)#96 | 16.9%(-11.6)#3,233 |
| 97. | North Palm Beach | 5.4% | 17.9%(-12.5)#97 | 16.9%(-11.5)#3,254 |
| 98. | Zellwood | 5.4% | 17.9%(-12.5)#98 | 16.9%(-11.5)#3,264 |
| 99. | Lake Alfred | 5.5% | 17.9%(-12.4)#99 | 16.9%(-11.5)#3,290 |
| 100. | Atlantic Beach | 5.5% | 17.9%(-12.4)#100 | 16.9%(-11.5)#3,295 |
Common Questions
What are the Top 10 Cities with the Lowest Poverty Level Among Children Under the Age of 16 in Florida?
Top 10 Cities with the Lowest Poverty Level Among Children Under the Age of 16 in Florida are:
#1
0.57%
#2
0.58%
#3
0.61%
#4
0.62%
#5
0.64%
#6
0.69%
#7
0.74%
#8
1.0%
#9
1.1%
#10
1.1%
What city has the Lowest Poverty Level Among Children Under the Age of 16 in Florida?
Fruit Cove has the Lowest Poverty Level Among Children Under the Age of 16 in Florida with 0.57%.
What is the Poverty Level Among Children Under the Age of 16 in the State of Florida?
Poverty Level Among Children Under the Age of 16 in Florida is 17.9%.
What is the Poverty Level Among Children Under the Age of 16 in the United States?
Poverty Level Among Children Under the Age of 16 in the United States is 16.9%.