Cities with the Lowest Poverty Level Among Children Under the Age of 16 in New York
RELATED REPORTS & OPTIONS
Lowest Poverty | Child 0-16
New York
Compare Cities
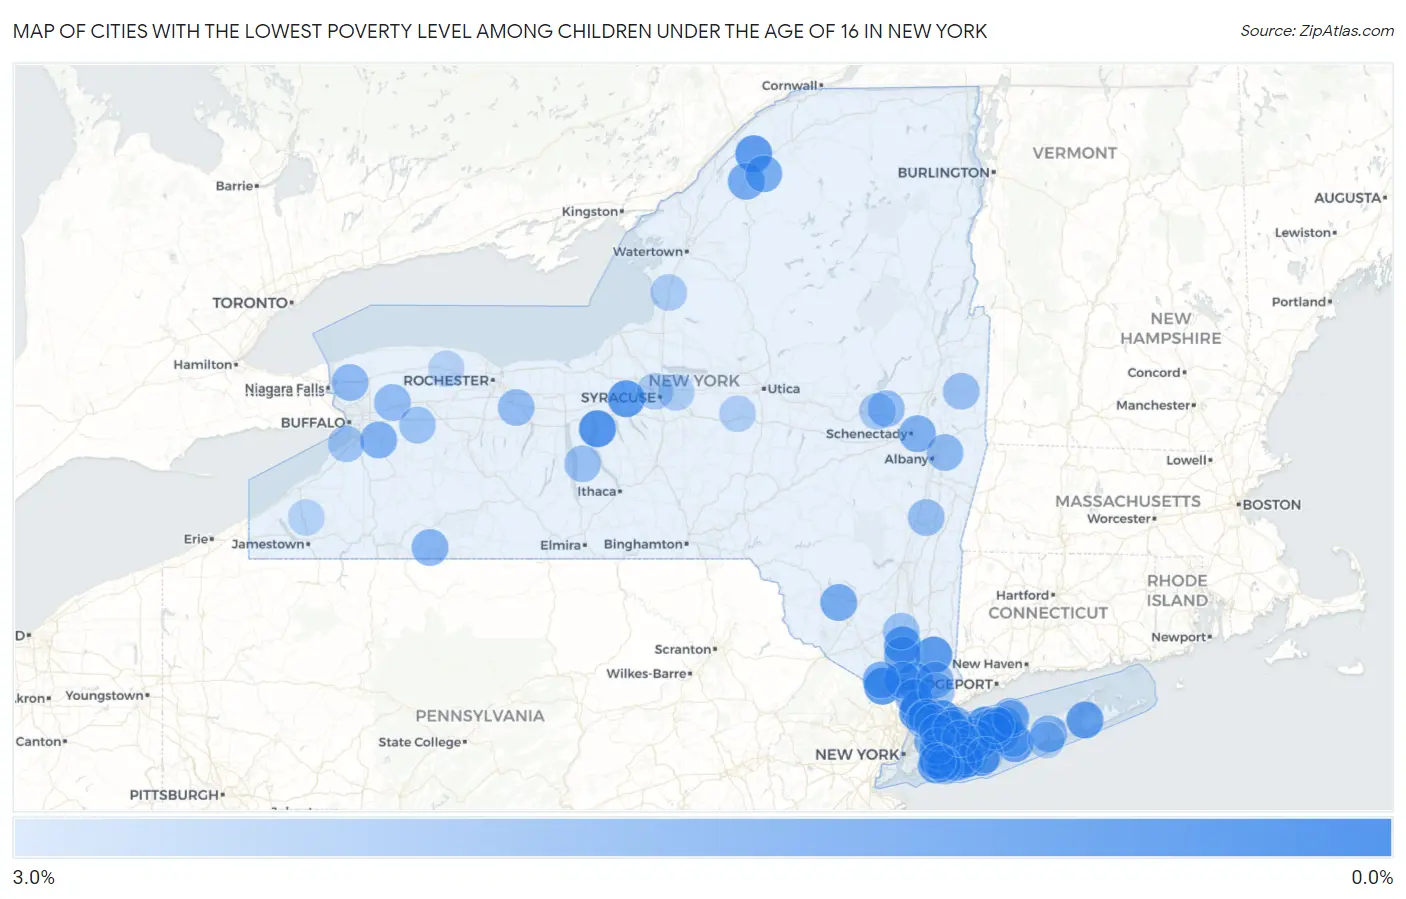
Map of Cities with the Lowest Poverty Level Among Children Under the Age of 16 in New York
3.0%
0.0%
Cities with the Lowest Poverty Level Among Children Under the Age of 16 in New York
| City | Child Poverty | vs State | vs National | |
| 1. | North Valley Stream | 0.22% | 18.3%(-18.1)#1 | 16.9%(-16.7)#11 |
| 2. | Rockville Centre | 0.41% | 18.3%(-17.9)#2 | 16.9%(-16.5)#42 |
| 3. | East Massapequa | 0.43% | 18.3%(-17.9)#3 | 16.9%(-16.5)#47 |
| 4. | Greenville Cdp Westchester County | 0.54% | 18.3%(-17.8)#4 | 16.9%(-16.4)#74 |
| 5. | Elwood | 0.54% | 18.3%(-17.8)#5 | 16.9%(-16.4)#75 |
| 6. | Williston Park | 0.57% | 18.3%(-17.8)#6 | 16.9%(-16.4)#84 |
| 7. | Union Springs | 0.74% | 18.3%(-17.6)#7 | 16.9%(-16.2)#151 |
| 8. | Rye | 0.75% | 18.3%(-17.6)#8 | 16.9%(-16.2)#154 |
| 9. | Commack | 0.82% | 18.3%(-17.5)#9 | 16.9%(-16.1)#179 |
| 10. | North Hills | 0.83% | 18.3%(-17.5)#10 | 16.9%(-16.1)#190 |
| 11. | Hastings On Hudson | 0.83% | 18.3%(-17.5)#11 | 16.9%(-16.1)#194 |
| 12. | Sloatsburg | 0.86% | 18.3%(-17.5)#12 | 16.9%(-16.1)#213 |
| 13. | North New Hyde Park | 0.86% | 18.3%(-17.5)#13 | 16.9%(-16.1)#215 |
| 14. | Elbridge | 0.87% | 18.3%(-17.5)#14 | 16.9%(-16.1)#219 |
| 15. | St James | 0.88% | 18.3%(-17.5)#15 | 16.9%(-16.1)#227 |
| 16. | Plainview | 0.89% | 18.3%(-17.5)#16 | 16.9%(-16.1)#231 |
| 17. | Mahopac | 0.89% | 18.3%(-17.5)#17 | 16.9%(-16.0)#232 |
| 18. | Babylon | 0.94% | 18.3%(-17.4)#18 | 16.9%(-16.0)#249 |
| 19. | Rensselaer Falls | 0.95% | 18.3%(-17.4)#19 | 16.9%(-16.0)#254 |
| 20. | Croton On Hudson | 0.98% | 18.3%(-17.4)#20 | 16.9%(-16.0)#266 |
| 21. | Cornwall On Hudson | 1.0% | 18.3%(-17.3)#21 | 16.9%(-15.9)#284 |
| 22. | Woodmere | 1.0% | 18.3%(-17.3)#22 | 16.9%(-15.9)#298 |
| 23. | North Sea | 1.0% | 18.3%(-17.3)#23 | 16.9%(-15.9)#302 |
| 24. | Fort Salonga | 1.1% | 18.3%(-17.3)#24 | 16.9%(-15.9)#328 |
| 25. | North Patchogue | 1.2% | 18.3%(-17.2)#25 | 16.9%(-15.8)#369 |
| 26. | Manhasset Hills | 1.2% | 18.3%(-17.1)#26 | 16.9%(-15.7)#401 |
| 27. | Lattingtown | 1.2% | 18.3%(-17.1)#27 | 16.9%(-15.7)#402 |
| 28. | East Setauket | 1.3% | 18.3%(-17.1)#28 | 16.9%(-15.7)#426 |
| 29. | Stony Brook | 1.3% | 18.3%(-17.1)#29 | 16.9%(-15.7)#434 |
| 30. | West Point | 1.3% | 18.3%(-17.1)#30 | 16.9%(-15.7)#438 |
| 31. | Thiells | 1.3% | 18.3%(-17.1)#31 | 16.9%(-15.7)#439 |
| 32. | Nesconset | 1.3% | 18.3%(-17.0)#32 | 16.9%(-15.6)#448 |
| 33. | Dobbs Ferry | 1.4% | 18.3%(-17.0)#33 | 16.9%(-15.6)#473 |
| 34. | Richville | 1.4% | 18.3%(-17.0)#34 | 16.9%(-15.6)#481 |
| 35. | Woodridge | 1.4% | 18.3%(-16.9)#35 | 16.9%(-15.5)#512 |
| 36. | Tuxedo Park | 1.4% | 18.3%(-16.9)#36 | 16.9%(-15.5)#521 |
| 37. | Fairview Cdp Westchester County | 1.4% | 18.3%(-16.9)#37 | 16.9%(-15.5)#527 |
| 38. | Hermon | 1.5% | 18.3%(-16.9)#38 | 16.9%(-15.5)#537 |
| 39. | Kings Park | 1.5% | 18.3%(-16.9)#39 | 16.9%(-15.5)#538 |
| 40. | Head Of The Harbor | 1.5% | 18.3%(-16.9)#40 | 16.9%(-15.4)#556 |
| 41. | Saddle Rock | 1.5% | 18.3%(-16.8)#41 | 16.9%(-15.4)#562 |
| 42. | Garden City South | 1.5% | 18.3%(-16.8)#42 | 16.9%(-15.4)#577 |
| 43. | Dix Hills | 1.5% | 18.3%(-16.8)#43 | 16.9%(-15.4)#589 |
| 44. | Niskayuna | 1.6% | 18.3%(-16.8)#44 | 16.9%(-15.4)#599 |
| 45. | Eastport | 1.6% | 18.3%(-16.8)#45 | 16.9%(-15.4)#607 |
| 46. | East Aurora | 1.6% | 18.3%(-16.7)#46 | 16.9%(-15.3)#630 |
| 47. | Mount Kisco | 1.7% | 18.3%(-16.7)#47 | 16.9%(-15.3)#660 |
| 48. | Bolivar | 1.7% | 18.3%(-16.7)#48 | 16.9%(-15.3)#667 |
| 49. | South Huntington | 1.7% | 18.3%(-16.7)#49 | 16.9%(-15.3)#672 |
| 50. | Merrick | 1.7% | 18.3%(-16.7)#50 | 16.9%(-15.3)#680 |
| 51. | Milton Cdp Saratoga County | 1.7% | 18.3%(-16.6)#51 | 16.9%(-15.2)#718 |
| 52. | Garden City | 1.7% | 18.3%(-16.6)#52 | 16.9%(-15.2)#720 |
| 53. | Bayville | 1.7% | 18.3%(-16.6)#53 | 16.9%(-15.2)#721 |
| 54. | Sanborn | 1.8% | 18.3%(-16.6)#54 | 16.9%(-15.1)#755 |
| 55. | Nyack | 1.8% | 18.3%(-16.5)#55 | 16.9%(-15.1)#763 |
| 56. | South Farmingdale | 1.8% | 18.3%(-16.5)#56 | 16.9%(-15.1)#768 |
| 57. | Wynantskill | 1.8% | 18.3%(-16.5)#57 | 16.9%(-15.1)#790 |
| 58. | Hicksville | 1.9% | 18.3%(-16.5)#58 | 16.9%(-15.1)#816 |
| 59. | Akron | 1.9% | 18.3%(-16.5)#59 | 16.9%(-15.0)#826 |
| 60. | Holtsville | 1.9% | 18.3%(-16.5)#60 | 16.9%(-15.0)#827 |
| 61. | Hagaman | 1.9% | 18.3%(-16.4)#61 | 16.9%(-15.0)#833 |
| 62. | Victor | 1.9% | 18.3%(-16.4)#62 | 16.9%(-15.0)#844 |
| 63. | Floral Park | 1.9% | 18.3%(-16.4)#63 | 16.9%(-15.0)#847 |
| 64. | Levittown | 1.9% | 18.3%(-16.4)#64 | 16.9%(-15.0)#851 |
| 65. | Athens | 1.9% | 18.3%(-16.4)#65 | 16.9%(-15.0)#865 |
| 66. | Stewart Manor | 1.9% | 18.3%(-16.4)#66 | 16.9%(-15.0)#869 |
| 67. | Armonk | 1.9% | 18.3%(-16.4)#67 | 16.9%(-15.0)#876 |
| 68. | Greenwich | 2.0% | 18.3%(-16.4)#68 | 16.9%(-15.0)#886 |
| 69. | Belle Terre | 2.0% | 18.3%(-16.4)#69 | 16.9%(-15.0)#897 |
| 70. | Massapequa | 2.0% | 18.3%(-16.3)#70 | 16.9%(-14.9)#907 |
| 71. | North Massapequa | 2.0% | 18.3%(-16.3)#71 | 16.9%(-14.9)#909 |
| 72. | Lodi | 2.0% | 18.3%(-16.3)#72 | 16.9%(-14.9)#914 |
| 73. | Balmville | 2.0% | 18.3%(-16.3)#73 | 16.9%(-14.9)#918 |
| 74. | Attica | 2.0% | 18.3%(-16.3)#74 | 16.9%(-14.9)#936 |
| 75. | Melville | 2.1% | 18.3%(-16.3)#75 | 16.9%(-14.9)#945 |
| 76. | Bronxville | 2.1% | 18.3%(-16.3)#76 | 16.9%(-14.9)#951 |
| 77. | Port Jefferson | 2.1% | 18.3%(-16.2)#77 | 16.9%(-14.8)#996 |
| 78. | Bellmore | 2.1% | 18.3%(-16.2)#78 | 16.9%(-14.8)#1,001 |
| 79. | Wanakah | 2.1% | 18.3%(-16.2)#79 | 16.9%(-14.8)#1,007 |
| 80. | Roslyn Estates | 2.2% | 18.3%(-16.2)#80 | 16.9%(-14.8)#1,031 |
| 81. | Eastchester | 2.2% | 18.3%(-16.1)#81 | 16.9%(-14.7)#1,045 |
| 82. | Larchmont | 2.2% | 18.3%(-16.1)#82 | 16.9%(-14.7)#1,049 |
| 83. | Oceanside | 2.2% | 18.3%(-16.1)#83 | 16.9%(-14.7)#1,051 |
| 84. | Fort Johnson | 2.2% | 18.3%(-16.1)#84 | 16.9%(-14.7)#1,055 |
| 85. | Lake Success | 2.2% | 18.3%(-16.1)#85 | 16.9%(-14.7)#1,064 |
| 86. | Galeville | 2.3% | 18.3%(-16.0)#86 | 16.9%(-14.6)#1,104 |
| 87. | Smithtown | 2.3% | 18.3%(-16.0)#87 | 16.9%(-14.6)#1,108 |
| 88. | Mannsville | 2.3% | 18.3%(-16.0)#88 | 16.9%(-14.6)#1,117 |
| 89. | Minoa | 2.4% | 18.3%(-16.0)#89 | 16.9%(-14.6)#1,142 |
| 90. | Oriskany Falls | 2.4% | 18.3%(-16.0)#90 | 16.9%(-14.6)#1,148 |
| 91. | Sands Point | 2.4% | 18.3%(-15.9)#91 | 16.9%(-14.5)#1,161 |
| 92. | Locust Valley | 2.4% | 18.3%(-15.9)#92 | 16.9%(-14.5)#1,162 |
| 93. | East Moriches | 2.4% | 18.3%(-15.9)#93 | 16.9%(-14.5)#1,172 |
| 94. | East Rockaway | 2.4% | 18.3%(-15.9)#94 | 16.9%(-14.5)#1,177 |
| 95. | Syosset | 2.4% | 18.3%(-15.9)#95 | 16.9%(-14.5)#1,182 |
| 96. | Valley Stream | 2.4% | 18.3%(-15.9)#96 | 16.9%(-14.5)#1,188 |
| 97. | Sinclairville | 2.5% | 18.3%(-15.9)#97 | 16.9%(-14.5)#1,217 |
| 98. | Nissequogue | 2.5% | 18.3%(-15.8)#98 | 16.9%(-14.4)#1,225 |
| 99. | Holley | 2.5% | 18.3%(-15.8)#99 | 16.9%(-14.4)#1,235 |
| 100. | West Islip | 2.5% | 18.3%(-15.8)#100 | 16.9%(-14.4)#1,244 |
Common Questions
What are the Top 10 Cities with the Lowest Poverty Level Among Children Under the Age of 16 in New York?
Top 10 Cities with the Lowest Poverty Level Among Children Under the Age of 16 in New York are:
#1
0.22%
#2
0.41%
#3
0.43%
#4
0.54%
#5
0.57%
#6
0.74%
#7
0.75%
#8
0.82%
#9
0.83%
#10
0.83%
What city has the Lowest Poverty Level Among Children Under the Age of 16 in New York?
North Valley Stream has the Lowest Poverty Level Among Children Under the Age of 16 in New York with 0.22%.
What is the Poverty Level Among Children Under the Age of 16 in the State of New York?
Poverty Level Among Children Under the Age of 16 in New York is 18.3%.
What is the Poverty Level Among Children Under the Age of 16 in the United States?
Poverty Level Among Children Under the Age of 16 in the United States is 16.9%.