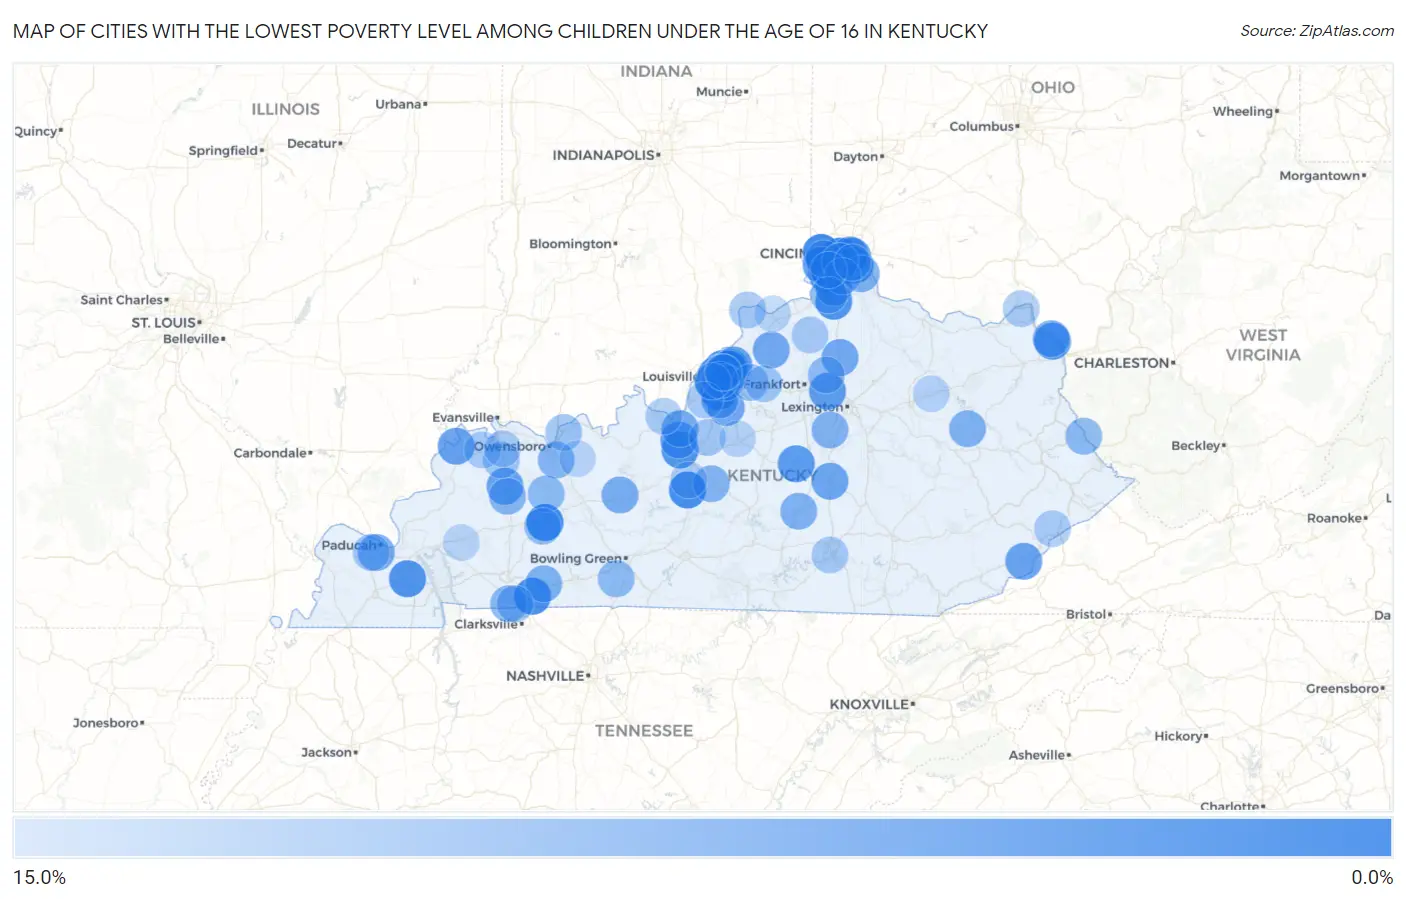
Cities with the Lowest Poverty Level Among Children Under the Age of 16 in Kentucky
RELATED REPORTS & OPTIONS
Lowest Poverty | Child 0-16
Kentucky
Compare Cities
Map of Cities with the Lowest Poverty Level Among Children Under the Age of 16 in Kentucky
15.0%
0.0%
Cities with the Lowest Poverty Level Among Children Under the Age of 16 in Kentucky
| City | Child Poverty | vs State | vs National | |
| 1. | Oakbrook | 0.58% | 21.6%(-21.0)#1 | 16.9%(-16.4)#87 |
| 2. | Langdon Place | 0.75% | 21.6%(-20.8)#2 | 16.9%(-16.2)#157 |
| 3. | Hollow Creek | 0.81% | 21.6%(-20.8)#3 | 16.9%(-16.1)#172 |
| 4. | Bromley | 0.84% | 21.6%(-20.7)#4 | 16.9%(-16.1)#196 |
| 5. | Anchorage | 1.0% | 21.6%(-20.6)#5 | 16.9%(-15.9)#288 |
| 6. | Norbourne Estates | 1.1% | 21.6%(-20.5)#6 | 16.9%(-15.9)#326 |
| 7. | Hurstbourne | 1.3% | 21.6%(-20.3)#7 | 16.9%(-15.6)#450 |
| 8. | Meadow Vale | 1.4% | 21.6%(-20.2)#8 | 16.9%(-15.5)#497 |
| 9. | Powderly | 1.4% | 21.6%(-20.2)#9 | 16.9%(-15.5)#520 |
| 10. | Francisville | 1.5% | 21.6%(-20.1)#10 | 16.9%(-15.4)#578 |
| 11. | Bellemeade | 1.5% | 21.6%(-20.1)#11 | 16.9%(-15.4)#580 |
| 12. | Brownsboro Farm | 1.6% | 21.6%(-19.9)#12 | 16.9%(-15.3)#651 |
| 13. | Thruston | 1.7% | 21.6%(-19.9)#13 | 16.9%(-15.2)#688 |
| 14. | Upton | 2.2% | 21.6%(-19.3)#14 | 16.9%(-14.7)#1,074 |
| 15. | St Matthews | 2.3% | 21.6%(-19.3)#15 | 16.9%(-14.7)#1,092 |
| 16. | Worthington Hills | 2.4% | 21.6%(-19.2)#16 | 16.9%(-14.6)#1,141 |
| 17. | Trenton | 2.6% | 21.6%(-19.0)#17 | 16.9%(-14.4)#1,288 |
| 18. | Wellington | 2.8% | 21.6%(-18.8)#18 | 16.9%(-14.1)#1,481 |
| 19. | Fort Wright | 3.1% | 21.6%(-18.5)#19 | 16.9%(-13.9)#1,662 |
| 20. | Union | 3.1% | 21.6%(-18.5)#20 | 16.9%(-13.9)#1,664 |
| 21. | Benton | 3.2% | 21.6%(-18.4)#21 | 16.9%(-13.7)#1,749 |
| 22. | Bancroft | 3.4% | 21.6%(-18.2)#22 | 16.9%(-13.5)#1,891 |
| 23. | Crittenden | 3.5% | 21.6%(-18.1)#23 | 16.9%(-13.5)#1,945 |
| 24. | Rineyville | 3.7% | 21.6%(-17.9)#24 | 16.9%(-13.2)#2,078 |
| 25. | Maryhill Estates | 3.7% | 21.6%(-17.8)#25 | 16.9%(-13.2)#2,123 |
| 26. | Fort Thomas | 4.0% | 21.6%(-17.6)#26 | 16.9%(-12.9)#2,301 |
| 27. | Cold Spring | 4.2% | 21.6%(-17.4)#27 | 16.9%(-12.8)#2,391 |
| 28. | Bellefonte | 4.4% | 21.6%(-17.2)#28 | 16.9%(-12.5)#2,569 |
| 29. | Perryville | 4.6% | 21.6%(-17.0)#29 | 16.9%(-12.3)#2,703 |
| 30. | Plantation | 4.6% | 21.6%(-17.0)#30 | 16.9%(-12.3)#2,717 |
| 31. | Edgewood | 4.8% | 21.6%(-16.8)#31 | 16.9%(-12.2)#2,795 |
| 32. | Midway | 4.9% | 21.6%(-16.7)#32 | 16.9%(-12.1)#2,868 |
| 33. | Hurstbourne Acres | 4.9% | 21.6%(-16.6)#33 | 16.9%(-12.0)#2,922 |
| 34. | Coldstream | 4.9% | 21.6%(-16.6)#34 | 16.9%(-12.0)#2,925 |
| 35. | Crestwood | 5.2% | 21.6%(-16.4)#35 | 16.9%(-11.8)#3,104 |
| 36. | Burlington | 5.2% | 21.6%(-16.3)#36 | 16.9%(-11.7)#3,136 |
| 37. | Uniontown | 5.7% | 21.6%(-15.9)#37 | 16.9%(-11.2)#3,459 |
| 38. | Vine Grove | 5.8% | 21.6%(-15.8)#38 | 16.9%(-11.2)#3,510 |
| 39. | Benham | 5.9% | 21.6%(-15.7)#39 | 16.9%(-11.1)#3,591 |
| 40. | Slaughters | 5.9% | 21.6%(-15.7)#40 | 16.9%(-11.1)#3,601 |
| 41. | Beechwood Village | 6.1% | 21.6%(-15.5)#41 | 16.9%(-10.9)#3,752 |
| 42. | Walton | 6.1% | 21.6%(-15.4)#42 | 16.9%(-10.8)#3,793 |
| 43. | Stanford | 6.5% | 21.6%(-15.1)#43 | 16.9%(-10.4)#4,031 |
| 44. | Mount Washington | 6.9% | 21.6%(-14.7)#44 | 16.9%(-10.1)#4,263 |
| 45. | New Castle | 6.9% | 21.6%(-14.7)#45 | 16.9%(-10.1)#4,270 |
| 46. | Sadieville | 6.9% | 21.6%(-14.7)#46 | 16.9%(-10.0)#4,298 |
| 47. | Woodlawn | 7.1% | 21.6%(-14.4)#47 | 16.9%(-9.80)#4,491 |
| 48. | Hendron | 7.3% | 21.6%(-14.3)#48 | 16.9%(-9.62)#4,605 |
| 49. | Heritage Creek | 7.4% | 21.6%(-14.2)#49 | 16.9%(-9.57)#4,632 |
| 50. | Fort Knox | 7.5% | 21.6%(-14.1)#50 | 16.9%(-9.46)#4,695 |
| 51. | Caneyville | 7.8% | 21.6%(-13.8)#51 | 16.9%(-9.13)#4,914 |
| 52. | Alexandria | 8.2% | 21.6%(-13.3)#52 | 16.9%(-8.70)#5,177 |
| 53. | Elkton | 8.2% | 21.6%(-13.3)#53 | 16.9%(-8.69)#5,178 |
| 54. | Russell | 8.3% | 21.6%(-13.3)#54 | 16.9%(-8.67)#5,200 |
| 55. | Liberty | 8.5% | 21.6%(-13.1)#55 | 16.9%(-8.46)#5,341 |
| 56. | Ezel | 8.5% | 21.6%(-13.1)#56 | 16.9%(-8.43)#5,370 |
| 57. | Hebron | 8.6% | 21.6%(-13.0)#57 | 16.9%(-8.36)#5,409 |
| 58. | Wilmore | 8.8% | 21.6%(-12.8)#58 | 16.9%(-8.19)#5,533 |
| 59. | Masonville | 9.0% | 21.6%(-12.6)#59 | 16.9%(-7.98)#5,685 |
| 60. | Buffalo | 9.0% | 21.6%(-12.6)#60 | 16.9%(-7.94)#5,727 |
| 61. | Fincastle | 9.1% | 21.6%(-12.5)#61 | 16.9%(-7.85)#5,783 |
| 62. | Fort Campbell North | 9.2% | 21.6%(-12.4)#62 | 16.9%(-7.75)#5,853 |
| 63. | Hanson | 9.3% | 21.6%(-12.3)#63 | 16.9%(-7.68)#5,893 |
| 64. | Warfield | 9.8% | 21.6%(-11.8)#64 | 16.9%(-7.18)#6,204 |
| 65. | Island | 9.9% | 21.6%(-11.7)#65 | 16.9%(-7.03)#6,302 |
| 66. | Briarwood | 10.0% | 21.6%(-11.6)#66 | 16.9%(-6.94)#6,361 |
| 67. | Woodburn | 10.0% | 21.6%(-11.6)#67 | 16.9%(-6.94)#6,368 |
| 68. | Stamping Ground | 10.2% | 21.6%(-11.4)#68 | 16.9%(-6.74)#6,480 |
| 69. | Jeffersontown | 10.6% | 21.6%(-10.9)#69 | 16.9%(-6.29)#6,754 |
| 70. | Oak Grove | 10.7% | 21.6%(-10.9)#70 | 16.9%(-6.23)#6,778 |
| 71. | Greenville | 10.7% | 21.6%(-10.9)#71 | 16.9%(-6.22)#6,779 |
| 72. | Fort Mitchell | 10.9% | 21.6%(-10.7)#72 | 16.9%(-6.08)#6,876 |
| 73. | Simpsonville | 11.1% | 21.6%(-10.5)#73 | 16.9%(-5.83)#7,028 |
| 74. | Independence | 11.2% | 21.6%(-10.4)#74 | 16.9%(-5.77)#7,099 |
| 75. | Maceo | 11.7% | 21.6%(-9.89)#75 | 16.9%(-5.25)#7,400 |
| 76. | Verona | 11.8% | 21.6%(-9.82)#76 | 16.9%(-5.17)#7,440 |
| 77. | Shelbyville | 11.8% | 21.6%(-9.78)#77 | 16.9%(-5.14)#7,478 |
| 78. | Massac | 11.8% | 21.6%(-9.75)#78 | 16.9%(-5.11)#7,487 |
| 79. | Robards | 11.9% | 21.6%(-9.72)#79 | 16.9%(-5.07)#7,506 |
| 80. | Florence | 12.1% | 21.6%(-9.48)#80 | 16.9%(-4.84)#7,647 |
| 81. | Lebanon Junction | 12.2% | 21.6%(-9.37)#81 | 16.9%(-4.73)#7,716 |
| 82. | Milton | 12.4% | 21.6%(-9.21)#82 | 16.9%(-4.57)#7,810 |
| 83. | Burnside | 12.7% | 21.6%(-8.89)#83 | 16.9%(-4.25)#7,986 |
| 84. | St Regis Park | 12.8% | 21.6%(-8.78)#84 | 16.9%(-4.14)#8,059 |
| 85. | Owenton | 12.9% | 21.6%(-8.70)#85 | 16.9%(-4.06)#8,097 |
| 86. | South Shore | 12.9% | 21.6%(-8.63)#86 | 16.9%(-3.99)#8,141 |
| 87. | Corydon | 13.0% | 21.6%(-8.58)#87 | 16.9%(-3.94)#8,159 |
| 88. | Doe Valley | 13.0% | 21.6%(-8.54)#88 | 16.9%(-3.90)#8,182 |
| 89. | Fleming Neon | 13.1% | 21.6%(-8.50)#89 | 16.9%(-3.85)#8,212 |
| 90. | Anthoston | 13.1% | 21.6%(-8.49)#90 | 16.9%(-3.84)#8,216 |
| 91. | Hollyvilla | 13.2% | 21.6%(-8.42)#91 | 16.9%(-3.78)#8,248 |
| 92. | Strathmoor Village | 13.2% | 21.6%(-8.35)#92 | 16.9%(-3.70)#8,290 |
| 93. | Rolling Hills | 13.8% | 21.6%(-7.83)#93 | 16.9%(-3.19)#8,560 |
| 94. | Sonora | 13.8% | 21.6%(-7.79)#94 | 16.9%(-3.15)#8,578 |
| 95. | Owingsville | 14.1% | 21.6%(-7.47)#95 | 16.9%(-2.83)#8,759 |
| 96. | Bardstown | 14.2% | 21.6%(-7.41)#96 | 16.9%(-2.77)#8,787 |
| 97. | Highland Heights | 14.4% | 21.6%(-7.17)#97 | 16.9%(-2.53)#8,936 |
| 98. | Princeton | 14.6% | 21.6%(-7.00)#98 | 16.9%(-2.36)#9,011 |
| 99. | Whitesville | 14.6% | 21.6%(-7.00)#99 | 16.9%(-2.36)#9,016 |
| 100. | Carrollton | 14.6% | 21.6%(-6.94)#100 | 16.9%(-2.30)#9,047 |
Common Questions
What are the Top 10 Cities with the Lowest Poverty Level Among Children Under the Age of 16 in Kentucky?
Top 10 Cities with the Lowest Poverty Level Among Children Under the Age of 16 in Kentucky are:
#1
0.58%
#2
0.75%
#3
0.81%
#4
0.84%
#5
1.0%
#6
1.1%
#7
1.3%
#8
1.4%
#9
1.4%
#10
1.5%
What city has the Lowest Poverty Level Among Children Under the Age of 16 in Kentucky?
Oakbrook has the Lowest Poverty Level Among Children Under the Age of 16 in Kentucky with 0.58%.
What is the Poverty Level Among Children Under the Age of 16 in the State of Kentucky?
Poverty Level Among Children Under the Age of 16 in Kentucky is 21.6%.
What is the Poverty Level Among Children Under the Age of 16 in the United States?
Poverty Level Among Children Under the Age of 16 in the United States is 16.9%.