Cities with the Lowest Poverty Level Among Children Under the Age of 16 in Michigan
RELATED REPORTS & OPTIONS
Lowest Poverty | Child 0-16
Michigan
Compare Cities
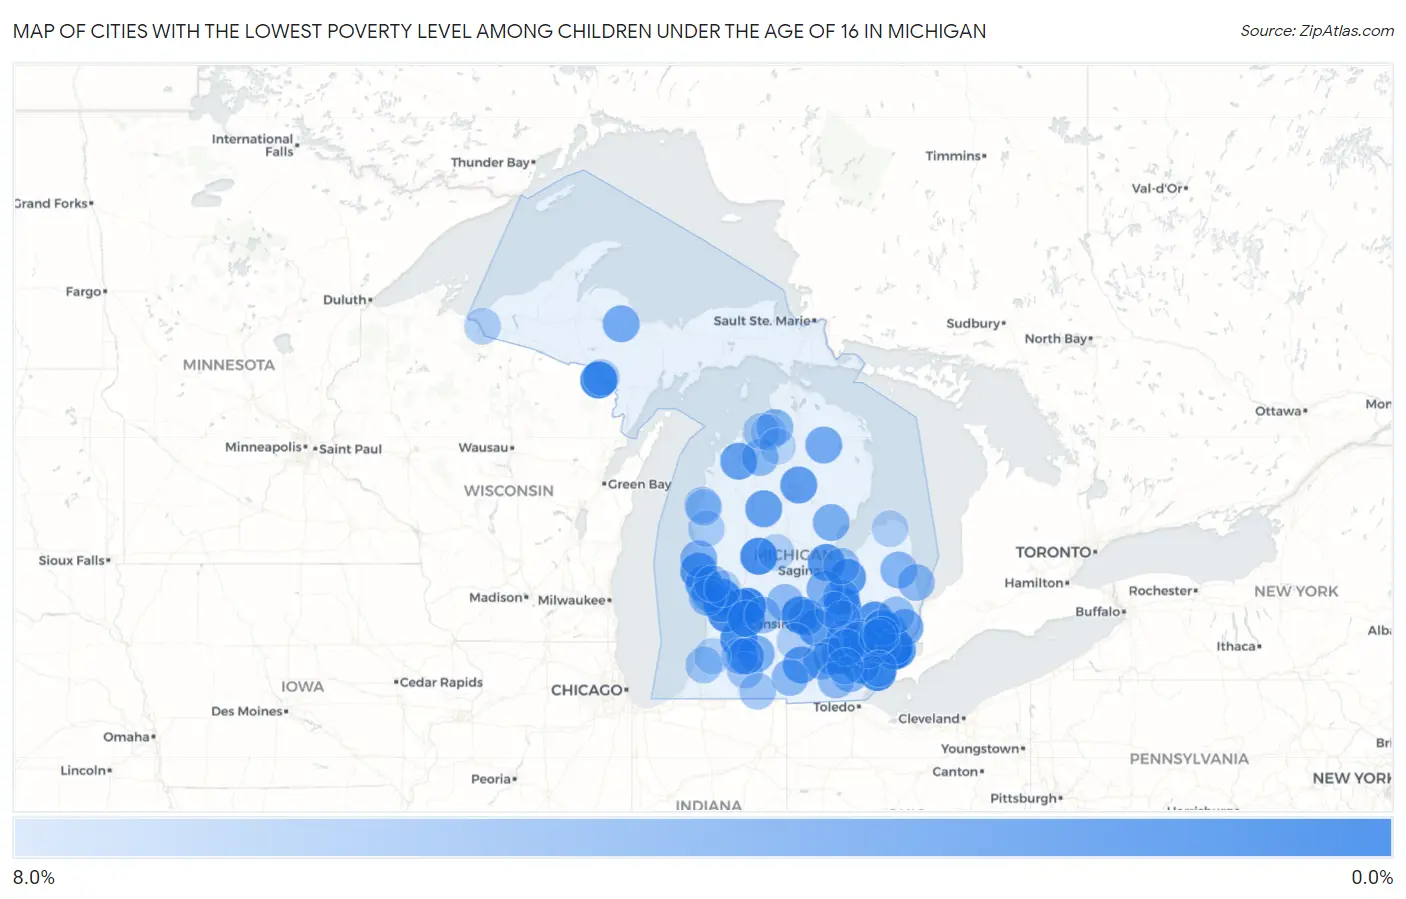
Map of Cities with the Lowest Poverty Level Among Children Under the Age of 16 in Michigan
8.0%
0.0%
Cities with the Lowest Poverty Level Among Children Under the Age of 16 in Michigan
| City | Child Poverty | vs State | vs National | |
| 1. | Grosse Pointe | 0.29% | 18.2%(-18.0)#1 | 16.9%(-16.6)#19 |
| 2. | Forest Hills | 0.51% | 18.2%(-17.7)#2 | 16.9%(-16.4)#65 |
| 3. | Kingsford | 0.69% | 18.2%(-17.6)#3 | 16.9%(-16.2)#130 |
| 4. | Berkley | 0.86% | 18.2%(-17.4)#4 | 16.9%(-16.1)#217 |
| 5. | Gibraltar | 0.91% | 18.2%(-17.3)#5 | 16.9%(-16.0)#243 |
| 6. | Martin | 0.92% | 18.2%(-17.3)#6 | 16.9%(-16.0)#245 |
| 7. | Canadian Lakes | 0.96% | 18.2%(-17.3)#7 | 16.9%(-16.0)#256 |
| 8. | Swartz Creek | 1.1% | 18.2%(-17.2)#8 | 16.9%(-15.9)#306 |
| 9. | East Grand Rapids | 1.1% | 18.2%(-17.1)#9 | 16.9%(-15.8)#339 |
| 10. | Plymouth | 1.1% | 18.2%(-17.1)#10 | 16.9%(-15.8)#347 |
| 11. | Hudsonville | 1.1% | 18.2%(-17.1)#11 | 16.9%(-15.8)#364 |
| 12. | Dewitt | 1.2% | 18.2%(-17.0)#12 | 16.9%(-15.7)#390 |
| 13. | Coopersville | 1.2% | 18.2%(-17.0)#13 | 16.9%(-15.7)#412 |
| 14. | Belleville | 1.4% | 18.2%(-16.9)#14 | 16.9%(-15.5)#501 |
| 15. | South Lyon | 1.5% | 18.2%(-16.7)#15 | 16.9%(-15.4)#566 |
| 16. | Lake Orion | 1.5% | 18.2%(-16.7)#16 | 16.9%(-15.4)#591 |
| 17. | Dexter | 1.6% | 18.2%(-16.6)#17 | 16.9%(-15.3)#652 |
| 18. | Montague | 1.8% | 18.2%(-16.5)#18 | 16.9%(-15.1)#759 |
| 19. | Allendale | 1.9% | 18.2%(-16.4)#19 | 16.9%(-15.1)#801 |
| 20. | Pleasant Ridge | 1.9% | 18.2%(-16.4)#20 | 16.9%(-15.1)#802 |
| 21. | Freeland | 1.9% | 18.2%(-16.4)#21 | 16.9%(-15.1)#806 |
| 22. | Caledonia | 1.9% | 18.2%(-16.4)#22 | 16.9%(-15.1)#814 |
| 23. | Frankenmuth | 1.9% | 18.2%(-16.4)#23 | 16.9%(-15.1)#824 |
| 24. | Williamston | 1.9% | 18.2%(-16.3)#24 | 16.9%(-15.0)#857 |
| 25. | Brighton | 2.0% | 18.2%(-16.2)#25 | 16.9%(-14.9)#921 |
| 26. | Huntington Woods | 2.1% | 18.2%(-16.1)#26 | 16.9%(-14.8)#982 |
| 27. | Grosse Pointe Farms | 2.2% | 18.2%(-16.1)#27 | 16.9%(-14.8)#1,025 |
| 28. | North Muskegon | 2.2% | 18.2%(-16.1)#28 | 16.9%(-14.8)#1,034 |
| 29. | Roscommon | 2.2% | 18.2%(-16.0)#29 | 16.9%(-14.7)#1,046 |
| 30. | Spring Arbor | 2.3% | 18.2%(-16.0)#30 | 16.9%(-14.7)#1,078 |
| 31. | Greilickville | 2.5% | 18.2%(-15.7)#31 | 16.9%(-14.4)#1,249 |
| 32. | Mcbain | 2.5% | 18.2%(-15.7)#32 | 16.9%(-14.4)#1,271 |
| 33. | Chelsea | 2.8% | 18.2%(-15.5)#33 | 16.9%(-14.2)#1,446 |
| 34. | Farmington | 2.8% | 18.2%(-15.5)#34 | 16.9%(-14.2)#1,452 |
| 35. | Northville | 2.8% | 18.2%(-15.5)#35 | 16.9%(-14.2)#1,465 |
| 36. | Wolverine Lake | 2.8% | 18.2%(-15.4)#36 | 16.9%(-14.1)#1,491 |
| 37. | Bath | 3.0% | 18.2%(-15.3)#37 | 16.9%(-13.9)#1,600 |
| 38. | Utica | 3.0% | 18.2%(-15.2)#38 | 16.9%(-13.9)#1,629 |
| 39. | Grosse Pointe Park | 3.1% | 18.2%(-15.2)#39 | 16.9%(-13.9)#1,644 |
| 40. | New Baltimore | 3.1% | 18.2%(-15.1)#40 | 16.9%(-13.8)#1,707 |
| 41. | West Ishpeming | 3.2% | 18.2%(-15.0)#41 | 16.9%(-13.7)#1,764 |
| 42. | Atlanta | 3.3% | 18.2%(-15.0)#42 | 16.9%(-13.7)#1,798 |
| 43. | Eastwood | 3.3% | 18.2%(-15.0)#43 | 16.9%(-13.6)#1,807 |
| 44. | Farmington Hills | 3.4% | 18.2%(-14.8)#44 | 16.9%(-13.5)#1,888 |
| 45. | Chassell | 3.4% | 18.2%(-14.8)#45 | 16.9%(-13.5)#1,915 |
| 46. | Royal Oak | 3.5% | 18.2%(-14.8)#46 | 16.9%(-13.5)#1,952 |
| 47. | Sterling | 3.5% | 18.2%(-14.8)#47 | 16.9%(-13.5)#1,955 |
| 48. | Flushing | 3.5% | 18.2%(-14.8)#48 | 16.9%(-13.5)#1,957 |
| 49. | Augusta | 3.6% | 18.2%(-14.6)#49 | 16.9%(-13.3)#2,017 |
| 50. | Beverly Hills | 3.6% | 18.2%(-14.6)#50 | 16.9%(-13.3)#2,050 |
| 51. | Chesaning | 3.7% | 18.2%(-14.5)#51 | 16.9%(-13.2)#2,115 |
| 52. | New Era | 3.8% | 18.2%(-14.5)#52 | 16.9%(-13.2)#2,134 |
| 53. | Ferndale | 3.9% | 18.2%(-14.3)#53 | 16.9%(-13.0)#2,222 |
| 54. | Fruitport | 4.0% | 18.2%(-14.3)#54 | 16.9%(-13.0)#2,249 |
| 55. | Sandusky | 4.1% | 18.2%(-14.2)#55 | 16.9%(-12.9)#2,323 |
| 56. | Hermansville | 4.1% | 18.2%(-14.2)#56 | 16.9%(-12.9)#2,339 |
| 57. | Boyne City | 4.1% | 18.2%(-14.1)#57 | 16.9%(-12.8)#2,359 |
| 58. | Milan | 4.1% | 18.2%(-14.1)#58 | 16.9%(-12.8)#2,388 |
| 59. | Grass Lake | 4.2% | 18.2%(-14.0)#59 | 16.9%(-12.7)#2,427 |
| 60. | Rochester Hills | 4.3% | 18.2%(-14.0)#60 | 16.9%(-12.7)#2,465 |
| 61. | Rapid City | 4.3% | 18.2%(-14.0)#61 | 16.9%(-12.7)#2,470 |
| 62. | Litchfield | 4.3% | 18.2%(-13.9)#62 | 16.9%(-12.6)#2,490 |
| 63. | Novi | 4.4% | 18.2%(-13.9)#63 | 16.9%(-12.5)#2,546 |
| 64. | Argentine | 4.4% | 18.2%(-13.8)#64 | 16.9%(-12.5)#2,584 |
| 65. | Lexington | 4.5% | 18.2%(-13.8)#65 | 16.9%(-12.5)#2,613 |
| 66. | Pewamo | 4.5% | 18.2%(-13.8)#66 | 16.9%(-12.5)#2,623 |
| 67. | Spring Lake | 4.5% | 18.2%(-13.8)#67 | 16.9%(-12.5)#2,629 |
| 68. | Livonia | 4.5% | 18.2%(-13.8)#68 | 16.9%(-12.5)#2,630 |
| 69. | Tecumseh | 4.5% | 18.2%(-13.7)#69 | 16.9%(-12.4)#2,652 |
| 70. | Grosse Pointe Woods | 4.5% | 18.2%(-13.7)#70 | 16.9%(-12.4)#2,661 |
| 71. | Wixom | 4.6% | 18.2%(-13.6)#71 | 16.9%(-12.3)#2,723 |
| 72. | Wolf Lake | 4.6% | 18.2%(-13.6)#72 | 16.9%(-12.3)#2,724 |
| 73. | Rochester | 4.6% | 18.2%(-13.6)#73 | 16.9%(-12.3)#2,728 |
| 74. | Robin Glen Indiantown | 4.8% | 18.2%(-13.5)#74 | 16.9%(-12.2)#2,803 |
| 75. | Whitmore Lake | 4.8% | 18.2%(-13.4)#75 | 16.9%(-12.1)#2,837 |
| 76. | Armada | 4.9% | 18.2%(-13.3)#76 | 16.9%(-12.0)#2,899 |
| 77. | Clarksville | 5.0% | 18.2%(-13.2)#77 | 16.9%(-11.9)#2,977 |
| 78. | Vicksburg | 5.1% | 18.2%(-13.1)#78 | 16.9%(-11.8)#3,057 |
| 79. | Westwood | 5.2% | 18.2%(-13.1)#79 | 16.9%(-11.8)#3,086 |
| 80. | Birmingham | 5.2% | 18.2%(-13.1)#80 | 16.9%(-11.8)#3,091 |
| 81. | Watervliet | 5.2% | 18.2%(-13.1)#81 | 16.9%(-11.8)#3,093 |
| 82. | Burr Oak | 5.2% | 18.2%(-13.0)#82 | 16.9%(-11.7)#3,138 |
| 83. | Troy | 5.3% | 18.2%(-13.0)#83 | 16.9%(-11.7)#3,169 |
| 84. | Trenton | 5.4% | 18.2%(-12.8)#84 | 16.9%(-11.5)#3,242 |
| 85. | Eastlake | 5.6% | 18.2%(-12.7)#85 | 16.9%(-11.4)#3,356 |
| 86. | Iron Mountain | 5.6% | 18.2%(-12.6)#86 | 16.9%(-11.3)#3,412 |
| 87. | Ellsworth | 5.7% | 18.2%(-12.6)#87 | 16.9%(-11.3)#3,441 |
| 88. | Custer | 5.7% | 18.2%(-12.5)#88 | 16.9%(-11.2)#3,473 |
| 89. | Stronach | 5.7% | 18.2%(-12.5)#89 | 16.9%(-11.2)#3,474 |
| 90. | Comstock Northwest | 5.8% | 18.2%(-12.5)#90 | 16.9%(-11.2)#3,524 |
| 91. | Ironwood | 5.8% | 18.2%(-12.4)#91 | 16.9%(-11.1)#3,555 |
| 92. | Saline | 5.9% | 18.2%(-12.3)#92 | 16.9%(-11.0)#3,620 |
| 93. | Eaton Rapids | 5.9% | 18.2%(-12.3)#93 | 16.9%(-11.0)#3,643 |
| 94. | Ravenna | 6.0% | 18.2%(-12.3)#94 | 16.9%(-11.0)#3,677 |
| 95. | Kinde | 6.0% | 18.2%(-12.3)#95 | 16.9%(-11.0)#3,680 |
| 96. | Lake Isabella | 6.0% | 18.2%(-12.2)#96 | 16.9%(-10.9)#3,704 |
| 97. | Bangor | 6.1% | 18.2%(-12.2)#97 | 16.9%(-10.9)#3,755 |
| 98. | East Jordan | 6.2% | 18.2%(-12.1)#98 | 16.9%(-10.8)#3,826 |
| 99. | Alba | 6.3% | 18.2%(-12.0)#99 | 16.9%(-10.6)#3,899 |
| 100. | Durand | 6.4% | 18.2%(-11.9)#100 | 16.9%(-10.6)#3,949 |
Common Questions
What are the Top 10 Cities with the Lowest Poverty Level Among Children Under the Age of 16 in Michigan?
Top 10 Cities with the Lowest Poverty Level Among Children Under the Age of 16 in Michigan are:
#1
0.29%
#2
0.51%
#3
0.69%
#4
0.86%
#5
0.91%
#6
0.92%
#7
0.96%
#8
1.1%
#9
1.1%
#10
1.1%
What city has the Lowest Poverty Level Among Children Under the Age of 16 in Michigan?
Grosse Pointe has the Lowest Poverty Level Among Children Under the Age of 16 in Michigan with 0.29%.
What is the Poverty Level Among Children Under the Age of 16 in the State of Michigan?
Poverty Level Among Children Under the Age of 16 in Michigan is 18.2%.
What is the Poverty Level Among Children Under the Age of 16 in the United States?
Poverty Level Among Children Under the Age of 16 in the United States is 16.9%.