Cities with the Lowest Poverty Level Among Children Under the Age of 16 in New Hampshire

RELATED REPORTS & OPTIONS

Lowest Poverty | Child 0-16
Population
Families and Households
Female Fertility
Female Fertility (Unmarried)
Race (Community Size)
Race (Percentage)
Ancestry (Community Size)
AfghanAfricanAlaska NativeAlaskan AthabascanAlbanianAleutAlsatianAmericanApacheArabArapahoArgentineanArmenianAssyrian / Chaldean / SyriacAustralianAustrianBahamianBangladeshiBarbadianBasqueBelgianBelizeanBermudanBhutaneseBlackfeetBolivianBrazilianBritishBritish West IndianBulgarianBurmeseCajunCambodianCanadianCape VerdeanCarpatho RusynCelticCentral AmericanCentral American IndianCherokeeCheyenneChickasawChileanChineseChippewaChoctawColombianColvilleComancheCosta RicanCreeCreekCroatianCrowCubanCypriotCzechCzechoslovakianDanishDelawareDominicanDutchDutch West IndianEastern EuropeanEcuadorianEgyptianEnglishEstonianEthiopianEuropeanFijianFilipinoFinnishFrenchFrench American IndianFrench CanadianGermanGerman RussianGhanaianGreekGuamanian / ChamorroGuatemalanGuyaneseHaitianHmongHonduranHopiHoumaHungarianIcelanderIndian (Asian)IndonesianInupiatIranianIraqiIrishIroquoisIsraeliItalianJamaicanJapaneseJordanianKenyanKiowaKoreanLaotianLatvianLebaneseLiberianLithuanianLumbeeLuxembourgerMacedonianMalaysianMalteseMarshalleseMenomineeMexicanMexican American IndianMongolianMoroccanNative HawaiianNavajoNepaleseNew ZealanderNicaraguanNigerianNorthern EuropeanNorwegianOkinawanOsageOttawaPaiutePakistaniPalestinianPanamanianParaguayanPennsylvania GermanPeruvianPimaPolishPortuguesePotawatomiPuebloPuerto RicanPuget Sound SalishRomanianRussianSalvadoranSamoanScandinavianScotch-IrishScottishSeminoleSenegaleseSerbianShoshoneSierra LeoneanSiouxSlavicSlovakSloveneSomaliSouth AfricanSouth AmericanSouth American IndianSoviet UnionSpaniardSpanishSpanish AmericanSpanish American IndianSri LankanSubsaharan AfricanSudaneseSwedishSwissSyrianTaiwaneseThaiTlingit-HaidaTohono O'OdhamTonganTrinidadian and TobagonianTsimshianTurkishU.S. Virgin IslanderUgandanUkrainianUruguayanUteVenezuelanVietnameseWelshWest IndianYakamaYaquiYugoslavianYumanYup'ikZimbabwean
Ancestry (Percentage)
AfghanAfricanAlaska NativeAlaskan AthabascanAlbanianAleutAlsatianAmericanApacheArabArapahoArgentineanArmenianAssyrian / Chaldean / SyriacAustralianAustrianBahamianBangladeshiBarbadianBasqueBelgianBelizeanBermudanBhutaneseBlackfeetBolivianBrazilianBritishBritish West IndianBulgarianBurmeseCajunCambodianCanadianCape VerdeanCarpatho RusynCelticCentral AmericanCentral American IndianCherokeeCheyenneChickasawChileanChineseChippewaChoctawColombianColvilleComancheCosta RicanCreeCreekCroatianCrowCubanCypriotCzechCzechoslovakianDanishDelawareDominicanDutchDutch West IndianEastern EuropeanEcuadorianEgyptianEnglishEstonianEthiopianEuropeanFijianFilipinoFinnishFrenchFrench American IndianFrench CanadianGermanGerman RussianGhanaianGreekGuamanian / ChamorroGuatemalanGuyaneseHaitianHmongHonduranHopiHoumaHungarianIcelanderIndian (Asian)IndonesianInupiatIranianIraqiIrishIroquoisIsraeliItalianJamaicanJapaneseJordanianKenyanKiowaKoreanLaotianLatvianLebaneseLiberianLithuanianLumbeeLuxembourgerMacedonianMalaysianMalteseMarshalleseMenomineeMexicanMexican American IndianMongolianMoroccanNative HawaiianNavajoNepaleseNew ZealanderNicaraguanNigerianNorthern EuropeanNorwegianOkinawanOsageOttawaPaiutePakistaniPalestinianPanamanianParaguayanPennsylvania GermanPeruvianPimaPolishPortuguesePotawatomiPuebloPuerto RicanPuget Sound SalishRomanianRussianSalvadoranSamoanScandinavianScotch-IrishScottishSeminoleSenegaleseSerbianShoshoneSierra LeoneanSiouxSlavicSlovakSloveneSomaliSouth AfricanSouth AmericanSouth American IndianSoviet UnionSpaniardSpanishSpanish AmericanSpanish American IndianSri LankanSubsaharan AfricanSudaneseSwedishSwissSyrianTaiwaneseThaiTlingit-HaidaTohono O'OdhamTonganTrinidadian and TobagonianTsimshianTurkishU.S. Virgin IslanderUgandanUkrainianUruguayanUteVenezuelanVietnameseWelshWest IndianYakamaYaquiYugoslavianYumanYup'ikZimbabwean
Immigrant Origin (Total)
AfghanistanAfricaAlbaniaArgentinaArmeniaAsiaAustraliaAustriaAzoresBahamasBangladeshBarbadosBelarusBelgiumBelizeBoliviaBosnia and HerzegovinaBrazilBulgariaBurma / MyanmarCabo VerdeCambodiaCameroonCanadaCaribbeanCentral AmericaChileChinaColombiaCongoCosta RicaCroatiaCubaCzechoslovakiaDenmarkDominicaDominican RepublicEastern AfricaEastern AsiaEastern EuropeEcuadorEgyptEl SalvadorEnglandEritreaEthiopiaEuropeFijiFranceGermanyGhanaGreeceGrenadaGuatemalaGuyanaHaitiHondurasHong KongHungaryIndiaIndonesiaIranIraqIrelandIsraelItalyJamaicaJapanJordanKazakhstanKenyaKoreaKuwaitLaosLatin AmericaLatviaLebanonLiberiaLithuaniaMalaysiaMexicoMicronesiaMiddle AfricaMoldovaMoroccoNepalNetherlandsNicaraguaNigeriaNorth MacedoniaNorthern AfricaNorthern EuropeNorwayOceaniaPakistanPanamaPeruPhilippinesPolandPortugalRomaniaRussiaSaudi ArabiaScotlandSenegalSerbiaSierra LeoneSingaporeSomaliaSouth AfricaSouth AmericaSouth Central AsiaSouth Eastern AsiaSouthern EuropeSpainSri LankaSt. Vincent and the GrenadinesSudanSwedenSwitzerlandSyriaTaiwanThailandTrinidad and TobagoTurkeyUgandaUkraineUruguayUzbekistanVenezuelaVietnamWest IndiesWestern AfricaWestern AsiaWestern EuropeYemenZaireZimbabwe
Immigrant Origin (Percentage)
AfghanistanAfricaAlbaniaArgentinaArmeniaAsiaAustraliaAustriaAzoresBahamasBangladeshBarbadosBelarusBelgiumBelizeBoliviaBosnia and HerzegovinaBrazilBulgariaBurma / MyanmarCabo VerdeCambodiaCameroonCanadaCaribbeanCentral AmericaChileChinaColombiaCongoCosta RicaCroatiaCubaCzechoslovakiaDenmarkDominicaDominican RepublicEastern AfricaEastern AsiaEastern EuropeEcuadorEgyptEl SalvadorEnglandEritreaEthiopiaEuropeFijiFranceGermanyGhanaGreeceGrenadaGuatemalaGuyanaHaitiHondurasHong KongHungaryIndiaIndonesiaIranIraqIrelandIsraelItalyJamaicaJapanJordanKazakhstanKenyaKoreaKuwaitLaosLatin AmericaLatviaLebanonLiberiaLithuaniaMalaysiaMexicoMicronesiaMiddle AfricaMoldovaMoroccoNepalNetherlandsNicaraguaNigeriaNorth MacedoniaNorthern AfricaNorthern EuropeNorwayOceaniaPakistanPanamaPeruPhilippinesPolandPortugalRomaniaRussiaSaudi ArabiaScotlandSenegalSerbiaSierra LeoneSingaporeSomaliaSouth AfricaSouth AmericaSouth Central AsiaSouth Eastern AsiaSouthern EuropeSpainSri LankaSt. Vincent and the GrenadinesSudanSwedenSwitzerlandSyriaTaiwanThailandTrinidad and TobagoTurkeyUgandaUkraineUruguayUzbekistanVenezuelaVietnamWest IndiesWestern AfricaWestern AsiaWestern EuropeYemenZaireZimbabwe
Income
Income (Families)
Income (Households)
Poverty
Poverty (Families)
Unemployment
Employment Occupations
Employment Industries
Employer Class
Commute Time
Commute Means
School Enrollment
Education by Degree Field
Occupancy
Finances
Physical Characteristics
New Hampshire
Compare Cities
Comparison Subject

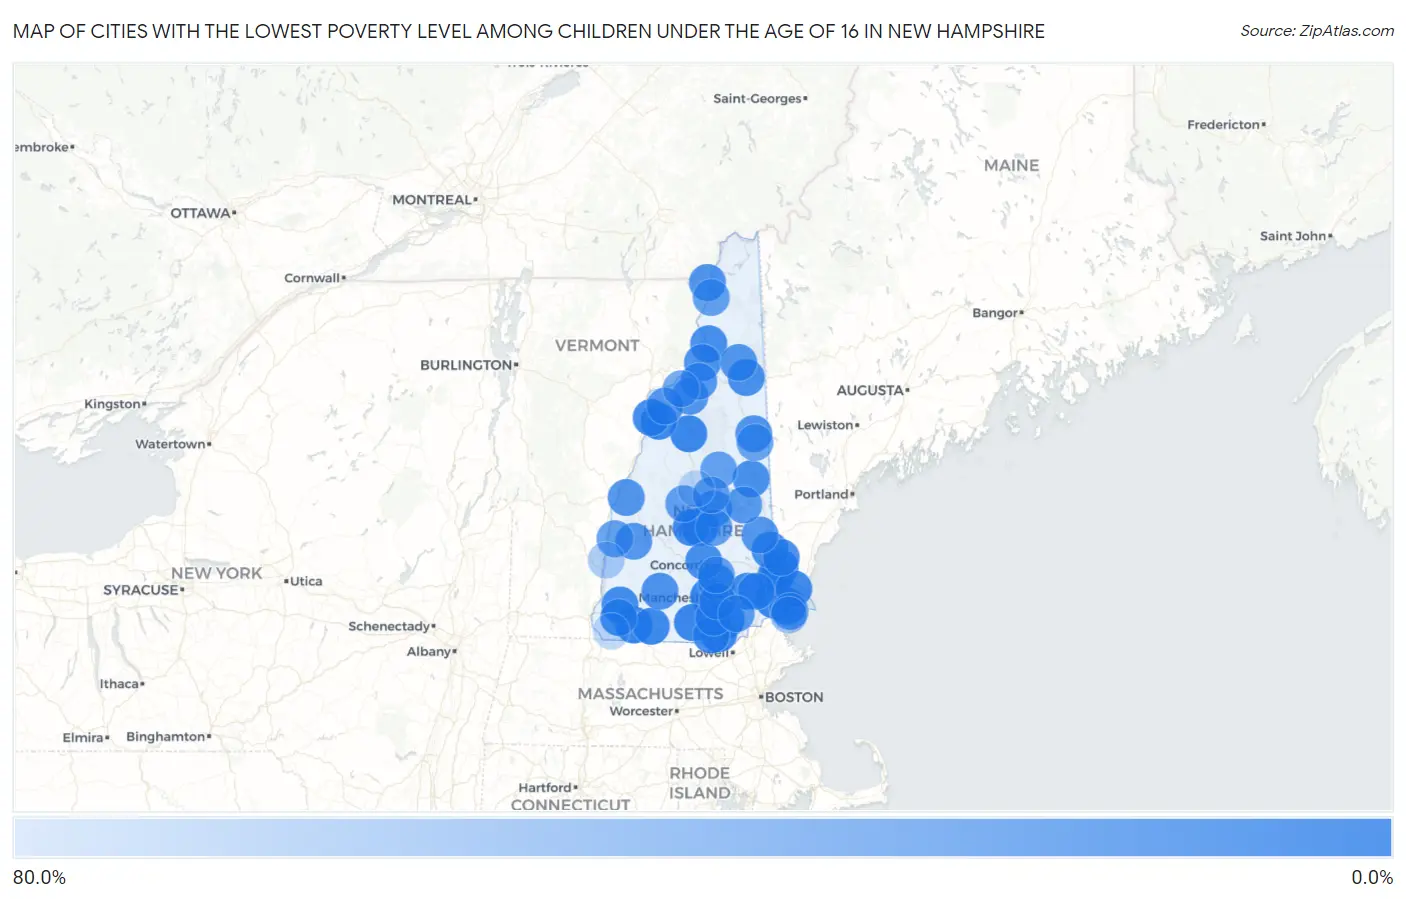
Map of Cities with the Lowest Poverty Level Among Children Under the Age of 16 in New Hampshire

80.0%
0.0%
Cities with the Lowest Poverty Level Among Children Under the Age of 16 in New Hampshire Map

Cities with the Lowest Poverty Level Among Children Under the Age of 16 in New Hampshire

City Child Poverty vs State vs National
1.Pinardville3.0%8.7%(-5.66)#116.9%(-13.9)#1,596
2.Londonderry3.4%8.7%(-5.28)#216.9%(-13.6)#1,869
3.Troy3.8%8.7%(-4.81)#316.9%(-13.1)#2,172
4.Tilton Northfield4.0%8.7%(-4.64)#416.9%(-12.9)#2,296
5.Dover4.1%8.7%(-4.55)#516.9%(-12.8)#2,356
6.North Woodstock4.1%8.7%(-4.54)#616.9%(-12.8)#2,361
7.Exeter4.1%8.7%(-4.52)#716.9%(-12.8)#2,375
8.Milford4.4%8.7%(-4.23)#816.9%(-12.5)#2,572
9.Durham4.5%8.7%(-4.18)#916.9%(-12.5)#2,621
10.Hampton5.5%8.7%(-3.20)#1016.9%(-11.5)#3,274
11.Hudson5.5%8.7%(-3.20)#1116.9%(-11.5)#3,276
12.Mountain Lakes5.9%8.7%(-2.77)#1216.9%(-11.1)#3,593
13.Jaffrey6.8%8.7%(-1.88)#1316.9%(-10.2)#4,202
14.Franklin7.0%8.7%(-1.69)#1416.9%(-9.97)#4,345
15.Portsmouth7.8%8.7%(-0.816)#1516.9%(-9.10)#4,934
16.Hooksett8.1%8.7%(-0.582)#1616.9%(-8.87)#5,071
17.Keene8.6%8.7%(-0.043)#1716.9%(-8.33)#5,433
18.Raymond8.7%8.7%(+0.014)#1816.9%(-8.27)#5,470
19.Woodsville8.9%8.7%(+0.222)#1916.9%(-8.06)#5,623
20.Nashua9.2%8.7%(+0.498)#2016.9%(-7.79)#5,833
21.Rochester9.3%8.7%(+0.606)#2116.9%(-7.68)#5,897
22.West Swanzey9.6%8.7%(+0.992)#2216.9%(-7.29)#6,131
23.Groveton10.6%8.7%(+1.91)#2316.9%(-6.38)#6,688
24.East Merrimack10.7%8.7%(+2.04)#2416.9%(-6.25)#6,773
25.Concord11.1%8.7%(+2.45)#2516.9%(-5.84)#7,022
26.Somersworth11.5%8.7%(+2.80)#2616.9%(-5.48)#7,258
27.Gorham11.8%8.7%(+3.11)#2716.9%(-5.17)#7,436
28.Lancaster12.6%8.7%(+3.90)#2816.9%(-4.38)#7,927
29.Center Ossipee13.3%8.7%(+4.61)#2916.9%(-3.67)#8,301
30.West Stewartstown13.8%8.7%(+5.14)#3016.9%(-3.15)#8,581
31.Antrim13.8%8.7%(+5.15)#3116.9%(-3.13)#8,598
32.Epping15.1%8.7%(+6.43)#3216.9%(-1.86)#9,264
33.Laconia16.5%8.7%(+7.89)#3316.9%(-0.397)#10,047
34.North Conway16.8%8.7%(+8.16)#3416.9%(-0.121)#10,198
35.Lebanon17.0%8.7%(+8.31)#3516.9%(+0.025)#10,256
36.Bethlehem17.2%8.7%(+8.56)#3616.9%(+0.279)#10,385
37.Berlin17.4%8.7%(+8.78)#3716.9%(+0.496)#10,503
38.Farmington17.8%8.7%(+9.13)#3816.9%(+0.849)#10,649
39.Newport18.0%8.7%(+9.34)#3916.9%(+1.06)#10,750
40.Lisbon18.1%8.7%(+9.42)#4016.9%(+1.13)#10,787
41.Manchester19.1%8.7%(+10.4)#4116.9%(+2.14)#11,295
42.Whitefield19.6%8.7%(+11.0)#4216.9%(+2.70)#11,545
43.Wolfeboro20.3%8.7%(+11.6)#4316.9%(+3.32)#11,824
44.Derry20.8%8.7%(+12.1)#4416.9%(+3.85)#12,071
45.Hampton Beach23.1%8.7%(+14.4)#4516.9%(+6.14)#13,014
46.Bristol24.0%8.7%(+15.3)#4616.9%(+7.04)#13,357
47.Colebrook25.0%8.7%(+16.3)#4716.9%(+8.06)#13,699
48.Center Sandwich25.0%8.7%(+16.3)#4816.9%(+8.06)#13,735
49.Claremont25.1%8.7%(+16.5)#4916.9%(+8.17)#13,778
50.Belmont25.1%8.7%(+16.5)#5016.9%(+8.21)#13,788
51.Suncook25.3%8.7%(+16.6)#5116.9%(+8.35)#13,831
52.Meredith27.6%8.7%(+18.9)#5216.9%(+10.6)#14,670
53.Conway29.8%8.7%(+21.1)#5316.9%(+12.8)#15,337
54.Littleton32.0%8.7%(+23.3)#5416.9%(+15.1)#15,980
55.Seabrook Beach50.0%8.7%(+41.3)#5516.9%(+33.1)#19,272
56.Charlestown58.2%8.7%(+49.5)#5616.9%(+41.2)#20,080
57.Ashland69.3%8.7%(+60.7)#5716.9%(+52.4)#20,809
58.Winchester69.4%8.7%(+60.8)#5816.9%(+52.5)#20,817

Common Questions

What are the Top 10 Cities with the Lowest Poverty Level Among Children Under the Age of 16 in New Hampshire?
Top 10 Cities with the Lowest Poverty Level Among Children Under the Age of 16 in New Hampshire are:
What city has the Lowest Poverty Level Among Children Under the Age of 16 in New Hampshire?
Pinardville has the Lowest Poverty Level Among Children Under the Age of 16 in New Hampshire with 3.0%.
What is the Poverty Level Among Children Under the Age of 16 in the State of New Hampshire?
Poverty Level Among Children Under the Age of 16 in New Hampshire is 8.7%.
What is the Poverty Level Among Children Under the Age of 16 in the United States?
Poverty Level Among Children Under the Age of 16 in the United States is 16.9%.