Cities with the Lowest Poverty Level Among Children Under the Age of 16 in Minnesota
RELATED REPORTS & OPTIONS
Lowest Poverty | Child 0-16
Minnesota
Compare Cities
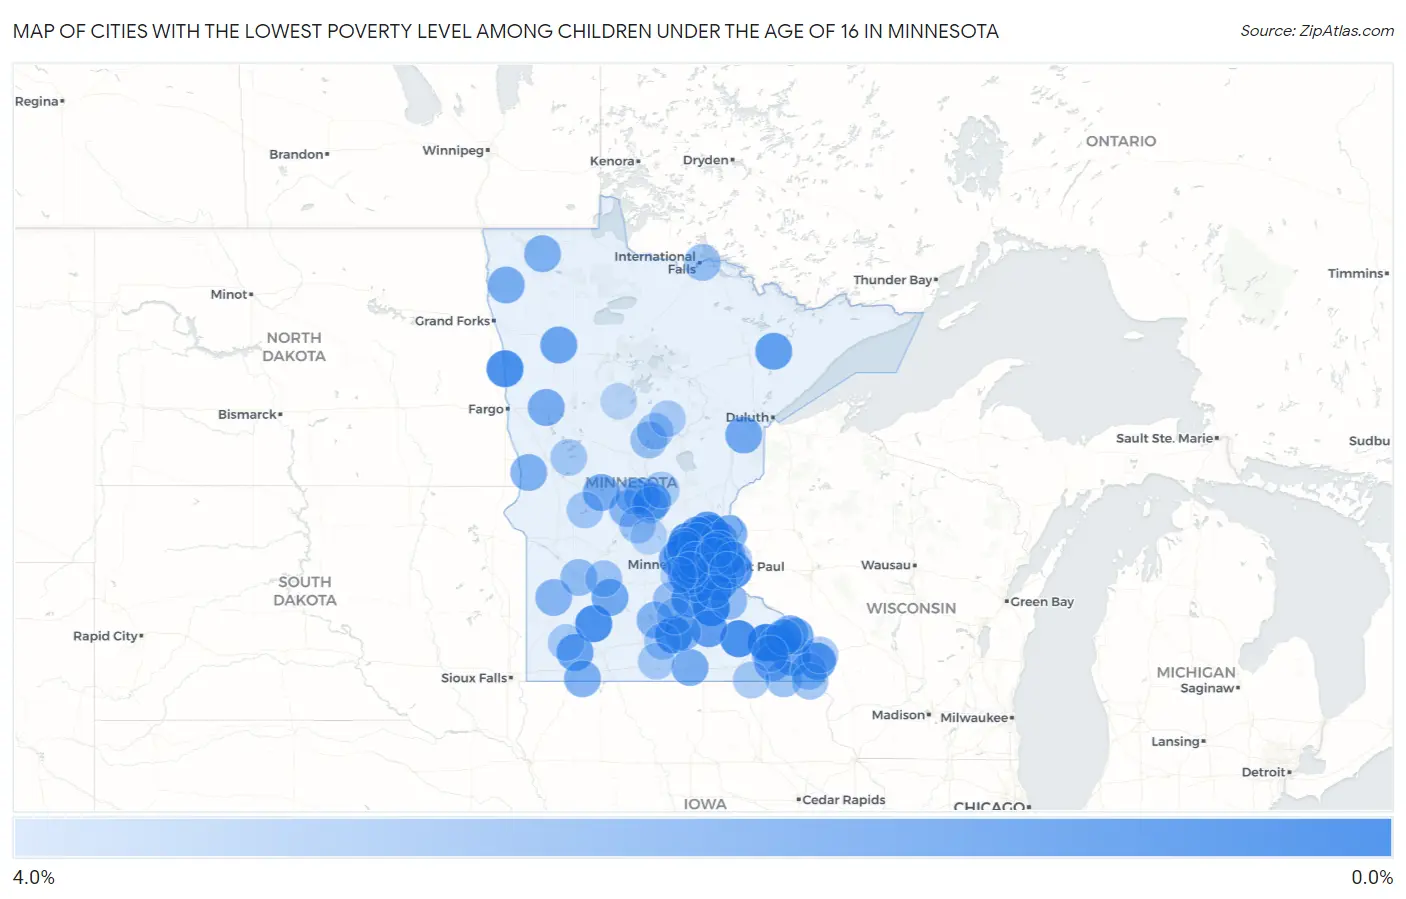
Map of Cities with the Lowest Poverty Level Among Children Under the Age of 16 in Minnesota
4.0%
0.0%
Cities with the Lowest Poverty Level Among Children Under the Age of 16 in Minnesota
| City | Child Poverty | vs State | vs National | |
| 1. | Eyota | 0.36% | 11.1%(-10.7)#1 | 16.9%(-16.6)#36 |
| 2. | Dundas | 0.49% | 11.1%(-10.6)#2 | 16.9%(-16.5)#59 |
| 3. | East Bethel | 0.60% | 11.1%(-10.5)#3 | 16.9%(-16.3)#94 |
| 4. | Greenfield | 0.63% | 11.1%(-10.4)#4 | 16.9%(-16.3)#112 |
| 5. | Otsego | 0.70% | 11.1%(-10.4)#5 | 16.9%(-16.2)#132 |
| 6. | Halstad | 0.82% | 11.1%(-10.2)#6 | 16.9%(-16.1)#183 |
| 7. | Long Lake | 0.82% | 11.1%(-10.2)#7 | 16.9%(-16.1)#185 |
| 8. | Sunfish Lake | 0.83% | 11.1%(-10.2)#8 | 16.9%(-16.1)#188 |
| 9. | Kasson | 0.86% | 11.1%(-10.2)#9 | 16.9%(-16.1)#210 |
| 10. | Credit River | 0.86% | 11.1%(-10.2)#10 | 16.9%(-16.1)#216 |
| 11. | Lamberton | 0.88% | 11.1%(-10.2)#11 | 16.9%(-16.1)#229 |
| 12. | St Clair | 0.96% | 11.1%(-10.1)#12 | 16.9%(-16.0)#258 |
| 13. | Afton | 0.98% | 11.1%(-10.1)#13 | 16.9%(-16.0)#271 |
| 14. | Rogers | 0.98% | 11.1%(-10.1)#14 | 16.9%(-16.0)#272 |
| 15. | North Oaks | 1.00% | 11.1%(-10.1)#15 | 16.9%(-15.9)#280 |
| 16. | New Prague | 1.0% | 11.1%(-10.0)#16 | 16.9%(-15.9)#300 |
| 17. | Rosemount | 1.1% | 11.1%(-10.0)#17 | 16.9%(-15.9)#308 |
| 18. | Victoria | 1.1% | 11.1%(-9.94)#18 | 16.9%(-15.8)#352 |
| 19. | Oak Grove | 1.2% | 11.1%(-9.84)#19 | 16.9%(-15.7)#404 |
| 20. | Dayton | 1.2% | 11.1%(-9.83)#20 | 16.9%(-15.7)#411 |
| 21. | Medford | 1.5% | 11.1%(-9.61)#21 | 16.9%(-15.5)#533 |
| 22. | Prior Lake | 1.5% | 11.1%(-9.60)#22 | 16.9%(-15.5)#541 |
| 23. | Bethel | 1.5% | 11.1%(-9.60)#23 | 16.9%(-15.5)#542 |
| 24. | Hokah | 1.5% | 11.1%(-9.59)#24 | 16.9%(-15.5)#547 |
| 25. | Deephaven | 1.5% | 11.1%(-9.55)#25 | 16.9%(-15.4)#572 |
| 26. | Rushford Village | 1.5% | 11.1%(-9.53)#26 | 16.9%(-15.4)#585 |
| 27. | Hoyt Lakes | 1.6% | 11.1%(-9.50)#27 | 16.9%(-15.4)#602 |
| 28. | Chanhassen | 1.6% | 11.1%(-9.46)#28 | 16.9%(-15.3)#629 |
| 29. | St Charles | 1.6% | 11.1%(-9.44)#29 | 16.9%(-15.3)#649 |
| 30. | Rice | 1.7% | 11.1%(-9.37)#30 | 16.9%(-15.2)#690 |
| 31. | Fulda | 1.7% | 11.1%(-9.37)#31 | 16.9%(-15.2)#697 |
| 32. | Delano | 1.8% | 11.1%(-9.28)#32 | 16.9%(-15.2)#751 |
| 33. | Mcintosh | 1.8% | 11.1%(-9.27)#33 | 16.9%(-15.1)#760 |
| 34. | Mahtomedi | 1.8% | 11.1%(-9.26)#34 | 16.9%(-15.1)#769 |
| 35. | Goodview | 1.8% | 11.1%(-9.24)#35 | 16.9%(-15.1)#783 |
| 36. | Nowthen | 1.9% | 11.1%(-9.17)#36 | 16.9%(-15.0)#834 |
| 37. | Columbus | 1.9% | 11.1%(-9.16)#37 | 16.9%(-15.0)#838 |
| 38. | Mahtowa | 2.0% | 11.1%(-9.11)#38 | 16.9%(-15.0)#881 |
| 39. | Morton | 2.0% | 11.1%(-9.07)#39 | 16.9%(-14.9)#913 |
| 40. | Medina | 2.0% | 11.1%(-9.06)#40 | 16.9%(-14.9)#916 |
| 41. | Lake Park | 2.1% | 11.1%(-8.95)#41 | 16.9%(-14.8)#989 |
| 42. | Osakis | 2.1% | 11.1%(-8.92)#42 | 16.9%(-14.8)#1,011 |
| 43. | Fountain | 2.2% | 11.1%(-8.92)#43 | 16.9%(-14.8)#1,014 |
| 44. | Rollingstone | 2.2% | 11.1%(-8.91)#44 | 16.9%(-14.8)#1,020 |
| 45. | Argyle | 2.2% | 11.1%(-8.88)#45 | 16.9%(-14.7)#1,041 |
| 46. | Alden | 2.2% | 11.1%(-8.85)#46 | 16.9%(-14.7)#1,054 |
| 47. | Medicine Lake | 2.2% | 11.1%(-8.85)#47 | 16.9%(-14.7)#1,058 |
| 48. | Chisago City | 2.3% | 11.1%(-8.82)#48 | 16.9%(-14.7)#1,076 |
| 49. | Altura | 2.3% | 11.1%(-8.79)#49 | 16.9%(-14.7)#1,086 |
| 50. | Round Lake | 2.3% | 11.1%(-8.79)#50 | 16.9%(-14.7)#1,087 |
| 51. | Ramsey | 2.3% | 11.1%(-8.78)#51 | 16.9%(-14.7)#1,093 |
| 52. | Greenbush | 2.4% | 11.1%(-8.69)#52 | 16.9%(-14.6)#1,146 |
| 53. | Campbell | 2.4% | 11.1%(-8.69)#53 | 16.9%(-14.6)#1,152 |
| 54. | Nicollet | 2.5% | 11.1%(-8.52)#54 | 16.9%(-14.4)#1,275 |
| 55. | Janesville | 2.6% | 11.1%(-8.50)#55 | 16.9%(-14.4)#1,283 |
| 56. | Minnetonka | 2.6% | 11.1%(-8.49)#56 | 16.9%(-14.4)#1,302 |
| 57. | Minneota | 2.6% | 11.1%(-8.48)#57 | 16.9%(-14.4)#1,312 |
| 58. | Hanover | 2.6% | 11.1%(-8.47)#58 | 16.9%(-14.3)#1,321 |
| 59. | Freeport | 2.6% | 11.1%(-8.44)#59 | 16.9%(-14.3)#1,351 |
| 60. | Chaska | 2.7% | 11.1%(-8.38)#60 | 16.9%(-14.2)#1,391 |
| 61. | Wayzata | 2.7% | 11.1%(-8.36)#61 | 16.9%(-14.2)#1,398 |
| 62. | Bowlus | 2.7% | 11.1%(-8.36)#62 | 16.9%(-14.2)#1,406 |
| 63. | Grant | 2.7% | 11.1%(-8.35)#63 | 16.9%(-14.2)#1,412 |
| 64. | Canton | 2.9% | 11.1%(-8.19)#64 | 16.9%(-14.1)#1,527 |
| 65. | Cannon Falls | 2.9% | 11.1%(-8.19)#65 | 16.9%(-14.1)#1,528 |
| 66. | Chatfield | 2.9% | 11.1%(-8.17)#66 | 16.9%(-14.0)#1,541 |
| 67. | Granite Falls | 2.9% | 11.1%(-8.17)#67 | 16.9%(-14.0)#1,549 |
| 68. | Caledonia | 3.0% | 11.1%(-8.07)#68 | 16.9%(-13.9)#1,597 |
| 69. | Henderson | 3.0% | 11.1%(-8.07)#69 | 16.9%(-13.9)#1,599 |
| 70. | Ranier | 3.0% | 11.1%(-8.07)#70 | 16.9%(-13.9)#1,604 |
| 71. | St Michael | 3.0% | 11.1%(-8.06)#71 | 16.9%(-13.9)#1,611 |
| 72. | Circle Pines | 3.0% | 11.1%(-8.03)#72 | 16.9%(-13.9)#1,634 |
| 73. | Plymouth | 3.1% | 11.1%(-7.98)#73 | 16.9%(-13.8)#1,666 |
| 74. | Upsala | 3.1% | 11.1%(-7.97)#74 | 16.9%(-13.8)#1,670 |
| 75. | Nisswa | 3.1% | 11.1%(-7.97)#75 | 16.9%(-13.8)#1,672 |
| 76. | Eitzen | 3.1% | 11.1%(-7.94)#76 | 16.9%(-13.8)#1,700 |
| 77. | Danube | 3.2% | 11.1%(-7.91)#77 | 16.9%(-13.8)#1,725 |
| 78. | St Stephen | 3.2% | 11.1%(-7.89)#78 | 16.9%(-13.8)#1,728 |
| 79. | Breezy Point | 3.2% | 11.1%(-7.87)#79 | 16.9%(-13.7)#1,747 |
| 80. | Good Thunder | 3.2% | 11.1%(-7.84)#80 | 16.9%(-13.7)#1,771 |
| 81. | Richmond | 3.3% | 11.1%(-7.79)#81 | 16.9%(-13.7)#1,791 |
| 82. | Mendota Heights | 3.3% | 11.1%(-7.75)#82 | 16.9%(-13.6)#1,829 |
| 83. | Long Beach | 3.3% | 11.1%(-7.73)#83 | 16.9%(-13.6)#1,837 |
| 84. | Le Roy | 3.4% | 11.1%(-7.72)#84 | 16.9%(-13.6)#1,852 |
| 85. | La Crescent | 3.4% | 11.1%(-7.70)#85 | 16.9%(-13.6)#1,866 |
| 86. | Farmington | 3.4% | 11.1%(-7.69)#86 | 16.9%(-13.6)#1,871 |
| 87. | Battle Lake | 3.4% | 11.1%(-7.68)#87 | 16.9%(-13.5)#1,875 |
| 88. | Arden Hills | 3.4% | 11.1%(-7.66)#88 | 16.9%(-13.5)#1,889 |
| 89. | Winnebago | 3.4% | 11.1%(-7.64)#89 | 16.9%(-13.5)#1,900 |
| 90. | Slayton | 3.5% | 11.1%(-7.61)#90 | 16.9%(-13.5)#1,928 |
| 91. | Buckman | 3.5% | 11.1%(-7.58)#91 | 16.9%(-13.5)#1,956 |
| 92. | Oak Park Heights | 3.5% | 11.1%(-7.56)#92 | 16.9%(-13.4)#1,967 |
| 93. | Shorewood | 3.5% | 11.1%(-7.53)#93 | 16.9%(-13.4)#1,985 |
| 94. | Emily | 3.6% | 11.1%(-7.50)#94 | 16.9%(-13.4)#1,996 |
| 95. | Lino Lakes | 3.6% | 11.1%(-7.47)#95 | 16.9%(-13.3)#2,010 |
| 96. | Cleveland | 3.7% | 11.1%(-7.38)#96 | 16.9%(-13.3)#2,075 |
| 97. | Woodbury | 3.7% | 11.1%(-7.35)#97 | 16.9%(-13.2)#2,098 |
| 98. | Waconia | 3.7% | 11.1%(-7.35)#98 | 16.9%(-13.2)#2,099 |
| 99. | Kimball | 3.8% | 11.1%(-7.28)#99 | 16.9%(-13.2)#2,140 |
| 100. | Nevis | 3.9% | 11.1%(-7.16)#100 | 16.9%(-13.0)#2,213 |
Common Questions
What are the Top 10 Cities with the Lowest Poverty Level Among Children Under the Age of 16 in Minnesota?
Top 10 Cities with the Lowest Poverty Level Among Children Under the Age of 16 in Minnesota are:
#1
0.36%
#2
0.49%
#3
0.60%
#4
0.63%
#5
0.70%
#6
0.82%
#7
0.82%
#8
0.83%
#9
0.86%
#10
0.88%
What city has the Lowest Poverty Level Among Children Under the Age of 16 in Minnesota?
Eyota has the Lowest Poverty Level Among Children Under the Age of 16 in Minnesota with 0.36%.
What is the Poverty Level Among Children Under the Age of 16 in the State of Minnesota?
Poverty Level Among Children Under the Age of 16 in Minnesota is 11.1%.
What is the Poverty Level Among Children Under the Age of 16 in the United States?
Poverty Level Among Children Under the Age of 16 in the United States is 16.9%.