Cities with the Lowest Poverty Level Among Children Under the Age of 16 in Maine
RELATED REPORTS & OPTIONS
Lowest Poverty | Child 0-16
Maine
Compare Cities
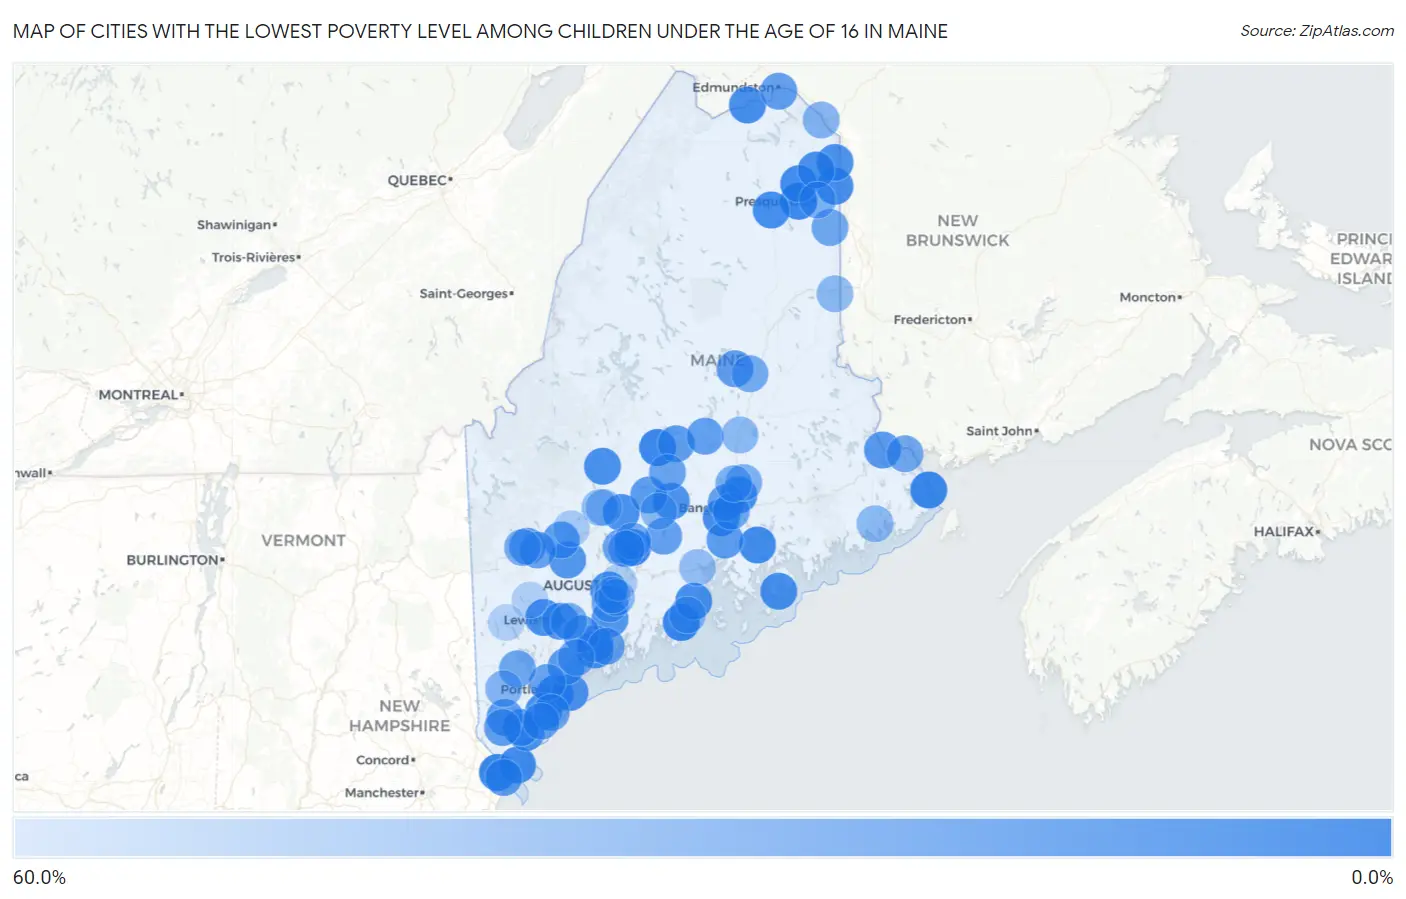
Map of Cities with the Lowest Poverty Level Among Children Under the Age of 16 in Maine
60.0%
0.0%
Cities with the Lowest Poverty Level Among Children Under the Age of 16 in Maine
| City | Child Poverty | vs State | vs National | |
| 1. | Thomaston | 1.1% | 13.4%(-12.3)#1 | 16.9%(-15.9)#324 |
| 2. | South Eliot | 1.6% | 13.4%(-11.8)#2 | 16.9%(-15.3)#647 |
| 3. | South Portland | 2.5% | 13.4%(-10.9)#3 | 16.9%(-14.4)#1,246 |
| 4. | Oak Hill | 2.6% | 13.4%(-10.9)#4 | 16.9%(-14.4)#1,292 |
| 5. | Guilford | 2.6% | 13.4%(-10.8)#5 | 16.9%(-14.3)#1,353 |
| 6. | Mapleton | 2.9% | 13.4%(-10.5)#6 | 16.9%(-14.1)#1,530 |
| 7. | Eastport | 3.2% | 13.4%(-10.2)#7 | 16.9%(-13.7)#1,768 |
| 8. | Winslow | 3.3% | 13.4%(-10.1)#8 | 16.9%(-13.6)#1,830 |
| 9. | Lisbon | 5.2% | 13.4%(-8.23)#9 | 16.9%(-11.7)#3,114 |
| 10. | Washburn | 5.3% | 13.4%(-8.16)#10 | 16.9%(-11.7)#3,154 |
| 11. | Ellsworth | 5.7% | 13.4%(-7.70)#11 | 16.9%(-11.2)#3,479 |
| 12. | Cape Neddick | 5.8% | 13.4%(-7.64)#12 | 16.9%(-11.2)#3,523 |
| 13. | Ashland | 6.5% | 13.4%(-6.93)#13 | 16.9%(-10.4)#4,027 |
| 14. | Fort Fairfield | 6.8% | 13.4%(-6.63)#14 | 16.9%(-10.1)#4,217 |
| 15. | Camden | 6.8% | 13.4%(-6.60)#15 | 16.9%(-10.1)#4,245 |
| 16. | Bradley | 7.0% | 13.4%(-6.39)#16 | 16.9%(-9.91)#4,397 |
| 17. | Southwest Harbor | 7.1% | 13.4%(-6.34)#17 | 16.9%(-9.86)#4,425 |
| 18. | Fort Kent | 7.1% | 13.4%(-6.28)#18 | 16.9%(-9.80)#4,464 |
| 19. | Hampden | 7.2% | 13.4%(-6.21)#19 | 16.9%(-9.73)#4,532 |
| 20. | Saco | 7.7% | 13.4%(-5.73)#20 | 16.9%(-9.24)#4,847 |
| 21. | Skowhegan | 8.1% | 13.4%(-5.32)#21 | 16.9%(-8.84)#5,090 |
| 22. | Brunswick | 8.2% | 13.4%(-5.27)#22 | 16.9%(-8.79)#5,127 |
| 23. | Corinna | 8.2% | 13.4%(-5.26)#23 | 16.9%(-8.78)#5,137 |
| 24. | Orono | 8.6% | 13.4%(-4.80)#24 | 16.9%(-8.32)#5,437 |
| 25. | Limestone | 8.6% | 13.4%(-4.78)#25 | 16.9%(-8.30)#5,454 |
| 26. | Mechanic Falls | 8.7% | 13.4%(-4.71)#26 | 16.9%(-8.23)#5,507 |
| 27. | Bingham | 8.8% | 13.4%(-4.63)#27 | 16.9%(-8.15)#5,562 |
| 28. | Hallowell | 9.2% | 13.4%(-4.27)#28 | 16.9%(-7.79)#5,834 |
| 29. | Caribou | 9.3% | 13.4%(-4.16)#29 | 16.9%(-7.68)#5,898 |
| 30. | Veazie | 10.1% | 13.4%(-3.32)#30 | 16.9%(-6.84)#6,430 |
| 31. | Newport | 10.4% | 13.4%(-2.99)#31 | 16.9%(-6.50)#6,615 |
| 32. | Portland | 10.9% | 13.4%(-2.50)#32 | 16.9%(-6.02)#6,918 |
| 33. | Kennebunk | 11.4% | 13.4%(-2.07)#33 | 16.9%(-5.59)#7,197 |
| 34. | Richmond | 11.4% | 13.4%(-1.98)#34 | 16.9%(-5.50)#7,255 |
| 35. | West Kennebunk | 12.3% | 13.4%(-1.11)#35 | 16.9%(-4.63)#7,781 |
| 36. | Livermore Falls | 12.4% | 13.4%(-0.981)#36 | 16.9%(-4.50)#7,848 |
| 37. | Cornish | 12.5% | 13.4%(-0.920)#37 | 16.9%(-4.44)#7,882 |
| 38. | Auburn | 12.5% | 13.4%(-0.879)#38 | 16.9%(-4.40)#7,922 |
| 39. | Woodland | 14.1% | 13.4%(+0.710)#39 | 16.9%(-2.81)#8,766 |
| 40. | Wilton | 14.7% | 13.4%(+1.28)#40 | 16.9%(-2.24)#9,071 |
| 41. | Yarmouth | 14.8% | 13.4%(+1.42)#41 | 16.9%(-2.10)#9,148 |
| 42. | Oakfield | 15.2% | 13.4%(+1.73)#42 | 16.9%(-1.79)#9,308 |
| 43. | Hartland | 15.4% | 13.4%(+1.96)#43 | 16.9%(-1.55)#9,438 |
| 44. | Kittery | 15.5% | 13.4%(+2.05)#44 | 16.9%(-1.47)#9,481 |
| 45. | Alfred | 15.9% | 13.4%(+2.52)#45 | 16.9%(-0.997)#9,733 |
| 46. | Bucksport | 16.1% | 13.4%(+2.66)#46 | 16.9%(-0.856)#9,812 |
| 47. | Dover Foxcroft | 16.2% | 13.4%(+2.80)#47 | 16.9%(-0.723)#9,890 |
| 48. | Madawaska | 17.2% | 13.4%(+3.73)#48 | 16.9%(+0.212)#10,353 |
| 49. | Sanford | 17.2% | 13.4%(+3.75)#49 | 16.9%(+0.230)#10,360 |
| 50. | Topsham | 17.2% | 13.4%(+3.76)#50 | 16.9%(+0.244)#10,368 |
| 51. | Lisbon Falls | 17.3% | 13.4%(+3.91)#51 | 16.9%(+0.391)#10,443 |
| 52. | Millinocket | 17.9% | 13.4%(+4.44)#52 | 16.9%(+0.918)#10,681 |
| 53. | Milo | 18.1% | 13.4%(+4.70)#53 | 16.9%(+1.18)#10,806 |
| 54. | Kezar Falls | 18.2% | 13.4%(+4.76)#54 | 16.9%(+1.24)#10,832 |
| 55. | Mexico | 18.6% | 13.4%(+5.22)#55 | 16.9%(+1.70)#11,072 |
| 56. | Unity | 18.9% | 13.4%(+5.50)#56 | 16.9%(+1.98)#11,220 |
| 57. | Bangor | 19.0% | 13.4%(+5.59)#57 | 16.9%(+2.07)#11,263 |
| 58. | Bath | 19.9% | 13.4%(+6.46)#58 | 16.9%(+2.94)#11,649 |
| 59. | Dixfield | 20.7% | 13.4%(+7.30)#59 | 16.9%(+3.78)#12,049 |
| 60. | Westbrook | 20.8% | 13.4%(+7.36)#60 | 16.9%(+3.84)#12,070 |
| 61. | Old Orchard Beach | 21.8% | 13.4%(+8.41)#61 | 16.9%(+4.89)#12,522 |
| 62. | Dexter | 22.1% | 13.4%(+8.66)#62 | 16.9%(+5.14)#12,621 |
| 63. | Oakland | 22.2% | 13.4%(+8.74)#63 | 16.9%(+5.22)#12,647 |
| 64. | Brewer | 22.8% | 13.4%(+9.34)#64 | 16.9%(+5.82)#12,897 |
| 65. | Calais | 23.3% | 13.4%(+9.88)#65 | 16.9%(+6.36)#13,112 |
| 66. | Freeport | 23.4% | 13.4%(+9.96)#66 | 16.9%(+6.45)#13,155 |
| 67. | Gardiner | 23.4% | 13.4%(+10.0)#67 | 16.9%(+6.50)#13,178 |
| 68. | Biddeford | 23.6% | 13.4%(+10.1)#68 | 16.9%(+6.62)#13,235 |
| 69. | Steep Falls | 23.7% | 13.4%(+10.3)#69 | 16.9%(+6.77)#13,277 |
| 70. | Mars Hill | 23.7% | 13.4%(+10.3)#70 | 16.9%(+6.79)#13,283 |
| 71. | Fairfield | 25.9% | 13.4%(+12.5)#71 | 16.9%(+8.96)#14,061 |
| 72. | Waterville | 26.2% | 13.4%(+12.7)#72 | 16.9%(+9.22)#14,149 |
| 73. | East Millinocket | 26.2% | 13.4%(+12.7)#73 | 16.9%(+9.23)#14,153 |
| 74. | Lewiston | 27.3% | 13.4%(+13.9)#74 | 16.9%(+10.3)#14,569 |
| 75. | Rumford | 27.6% | 13.4%(+14.2)#75 | 16.9%(+10.7)#14,691 |
| 76. | Milbridge | 28.9% | 13.4%(+15.5)#76 | 16.9%(+12.0)#15,103 |
| 77. | Milford | 29.4% | 13.4%(+16.0)#77 | 16.9%(+12.5)#15,234 |
| 78. | Presque Isle | 29.6% | 13.4%(+16.2)#78 | 16.9%(+12.7)#15,306 |
| 79. | Brownville Junction | 29.7% | 13.4%(+16.3)#79 | 16.9%(+12.8)#15,325 |
| 80. | Old Town | 29.8% | 13.4%(+16.4)#80 | 16.9%(+12.8)#15,340 |
| 81. | Kingfield | 30.0% | 13.4%(+16.6)#81 | 16.9%(+13.1)#15,398 |
| 82. | Van Buren | 31.7% | 13.4%(+18.3)#82 | 16.9%(+14.8)#15,919 |
| 83. | Randolph | 32.0% | 13.4%(+18.6)#83 | 16.9%(+15.0)#15,978 |
| 84. | Lake Arrowhead | 32.3% | 13.4%(+18.9)#84 | 16.9%(+15.4)#16,078 |
| 85. | Pittsfield | 34.5% | 13.4%(+21.1)#85 | 16.9%(+17.6)#16,622 |
| 86. | Houlton | 35.1% | 13.4%(+21.6)#86 | 16.9%(+18.1)#16,753 |
| 87. | Rockland | 35.1% | 13.4%(+21.7)#87 | 16.9%(+18.2)#16,773 |
| 88. | Howland | 35.4% | 13.4%(+22.0)#88 | 16.9%(+18.5)#16,833 |
| 89. | Machias | 35.9% | 13.4%(+22.4)#89 | 16.9%(+18.9)#16,941 |
| 90. | Jonesport | 36.4% | 13.4%(+22.9)#90 | 16.9%(+19.4)#17,031 |
| 91. | Anson | 37.1% | 13.4%(+23.7)#91 | 16.9%(+20.2)#17,198 |
| 92. | Belfast | 38.7% | 13.4%(+25.3)#92 | 16.9%(+21.8)#17,518 |
| 93. | Madison | 41.4% | 13.4%(+28.0)#93 | 16.9%(+24.4)#18,017 |
| 94. | Island Falls | 45.9% | 13.4%(+32.5)#94 | 16.9%(+29.0)#18,750 |
| 95. | Farmington | 46.8% | 13.4%(+33.4)#95 | 16.9%(+29.9)#18,910 |
| 96. | Augusta | 48.5% | 13.4%(+35.1)#96 | 16.9%(+31.6)#19,133 |
| 97. | South Paris | 50.3% | 13.4%(+36.9)#97 | 16.9%(+33.4)#19,362 |
| 98. | Bridgton | 50.9% | 13.4%(+37.5)#98 | 16.9%(+33.9)#19,411 |
| 99. | Greene | 52.8% | 13.4%(+39.4)#99 | 16.9%(+35.9)#19,616 |
| 100. | Farmingdale | 53.0% | 13.4%(+39.6)#100 | 16.9%(+36.0)#19,632 |
1
2Common Questions
What are the Top 10 Cities with the Lowest Poverty Level Among Children Under the Age of 16 in Maine?
Top 10 Cities with the Lowest Poverty Level Among Children Under the Age of 16 in Maine are:
#1
1.1%
#2
1.6%
#3
2.5%
#4
2.6%
#5
2.9%
#6
3.2%
#7
3.3%
#8
5.3%
#9
5.7%
#10
5.8%
What city has the Lowest Poverty Level Among Children Under the Age of 16 in Maine?
Thomaston has the Lowest Poverty Level Among Children Under the Age of 16 in Maine with 1.1%.
What is the Poverty Level Among Children Under the Age of 16 in the State of Maine?
Poverty Level Among Children Under the Age of 16 in Maine is 13.4%.
What is the Poverty Level Among Children Under the Age of 16 in the United States?
Poverty Level Among Children Under the Age of 16 in the United States is 16.9%.