Cities with the Lowest Poverty Level Among Children Under the Age of 16 in Oklahoma
RELATED REPORTS & OPTIONS
Lowest Poverty | Child 0-16
Oklahoma
Compare Cities
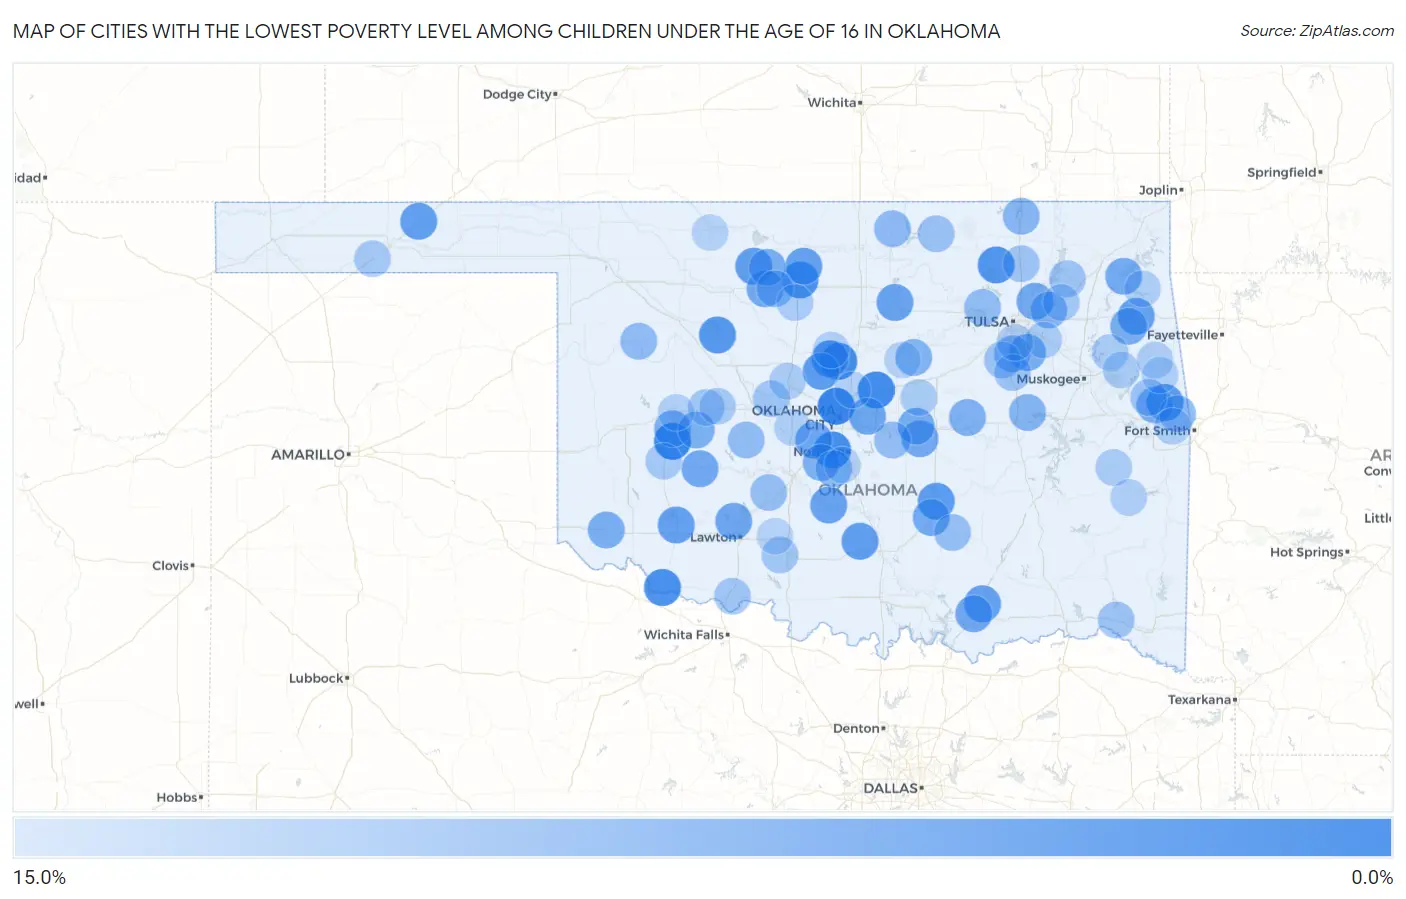
Map of Cities with the Lowest Poverty Level Among Children Under the Age of 16 in Oklahoma
15.0%
0.0%
Cities with the Lowest Poverty Level Among Children Under the Age of 16 in Oklahoma
| City | Child Poverty | vs State | vs National | |
| 1. | Nichols Hills | 0.78% | 20.7%(-19.9)#1 | 16.9%(-16.2)#165 |
| 2. | New Cordell | 0.99% | 20.7%(-19.7)#2 | 16.9%(-15.9)#277 |
| 3. | Luther | 1.7% | 20.7%(-19.0)#3 | 16.9%(-15.2)#728 |
| 4. | Newcastle | 1.8% | 20.7%(-18.9)#4 | 16.9%(-15.1)#793 |
| 5. | Rocky Point | 2.0% | 20.7%(-18.7)#5 | 16.9%(-14.9)#937 |
| 6. | Cedar Valley | 2.0% | 20.7%(-18.7)#6 | 16.9%(-14.9)#939 |
| 7. | Davidson | 2.3% | 20.7%(-18.4)#7 | 16.9%(-14.7)#1,088 |
| 8. | North Enid | 2.8% | 20.7%(-17.9)#8 | 16.9%(-14.1)#1,489 |
| 9. | Barnsdall | 3.1% | 20.7%(-17.6)#9 | 16.9%(-13.8)#1,668 |
| 10. | Cimarron City | 3.3% | 20.7%(-17.4)#10 | 16.9%(-13.6)#1,841 |
| 11. | Canton | 3.6% | 20.7%(-17.1)#11 | 16.9%(-13.3)#2,026 |
| 12. | Stoney Point | 3.7% | 20.7%(-17.0)#12 | 16.9%(-13.2)#2,088 |
| 13. | Byng | 4.0% | 20.7%(-16.7)#13 | 16.9%(-13.0)#2,263 |
| 14. | Cashion | 4.0% | 20.7%(-16.7)#14 | 16.9%(-13.0)#2,266 |
| 15. | Katie | 4.3% | 20.7%(-16.5)#15 | 16.9%(-12.7)#2,459 |
| 16. | Helena | 4.4% | 20.7%(-16.3)#16 | 16.9%(-12.5)#2,559 |
| 17. | Hooker | 4.5% | 20.7%(-16.2)#17 | 16.9%(-12.4)#2,643 |
| 18. | Keefton | 4.7% | 20.7%(-16.0)#18 | 16.9%(-12.3)#2,754 |
| 19. | Caddo | 4.7% | 20.7%(-16.0)#19 | 16.9%(-12.2)#2,778 |
| 20. | Mountain Park | 4.8% | 20.7%(-16.0)#20 | 16.9%(-12.2)#2,809 |
| 21. | Kremlin | 4.8% | 20.7%(-16.0)#21 | 16.9%(-12.2)#2,812 |
| 22. | Leach | 4.9% | 20.7%(-15.8)#22 | 16.9%(-12.0)#2,932 |
| 23. | Morrison | 5.0% | 20.7%(-15.7)#23 | 16.9%(-11.9)#2,971 |
| 24. | Lindsay | 5.1% | 20.7%(-15.6)#24 | 16.9%(-11.9)#3,025 |
| 25. | Choctaw | 5.4% | 20.7%(-15.3)#25 | 16.9%(-11.5)#3,259 |
| 26. | Tuttle | 5.5% | 20.7%(-15.2)#26 | 16.9%(-11.4)#3,302 |
| 27. | Medicine Park | 5.6% | 20.7%(-15.2)#27 | 16.9%(-11.4)#3,353 |
| 28. | Preston | 5.8% | 20.7%(-15.0)#28 | 16.9%(-11.2)#3,521 |
| 29. | Owasso | 5.9% | 20.7%(-14.8)#29 | 16.9%(-11.1)#3,577 |
| 30. | Mountain View | 5.9% | 20.7%(-14.8)#30 | 16.9%(-11.1)#3,592 |
| 31. | Armstrong | 5.9% | 20.7%(-14.8)#31 | 16.9%(-11.1)#3,604 |
| 32. | Earlsboro | 6.1% | 20.7%(-14.7)#32 | 16.9%(-10.9)#3,739 |
| 33. | Meno | 6.1% | 20.7%(-14.7)#33 | 16.9%(-10.9)#3,745 |
| 34. | Disney | 6.2% | 20.7%(-14.5)#34 | 16.9%(-10.7)#3,880 |
| 35. | Latta | 6.3% | 20.7%(-14.5)#35 | 16.9%(-10.7)#3,889 |
| 36. | Johnson | 6.3% | 20.7%(-14.4)#36 | 16.9%(-10.6)#3,926 |
| 37. | Bixby | 6.4% | 20.7%(-14.3)#37 | 16.9%(-10.6)#3,955 |
| 38. | Haywood | 6.5% | 20.7%(-14.2)#38 | 16.9%(-10.4)#4,029 |
| 39. | Goltry | 6.5% | 20.7%(-14.2)#39 | 16.9%(-10.4)#4,051 |
| 40. | Teresita | 6.5% | 20.7%(-14.2)#40 | 16.9%(-10.4)#4,053 |
| 41. | East Duke | 6.7% | 20.7%(-14.1)#41 | 16.9%(-10.3)#4,151 |
| 42. | Bessie | 6.8% | 20.7%(-13.9)#42 | 16.9%(-10.2)#4,214 |
| 43. | Corn | 6.9% | 20.7%(-13.8)#43 | 16.9%(-10.0)#4,322 |
| 44. | Blanchard | 7.1% | 20.7%(-13.7)#44 | 16.9%(-9.88)#4,406 |
| 45. | Castle | 7.1% | 20.7%(-13.6)#45 | 16.9%(-9.80)#4,493 |
| 46. | Brushy | 7.3% | 20.7%(-13.4)#46 | 16.9%(-9.67)#4,557 |
| 47. | Agra | 7.6% | 20.7%(-13.1)#47 | 16.9%(-9.37)#4,757 |
| 48. | Grayson | 7.7% | 20.7%(-13.0)#48 | 16.9%(-9.25)#4,841 |
| 49. | Verdigris | 7.8% | 20.7%(-13.0)#49 | 16.9%(-9.18)#4,882 |
| 50. | Glenpool | 7.8% | 20.7%(-12.9)#50 | 16.9%(-9.16)#4,898 |
| 51. | Copan | 7.9% | 20.7%(-12.8)#51 | 16.9%(-9.04)#4,965 |
| 52. | Long | 8.1% | 20.7%(-12.6)#52 | 16.9%(-8.85)#5,085 |
| 53. | Cole | 8.3% | 20.7%(-12.5)#53 | 16.9%(-8.69)#5,188 |
| 54. | Kildare | 8.3% | 20.7%(-12.4)#54 | 16.9%(-8.61)#5,268 |
| 55. | Camargo | 8.5% | 20.7%(-12.2)#55 | 16.9%(-8.43)#5,372 |
| 56. | Chance | 8.7% | 20.7%(-12.0)#56 | 16.9%(-8.24)#5,497 |
| 57. | Prue | 8.7% | 20.7%(-12.0)#57 | 16.9%(-8.19)#5,530 |
| 58. | Binger | 8.8% | 20.7%(-11.9)#58 | 16.9%(-8.17)#5,550 |
| 59. | Lahoma | 9.0% | 20.7%(-11.7)#59 | 16.9%(-7.96)#5,713 |
| 60. | Bethel Acres | 9.0% | 20.7%(-11.7)#60 | 16.9%(-7.92)#5,738 |
| 61. | Whitehorn Cove | 9.1% | 20.7%(-11.6)#61 | 16.9%(-7.85)#5,771 |
| 62. | Cement | 9.1% | 20.7%(-11.6)#62 | 16.9%(-7.85)#5,786 |
| 63. | Stonewall | 9.2% | 20.7%(-11.5)#63 | 16.9%(-7.73)#5,862 |
| 64. | Shidler | 9.5% | 20.7%(-11.2)#64 | 16.9%(-7.42)#6,065 |
| 65. | Flute Springs | 9.5% | 20.7%(-11.2)#65 | 16.9%(-7.42)#6,074 |
| 66. | Mounds | 9.6% | 20.7%(-11.2)#66 | 16.9%(-7.38)#6,092 |
| 67. | Ramona | 9.8% | 20.7%(-10.9)#67 | 16.9%(-7.11)#6,240 |
| 68. | Winchester | 9.9% | 20.7%(-10.8)#68 | 16.9%(-7.04)#6,294 |
| 69. | Valliant | 9.9% | 20.7%(-10.8)#69 | 16.9%(-7.00)#6,311 |
| 70. | Bushyhead | 10.0% | 20.7%(-10.8)#70 | 16.9%(-6.97)#6,324 |
| 71. | Calumet | 10.0% | 20.7%(-10.7)#71 | 16.9%(-6.94)#6,356 |
| 72. | Randlett | 10.0% | 20.7%(-10.7)#72 | 16.9%(-6.94)#6,362 |
| 73. | Nashoba | 10.0% | 20.7%(-10.7)#73 | 16.9%(-6.94)#6,390 |
| 74. | Weatherford | 10.2% | 20.7%(-10.5)#74 | 16.9%(-6.71)#6,495 |
| 75. | Empire City | 10.3% | 20.7%(-10.4)#75 | 16.9%(-6.59)#6,561 |
| 76. | Justice | 10.4% | 20.7%(-10.3)#76 | 16.9%(-6.53)#6,599 |
| 77. | Goodwell | 10.6% | 20.7%(-10.1)#77 | 16.9%(-6.31)#6,738 |
| 78. | Rocky | 10.7% | 20.7%(-10.0)#78 | 16.9%(-6.22)#6,788 |
| 79. | Hydro | 10.8% | 20.7%(-9.90)#79 | 16.9%(-6.12)#6,849 |
| 80. | Hulbert | 11.0% | 20.7%(-9.74)#80 | 16.9%(-5.96)#6,942 |
| 81. | Broken Arrow | 11.0% | 20.7%(-9.74)#81 | 16.9%(-5.96)#6,944 |
| 82. | Okarche | 11.0% | 20.7%(-9.70)#82 | 16.9%(-5.92)#6,974 |
| 83. | Waukomis | 11.1% | 20.7%(-9.61)#83 | 16.9%(-5.83)#7,036 |
| 84. | Zeb | 11.1% | 20.7%(-9.61)#84 | 16.9%(-5.83)#7,052 |
| 85. | Lequire | 11.1% | 20.7%(-9.61)#85 | 16.9%(-5.83)#7,070 |
| 86. | Sparks | 11.1% | 20.7%(-9.61)#86 | 16.9%(-5.83)#7,071 |
| 87. | Jenks | 11.2% | 20.7%(-9.54)#87 | 16.9%(-5.76)#7,105 |
| 88. | Titanic | 11.2% | 20.7%(-9.48)#88 | 16.9%(-5.70)#7,132 |
| 89. | Muldrow | 11.4% | 20.7%(-9.37)#89 | 16.9%(-5.59)#7,198 |
| 90. | Union City | 11.4% | 20.7%(-9.36)#90 | 16.9%(-5.58)#7,203 |
| 91. | Le Flore | 11.4% | 20.7%(-9.36)#91 | 16.9%(-5.58)#7,213 |
| 92. | New Eucha | 11.5% | 20.7%(-9.24)#92 | 16.9%(-5.46)#7,273 |
| 93. | Crescent | 11.6% | 20.7%(-9.15)#93 | 16.9%(-5.37)#7,323 |
| 94. | Clinton | 11.6% | 20.7%(-9.11)#94 | 16.9%(-5.33)#7,354 |
| 95. | Lyons Switch | 11.7% | 20.7%(-9.07)#95 | 16.9%(-5.29)#7,371 |
| 96. | Alva | 11.8% | 20.7%(-8.96)#96 | 16.9%(-5.18)#7,433 |
| 97. | Edmond | 11.8% | 20.7%(-8.92)#97 | 16.9%(-5.14)#7,477 |
| 98. | Tryon | 11.9% | 20.7%(-8.81)#98 | 16.9%(-5.03)#7,529 |
| 99. | Central High | 11.9% | 20.7%(-8.80)#99 | 16.9%(-5.02)#7,539 |
| 100. | Goldsby | 12.0% | 20.7%(-8.77)#100 | 16.9%(-4.99)#7,557 |
Common Questions
What are the Top 10 Cities with the Lowest Poverty Level Among Children Under the Age of 16 in Oklahoma?
Top 10 Cities with the Lowest Poverty Level Among Children Under the Age of 16 in Oklahoma are:
#1
0.78%
#2
0.99%
#3
1.7%
#4
1.8%
#5
2.0%
#6
2.3%
#7
2.8%
#8
3.1%
#9
3.3%
#10
3.6%
What city has the Lowest Poverty Level Among Children Under the Age of 16 in Oklahoma?
Nichols Hills has the Lowest Poverty Level Among Children Under the Age of 16 in Oklahoma with 0.78%.
What is the Poverty Level Among Children Under the Age of 16 in the State of Oklahoma?
Poverty Level Among Children Under the Age of 16 in Oklahoma is 20.7%.
What is the Poverty Level Among Children Under the Age of 16 in the United States?
Poverty Level Among Children Under the Age of 16 in the United States is 16.9%.